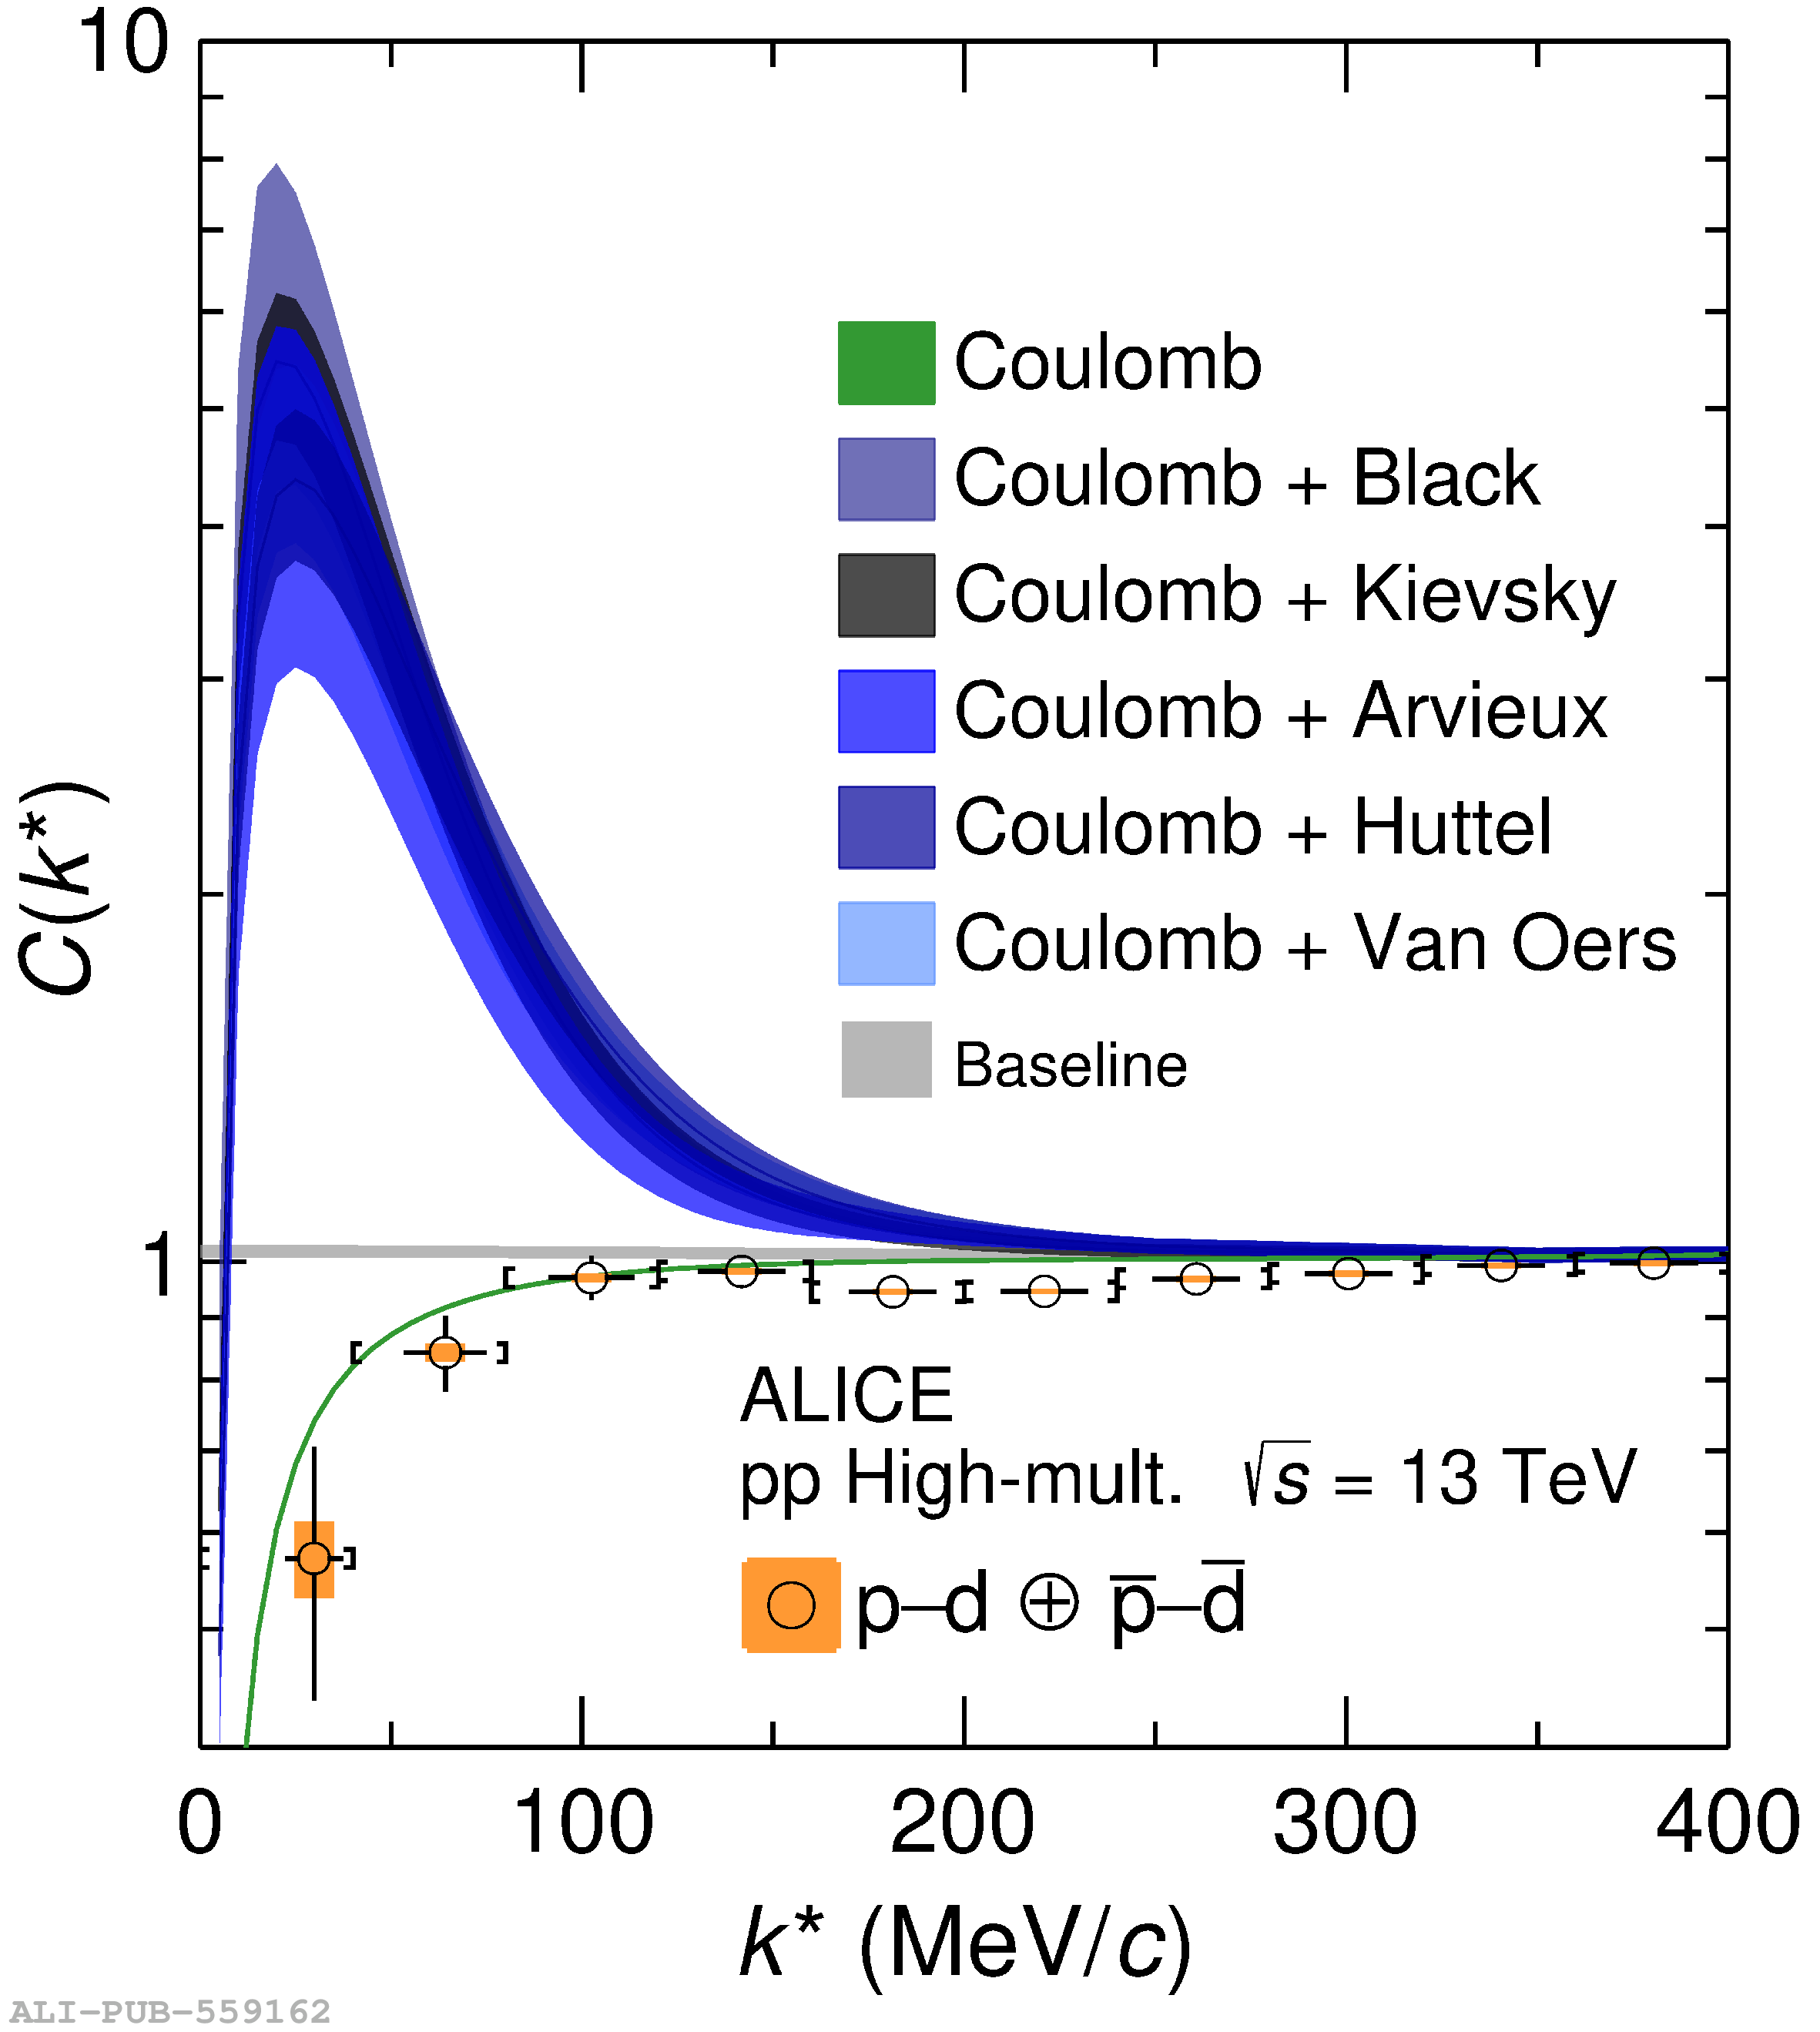
Measured \kd (left) and \pd (right) correlation functions. The data are shown by the black symbols, the bars and the colored boxes represent the statistical and systematic uncertainties, respectively. The square brackets show the bin width of the measurement, while the horizontal black lines represent the statistical uncertainty in the determination of the mean $\ks$ for each bin. Data are compared with theoretical correlation functions, shown by colored bands, obtained using the LL approximation. The bandwidths represent the uncertainties in the determination of the radius and the residual contributions. See text for details. | 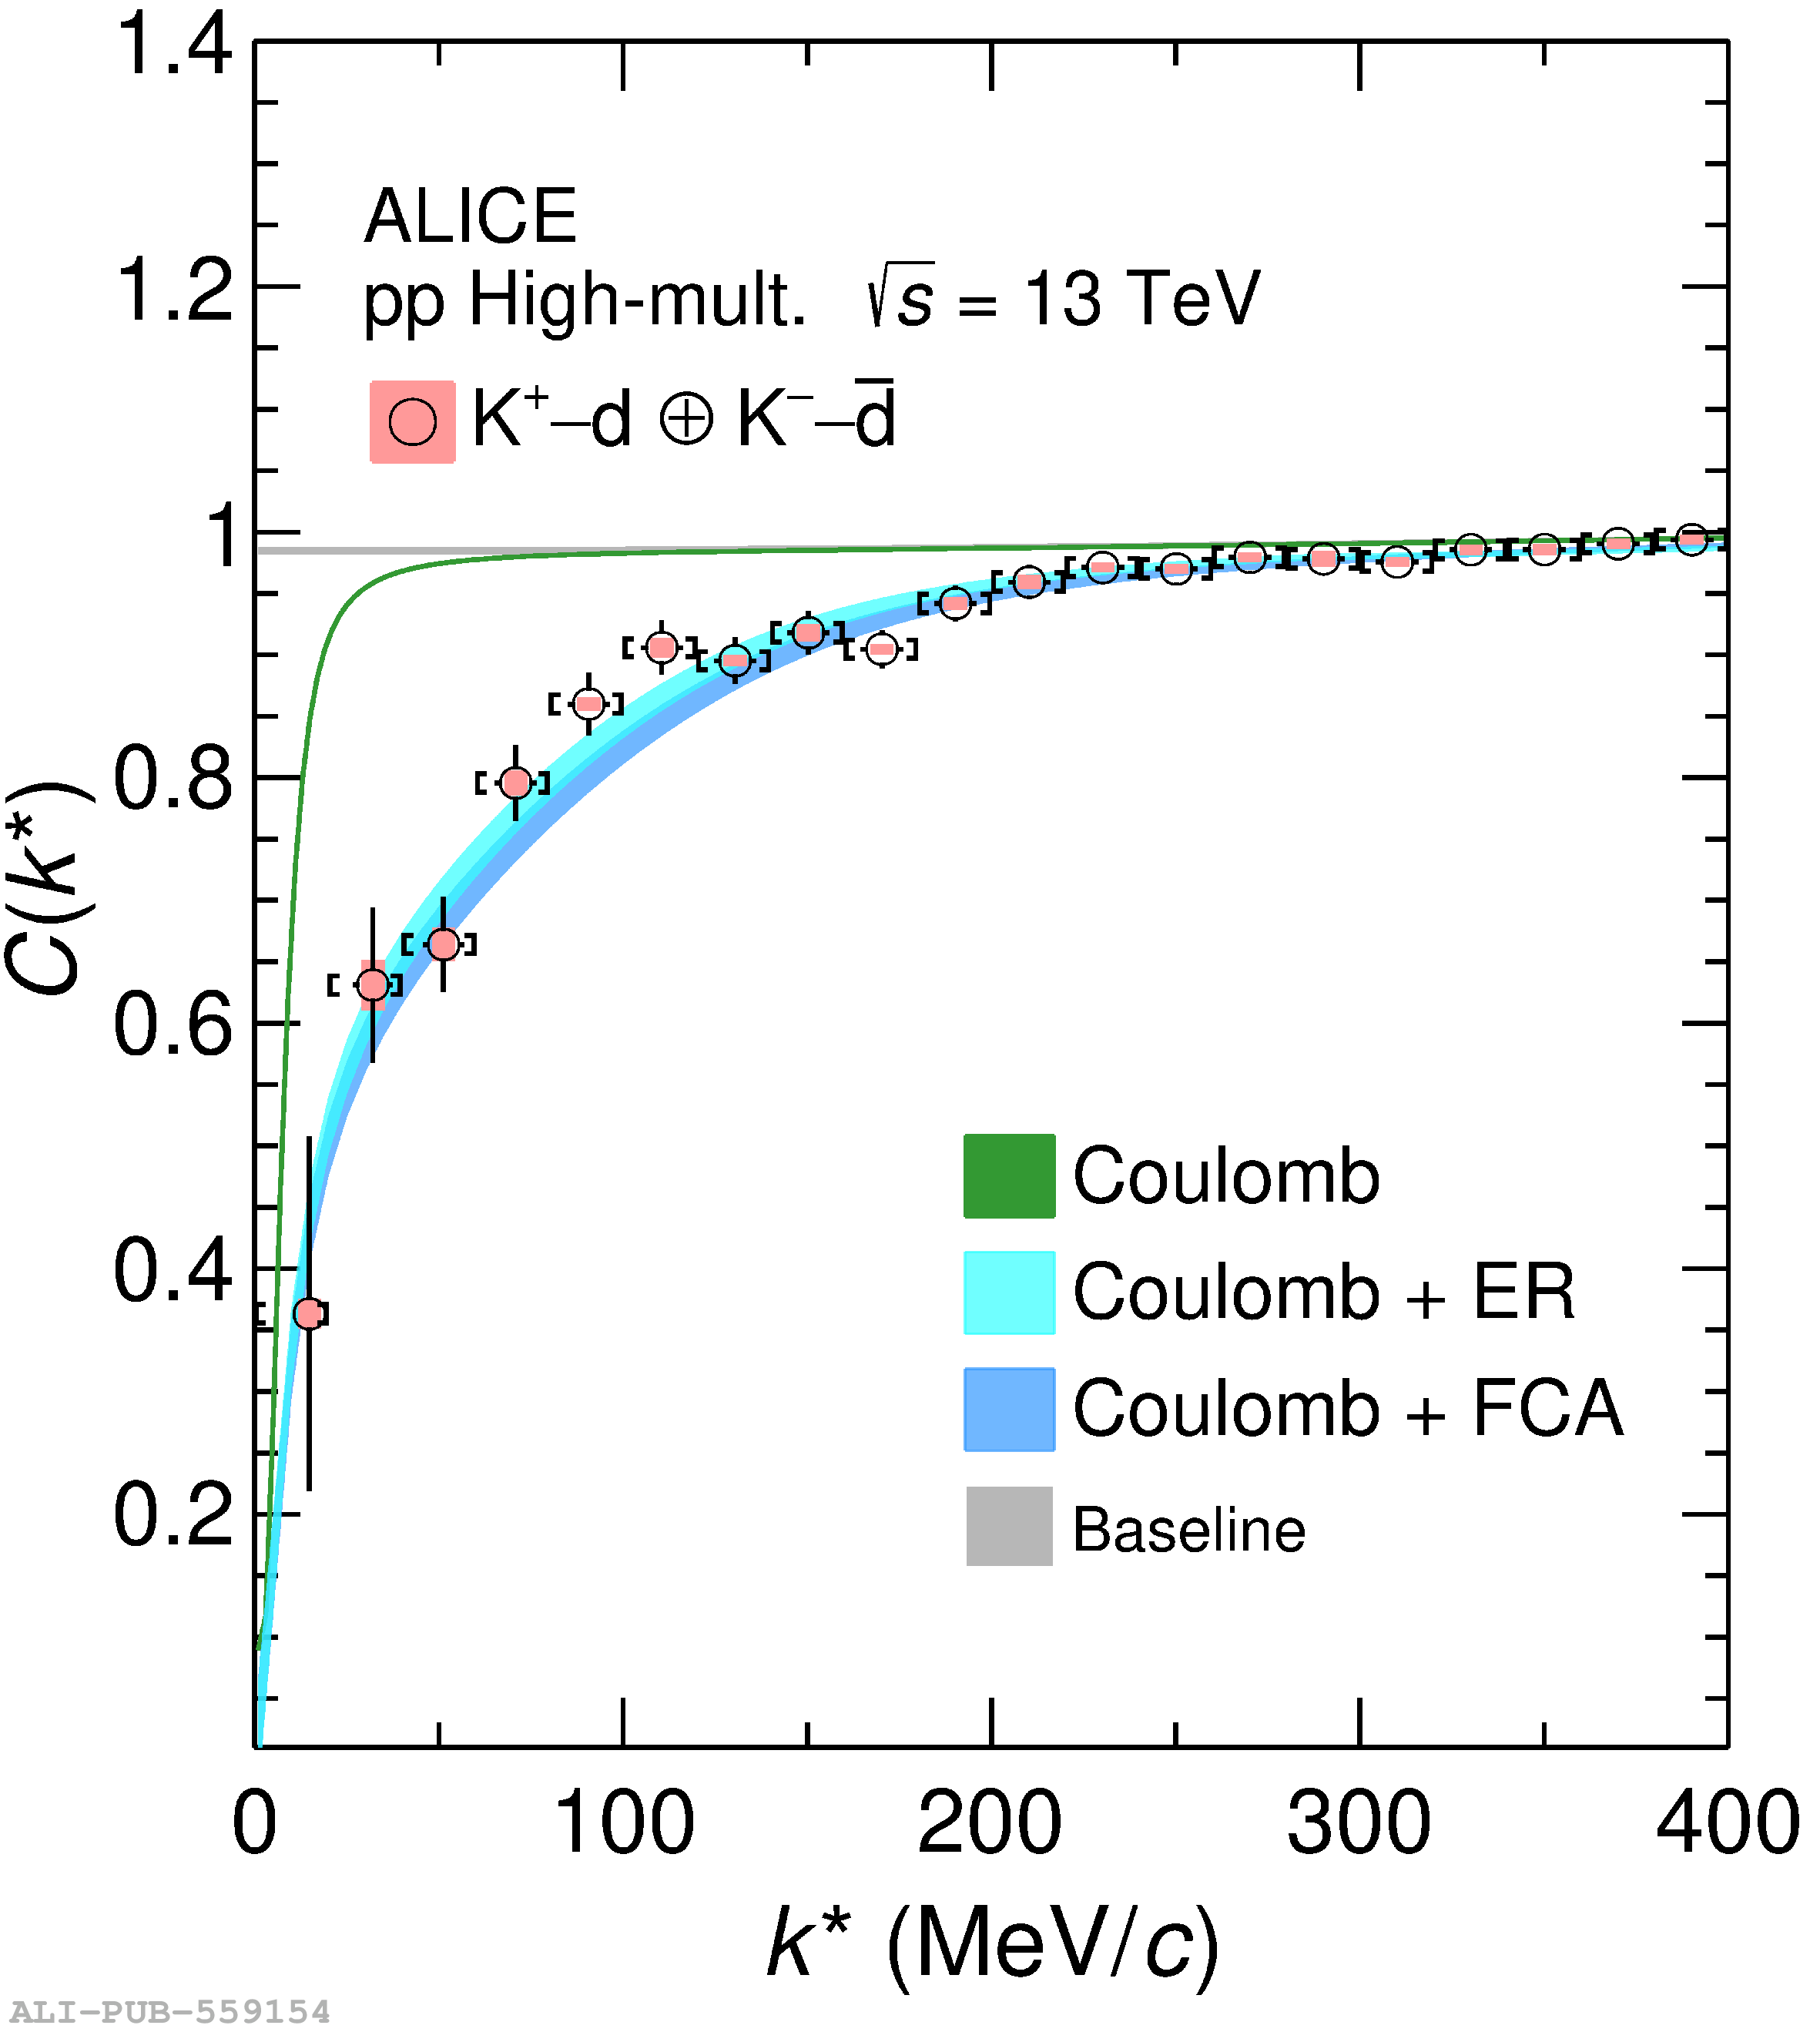  |