Upper panels: corrected \DrecoilpTch\ distributions measured for $\rr=0.2$ (left), 0.4 (middle), and 0.5 (right) in \pp\ collisions at $\sqrts=5.02$ TeV, compared to calculations from JETSCAPE , JEWEL , PYTHIA8 , and POWHEG . Lower panels: ratio of the data and calculations to a functional fit of the measured \DrecoilpTch\ distributions. | 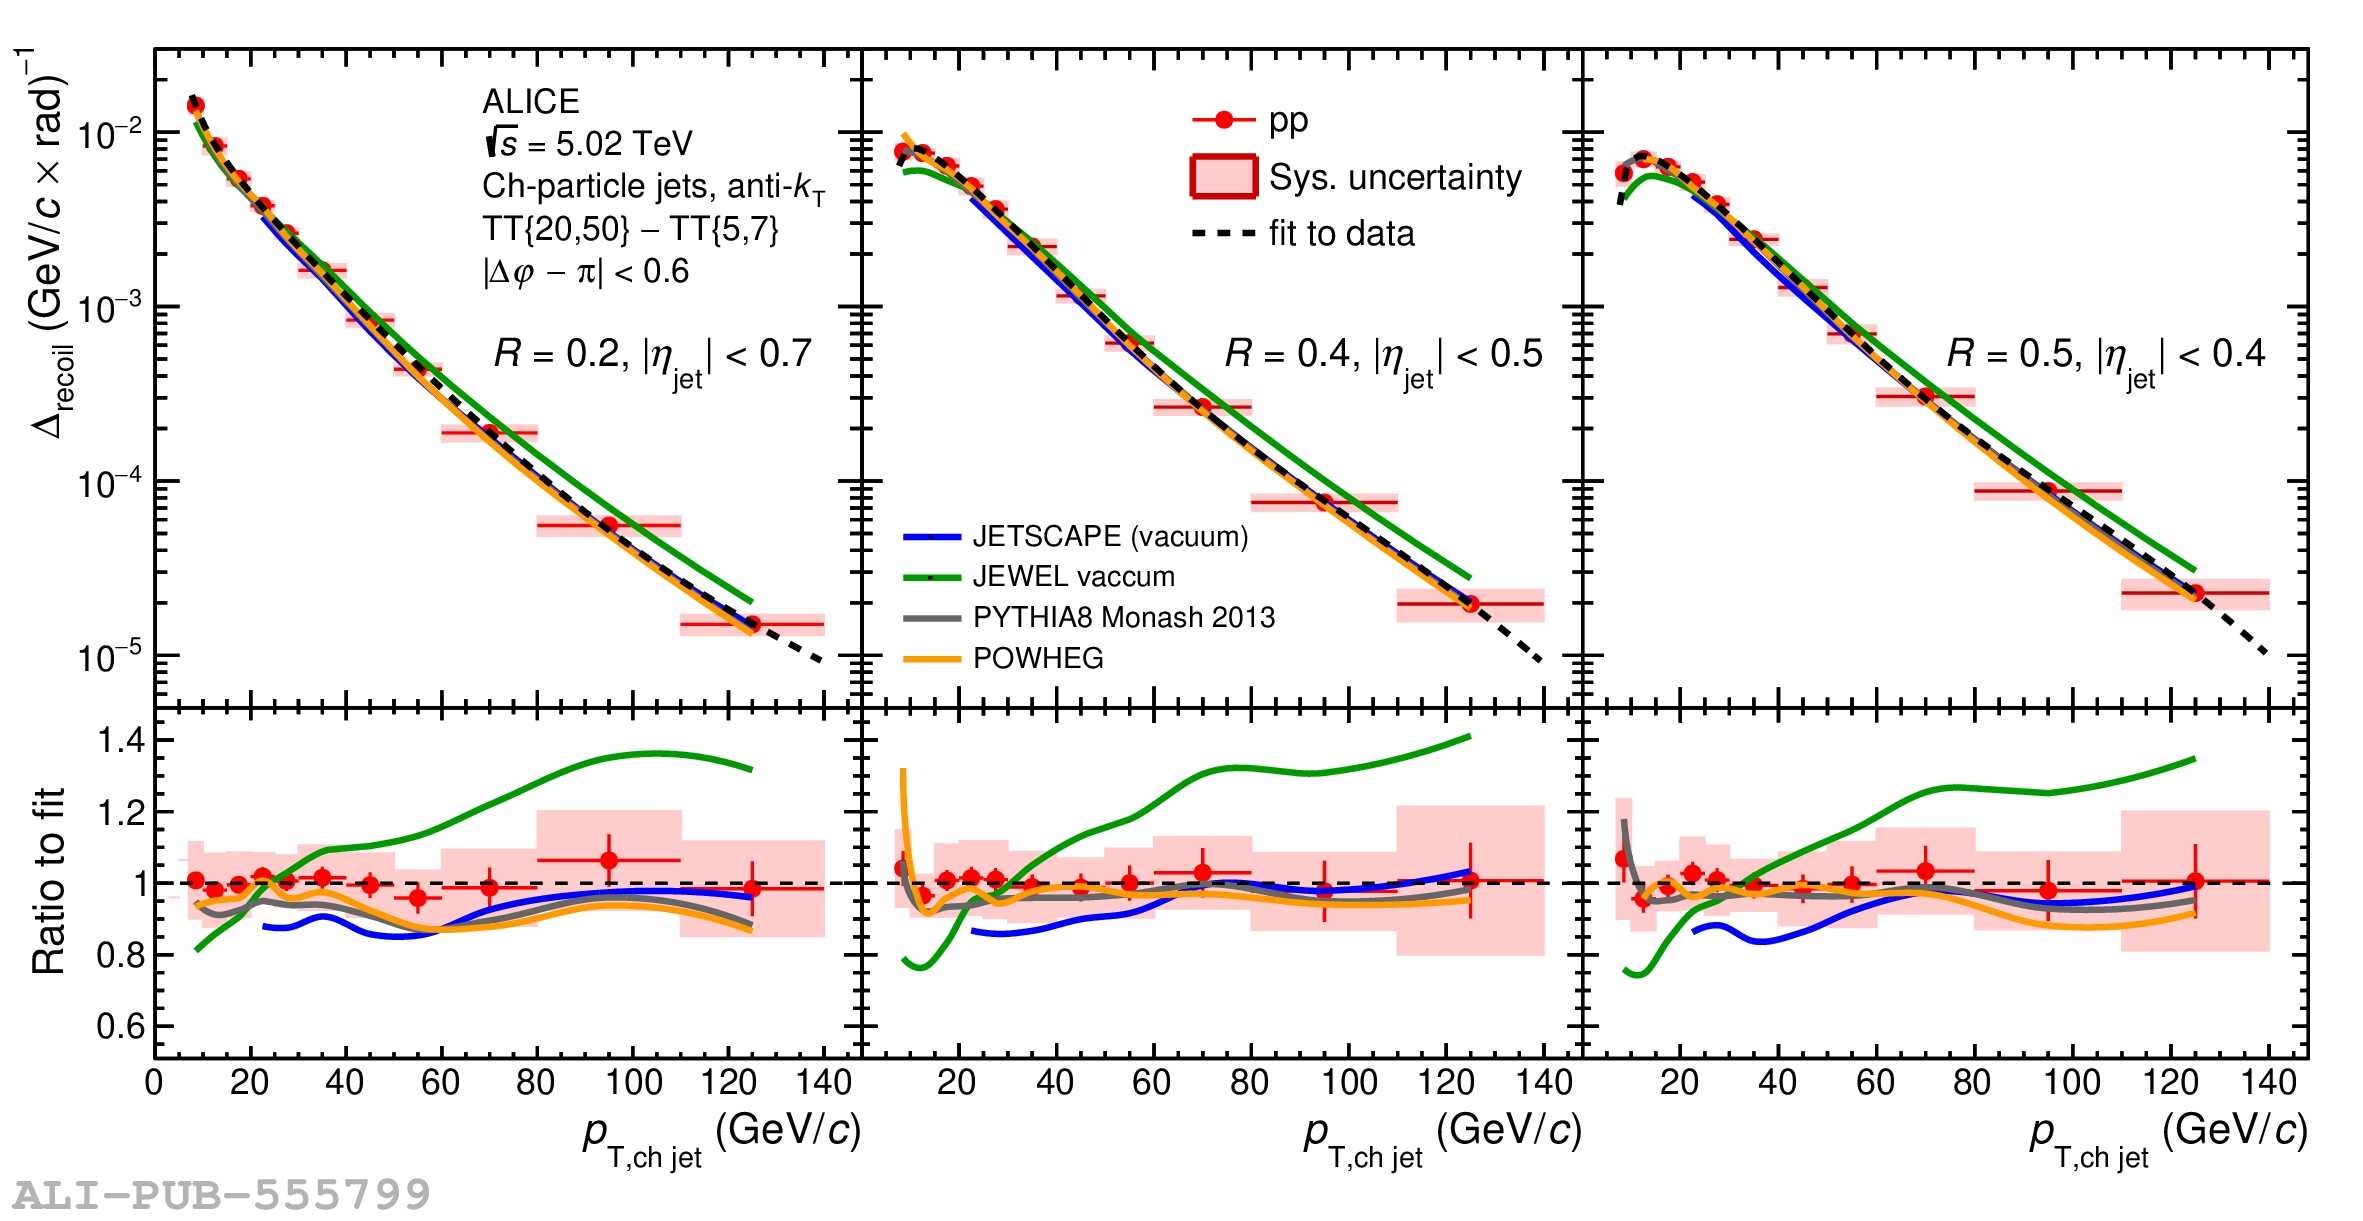 |