Scaling factor \cRef\ of \Drecoilphi\ for $\rr=0.2$, 0.4, and 0.5. The vertical bars indicate the statistical uncertainties. The value of \cRef\ for the \DrecoilpT\ analysis, which integrates over the region $|\dphi - \pi| < 0.6$, is displayed as a horizontal bar for each value of \rr, with shaded bands indicating statistical uncertainty. | 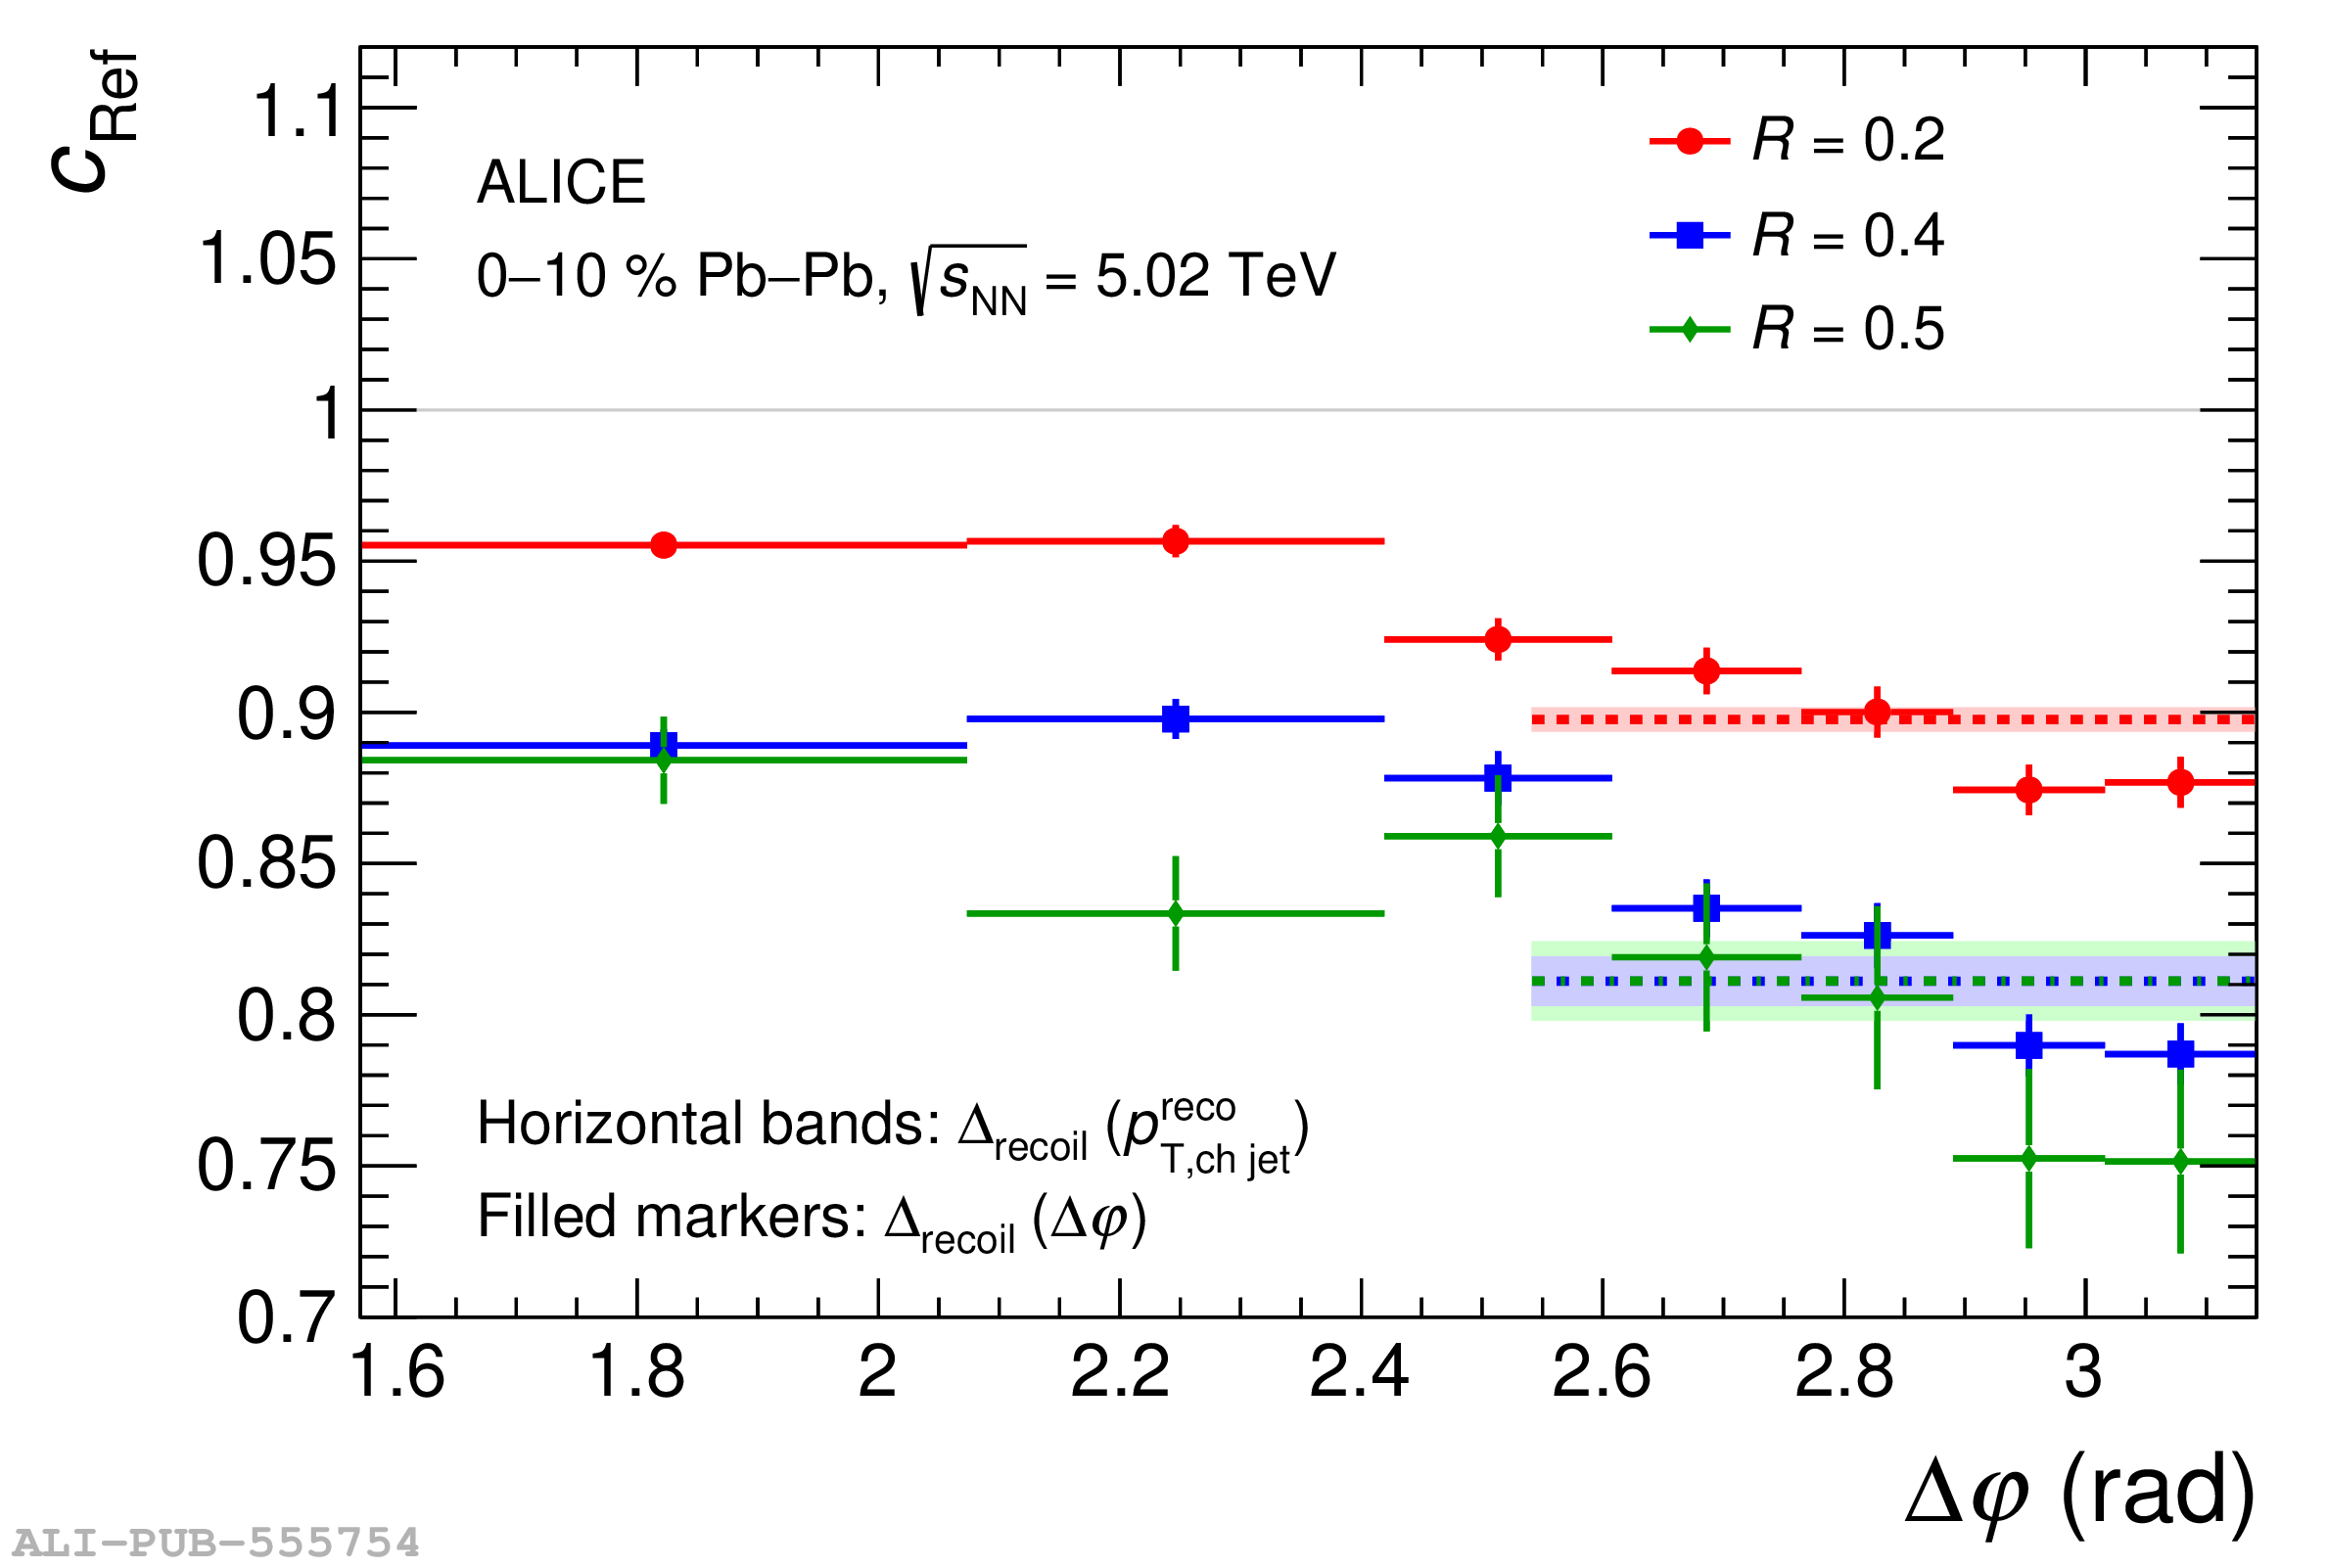 |