$\rho$ distributions for central \PbPb\ collisions at $\sqrtsNN=5.02$ TeV. Upper panel: \TTSig\ and \TTRef\ distributions, and the \TTRef\ distribution shifted by $\drho=1.7$ \gev\ (Sec. \ref{sect:rhoaligngment}). Lower panel: ratio of \TTRef\ and shifted \TTRef\ to \TTSig\ distribution. The mean ($\mu$) and RMS of the distributions are given in the legend. The vertical lines on the data points are the statistical uncertainties, and the shaded band on the ratio of the \TTSig\ over the shifted \TTRef\ distributions represents the systematic uncertainty of the procedure. | 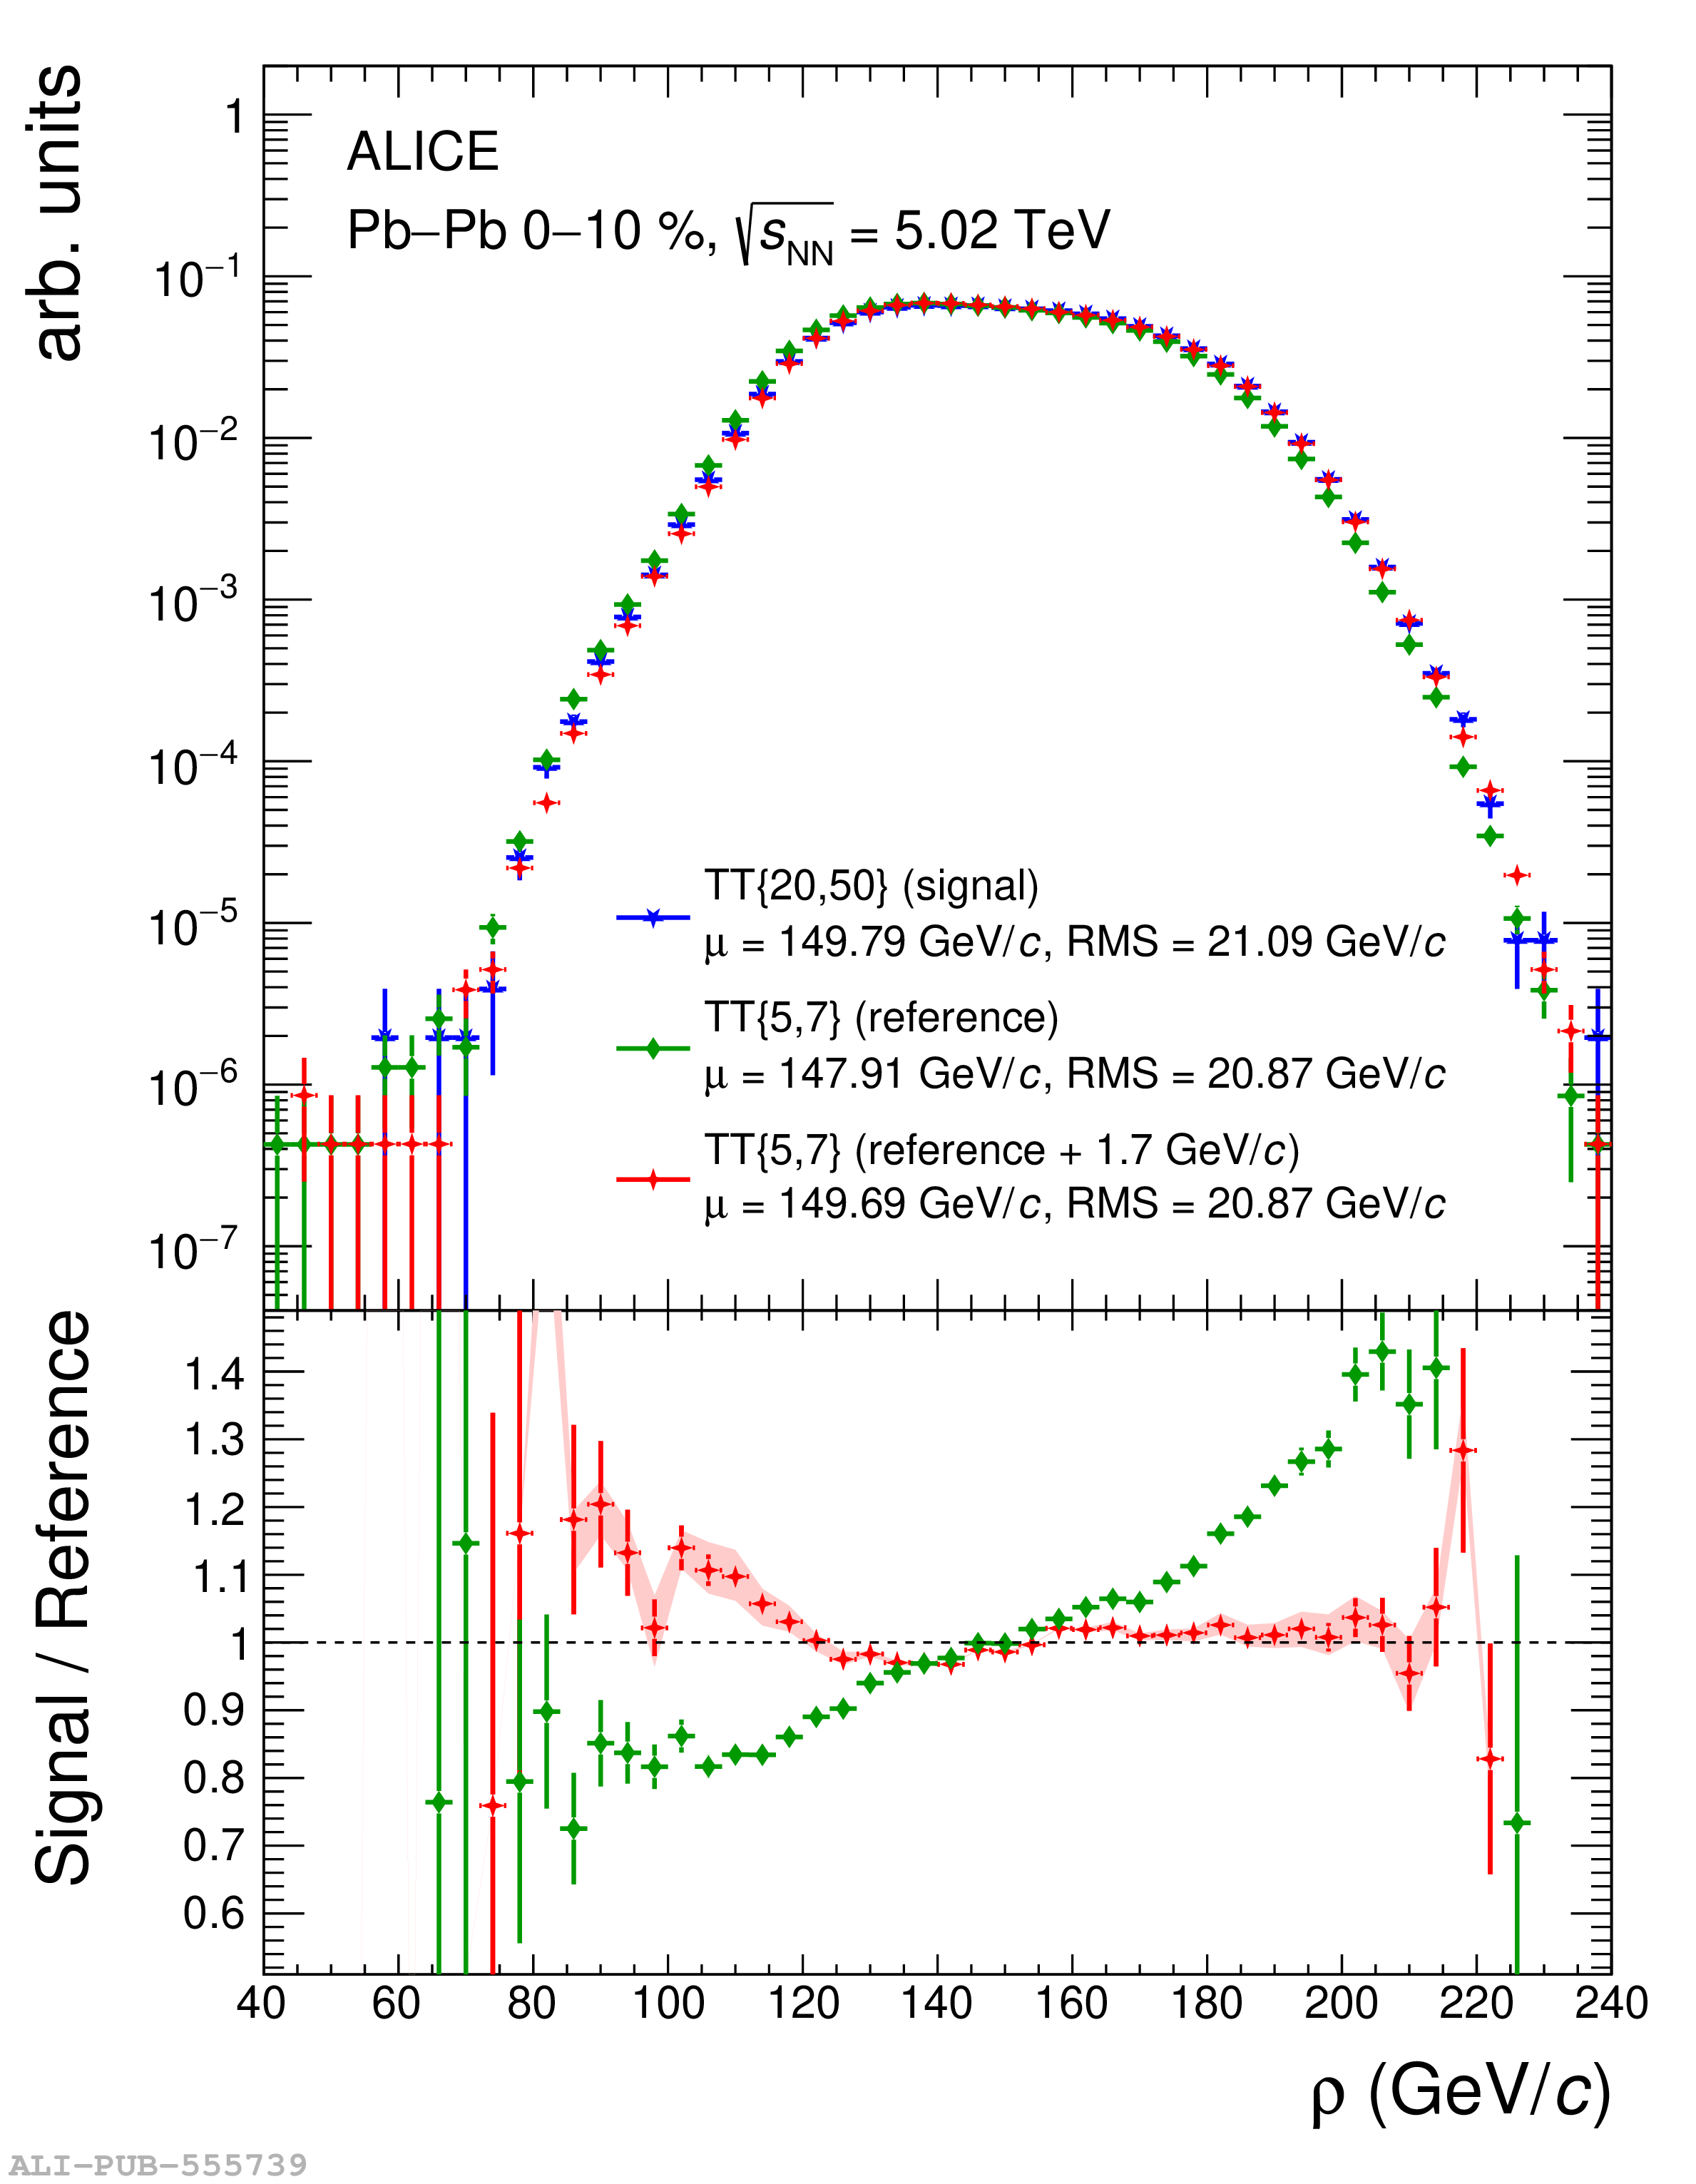 |