The measurement of $Σ^{+}$ production in pp collisions at $\sqrt{s}=13$ TeV is presented. The measurement is performed at midrapidity in both minimum-bias and high-multiplicity pp collisions at $\sqrt{s}=13$ TeV. The $Σ^{+}$ is reconstructed via its weak-decay topology in the decay channel $Σ^{+} \rightarrow \rm{p} + π^{0}$ with $π^{0} \rightarrow γ+ γ$. In a novel approach, the neutral pion is reconstructed by combining photons that convert in the detector material with photons measured in the calorimeters. The transverse-momentum ($p_{\rm T}$) distributions of the $Σ^{+}$ and its rapidity densities ${\rm d}N$/${\rm d}y$ in both event classes are reported. The $p_{\rm T}$ spectrum in minimum-bias collisions is compared to QCD-inspired event generators. The ratio of $Σ^{+}$ to previously measured $Λ$ baryons is in good agreement with calculations from the Statistical Hadronization Model. The high efficiency and purity of the novel reconstruction method for $Σ^{+}$ presented here will enable future studies of the interaction of $Σ^{+}$ with protons in the context of femtoscopic measurements, which could be crucial for understanding the equation of state of neutron stars.
Eur. Phys. J. C (2026) 86:101
HEP Data
e-Print: arXiv:2508.20808 | PDF | inSPIRE
CERN-EP-2025-181
Figure group
Figure 1
Invariant-mass distributions of $\Sigma^{+}$+$\overline{\Sigma}^{-}$ candidates in high-multiplicity (upper panels) and minimum-bias (lower panels) pp collisions at $\sqrt{s}=13$ TeV in 2.0 < $ p_{\rm T} $< 2.5 $\rm GeV/\it{c}$ (left panels) and in 5.5 < $ p_{\rm T}\ $< 6.0 $\rm GeV/\it{c}$ (right panels) in same events (black symbols), mixed events (red symbols) and signal (blue symbols). The error bars of the data points correspond to the statistical uncertainties. | 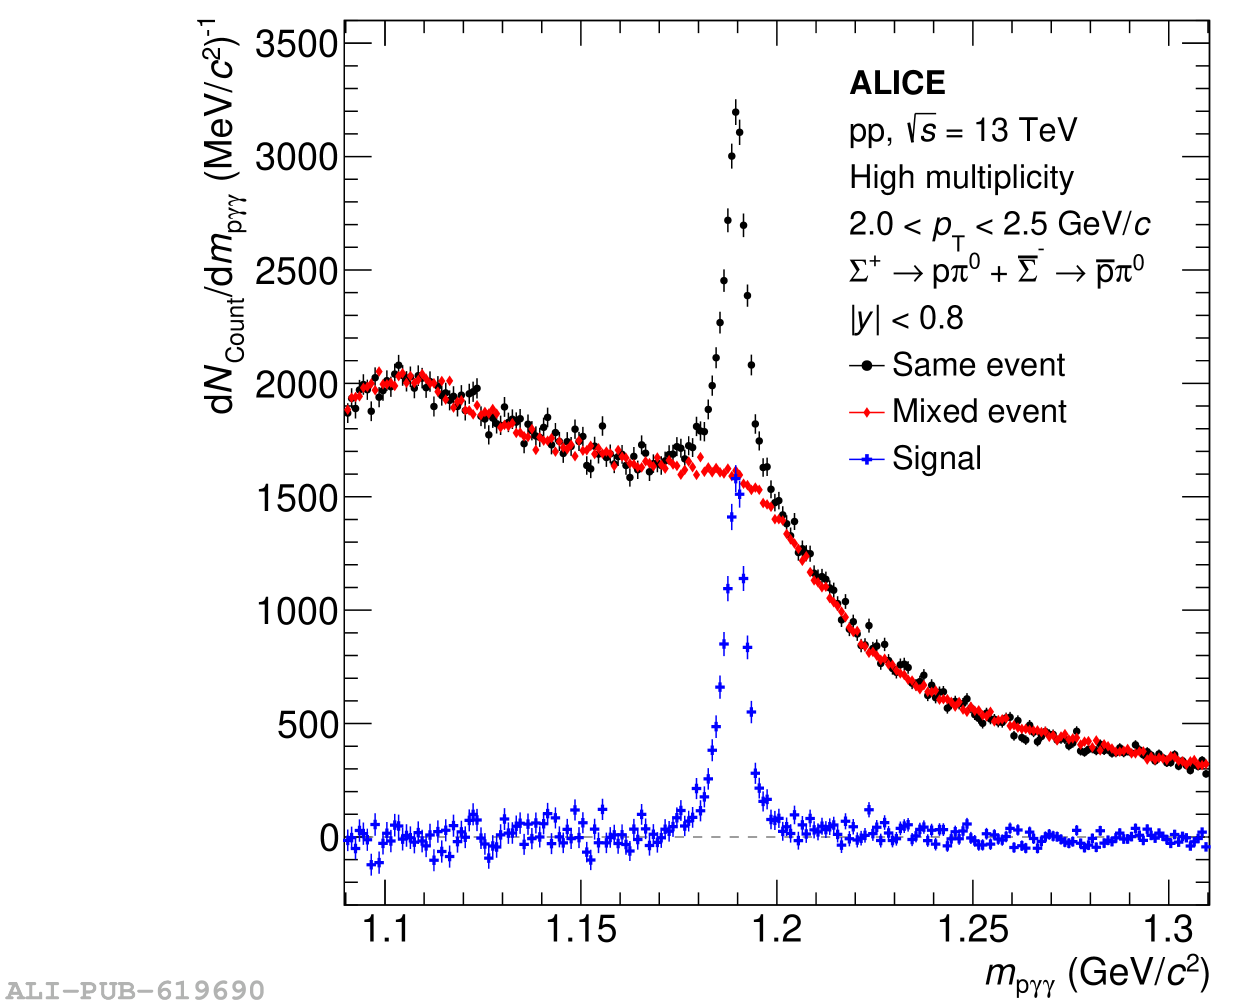 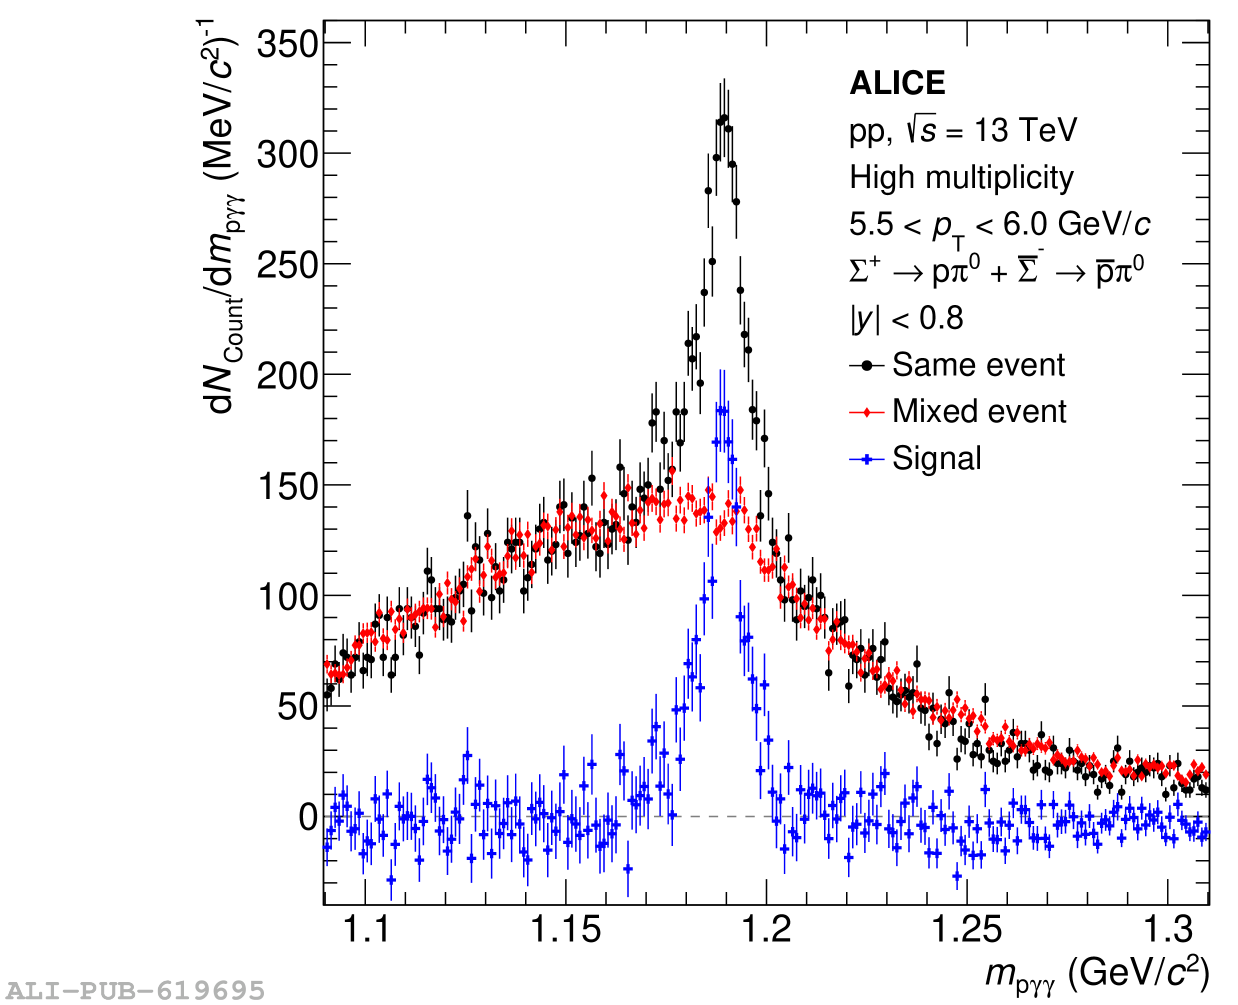 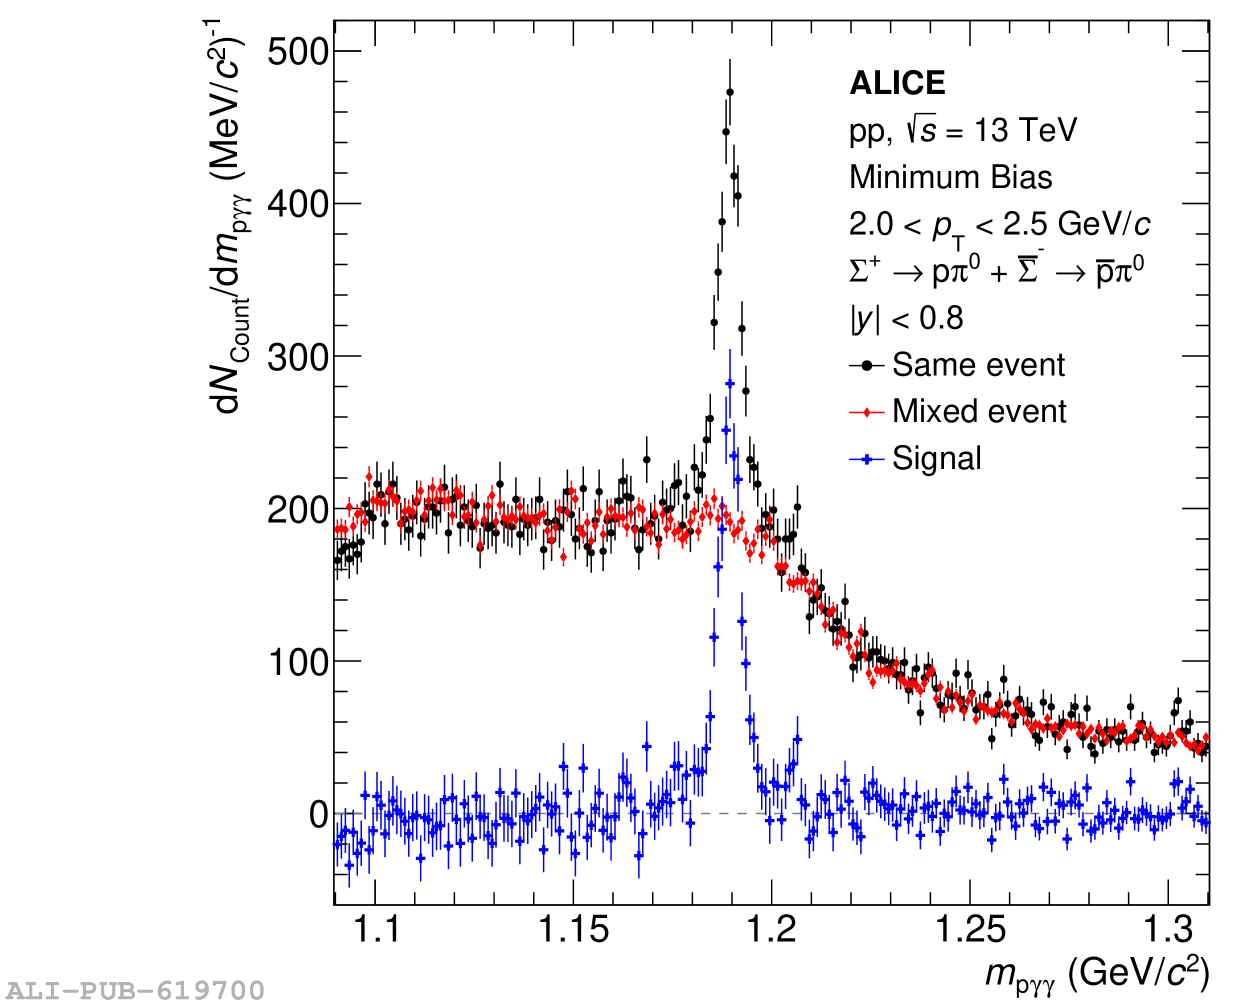  |
Figure 2
Acceptance $\times$ efficiency as a function of the transverse momentum of $\Sigma^{+}$ and $\overline{\Sigma}^{-}$ after applying the selection criteria described in the text. The results for $\Sigma^{+}$ (red symbols) and $\overline{\Sigma}^{-}$ (blue symbols) are shown. The error bars of the data points correspond to the statistical uncertainties. |  |
Figure 3
Normalized differential yields of $\Sigma^{+}$+$\overline{\Sigma}^{-}$ as a function of $p_{\rm T}$ in high-multiplicity (red symbols) and minimum-bias (blue symbols) pp events at $\sqrt{s}=13$ TeV together with the corresponding L$\acute{\textrm{e}}$vy-Tsallis fits (dashed lines). The spectra are normalized to the number of events ($N_{\textrm{Event}}$) given in Section 2. The statistical uncertainties of the data points are shown as bars and the systematic ones as boxes. | 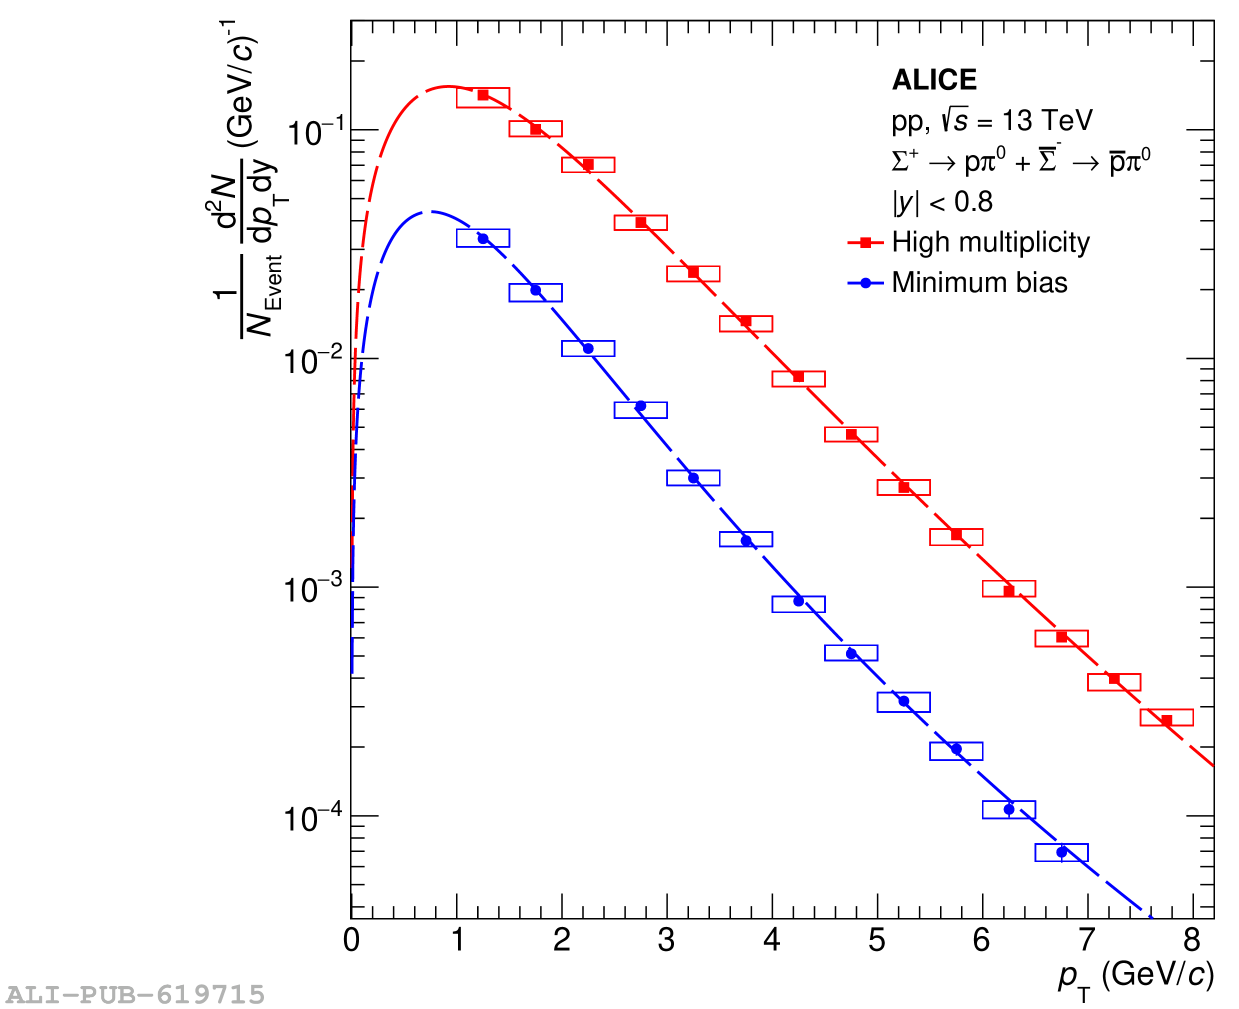 |
Figure 4
The normalized differential yield of $\Sigma^{+}$+$\overline{\Sigma}^{-}$ as a function of $p_{\rm T}$ in minimum-bias pp collisions at $\sqrt{s}=13$ TeV (blue symbols) compared with PYTHIA 6 (green line), PYTHIA 8 (purple line), EPOS LHC (red line) and EPOS4 (orange line) generators. The lower panel shows the ratio between the data points and the MC predictions. The statistical uncertainties of the data points are shown as bars and the systematic ones as boxes. The statistical uncertainties of the model predictions are given by the width of the bands. |  |
Figure 5
Ratio of the $p_{\rm T}$ spectra of $\Sigma^{+}$+$\overline{\Sigma}^{-}$ in minimum-bias and high-multiplicity pp collisions. For comparison, the same ratio is shown for $\Lambda$+$\overline\Lambda$ baryons, taken from a previous analysis. One must note the slightly different multiplicities. |  |