The charged-particle number (left) and summed-$p_{\rm T}$ (right) densities as a function of $p_{\rm T}^{\rm trig}$ in pp collision at $\sqrt{s}=5.02$ TeV are displayed. Results for the transverse (top), away (middle), and toward (bottom) regions were obtained for the transverse momentum threshold $\pt>0.15$ GeV/$c$. The shaded area and the error bars around the data points represent the systematic and statistical uncertainties, respectively. Data are compared with PYTHIA 8/Monash (solid line) and EPOS LHC (dashed line) predictions. The data-to-model ratios are displayed in the bottom panel of each plot. The boxes around unity represent the statistical and systematic uncertainties added in quadrature. | 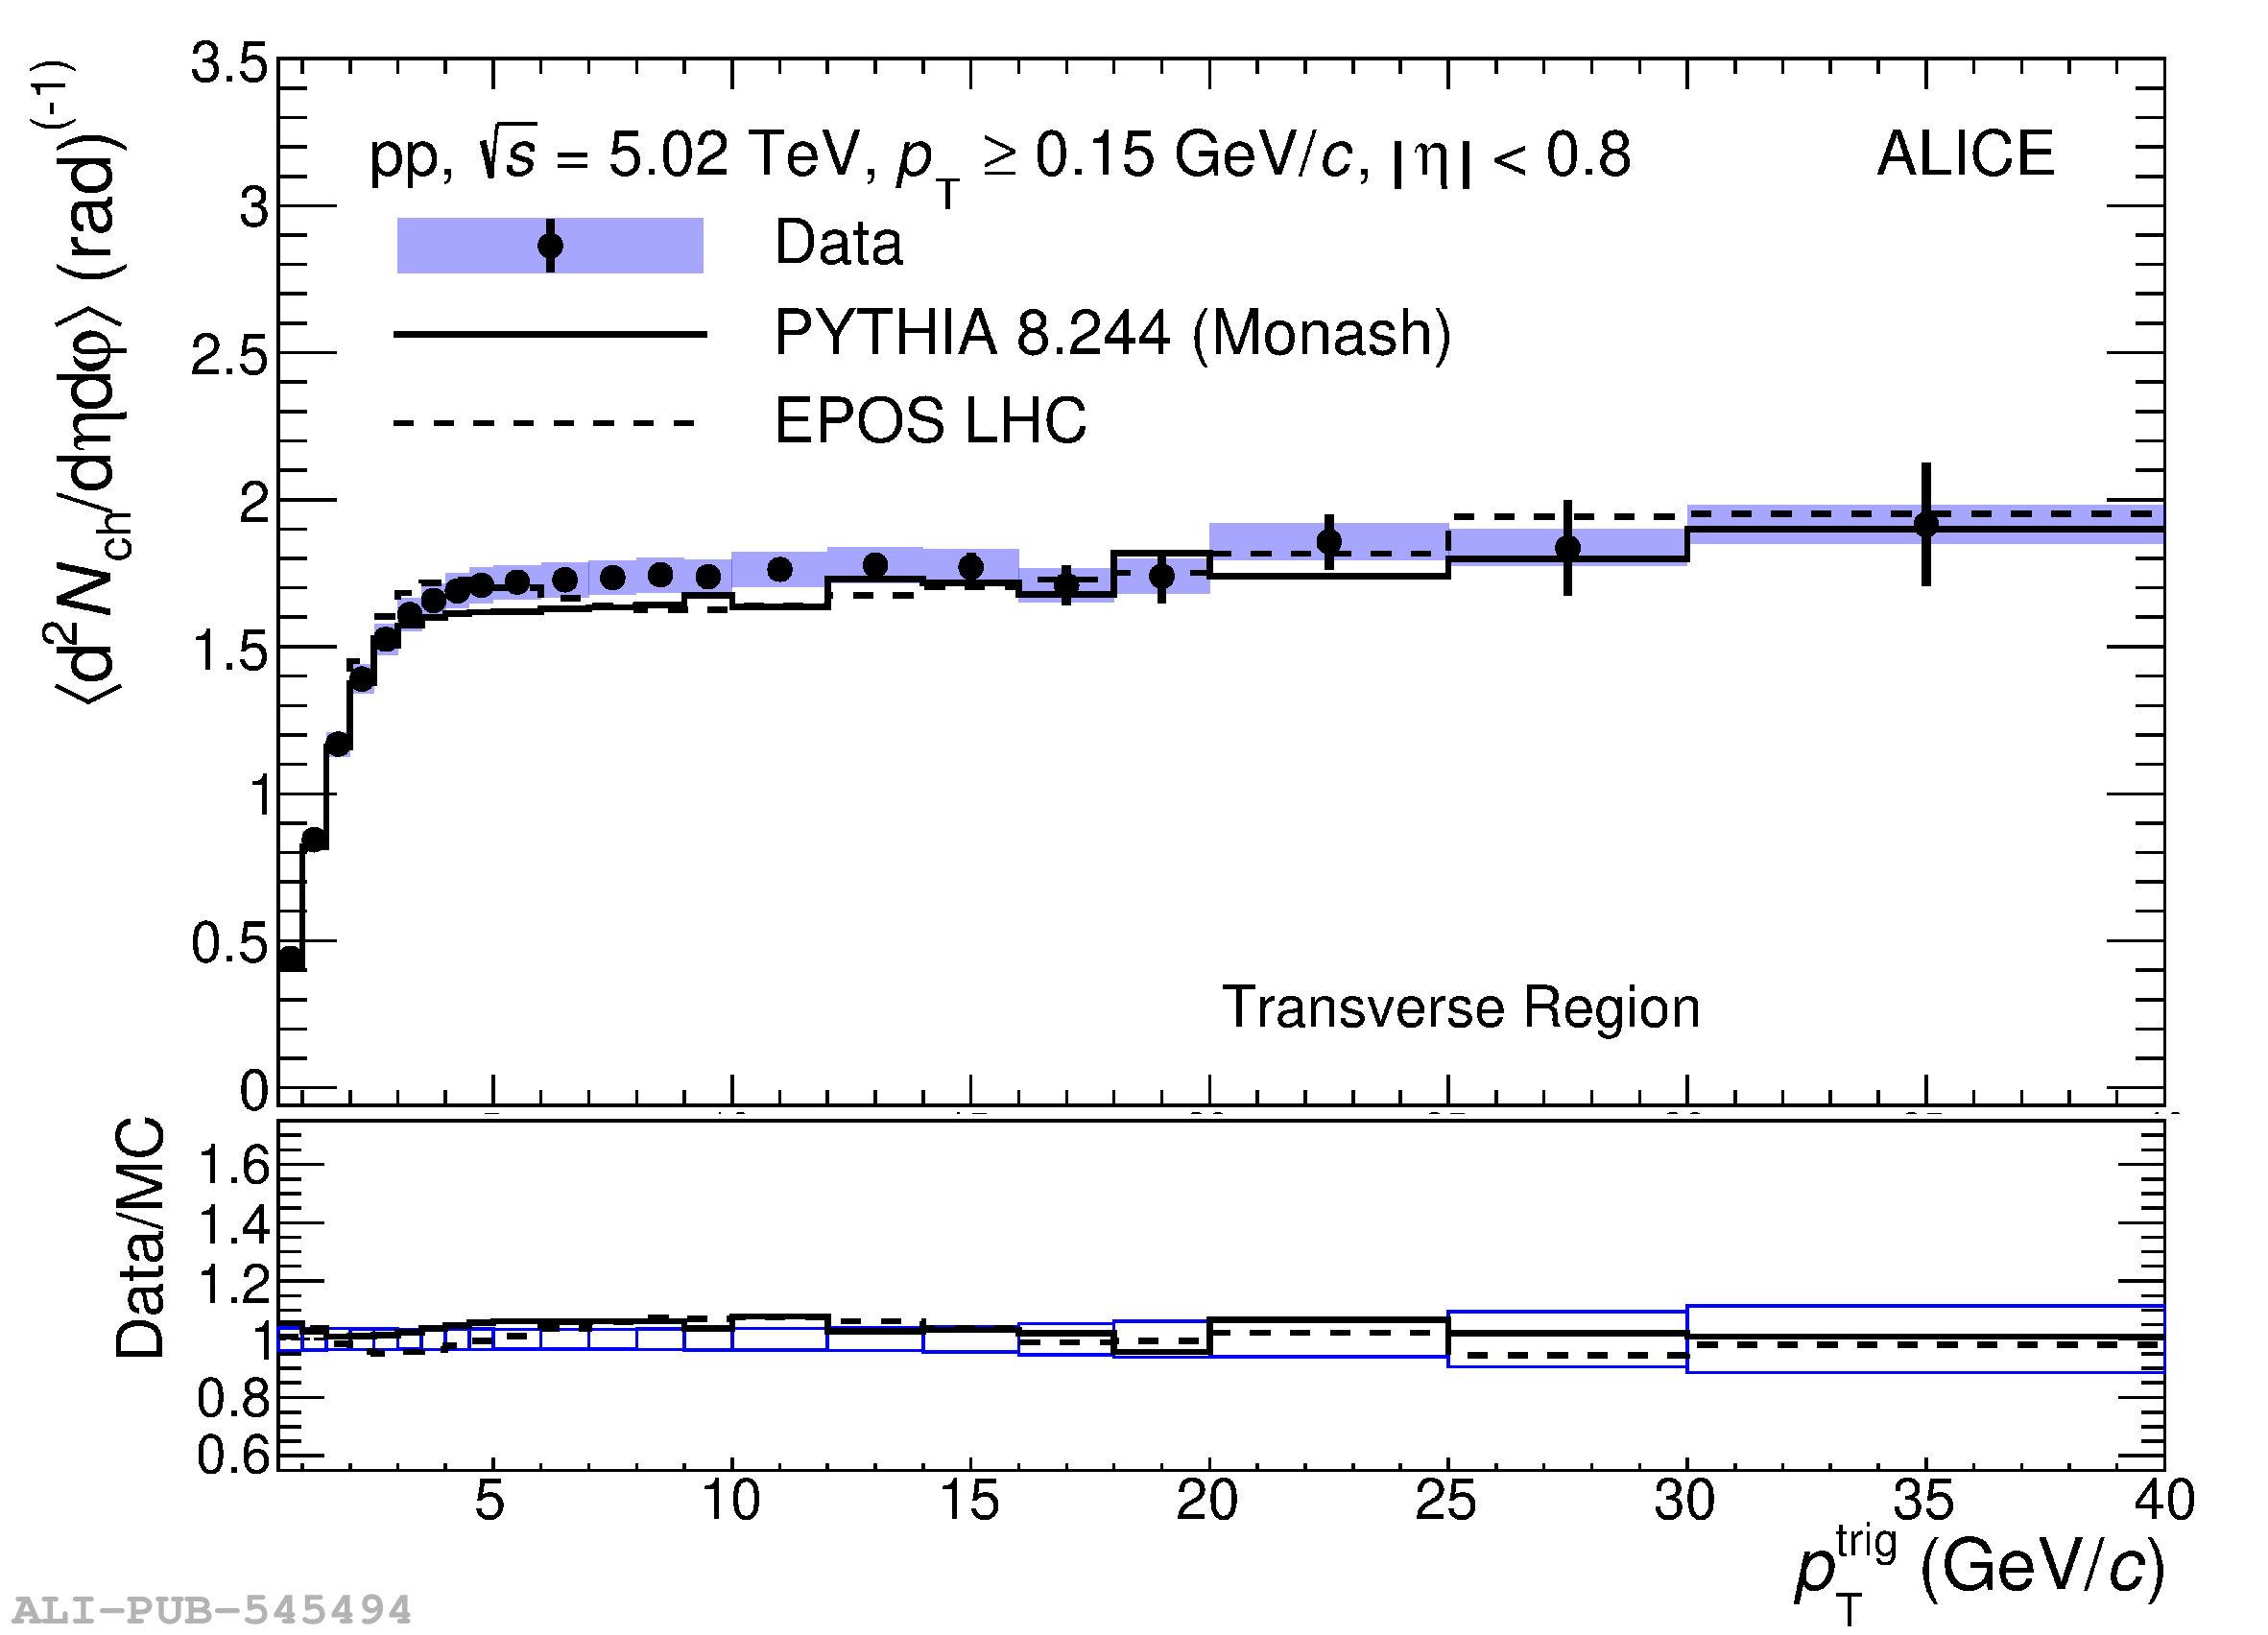 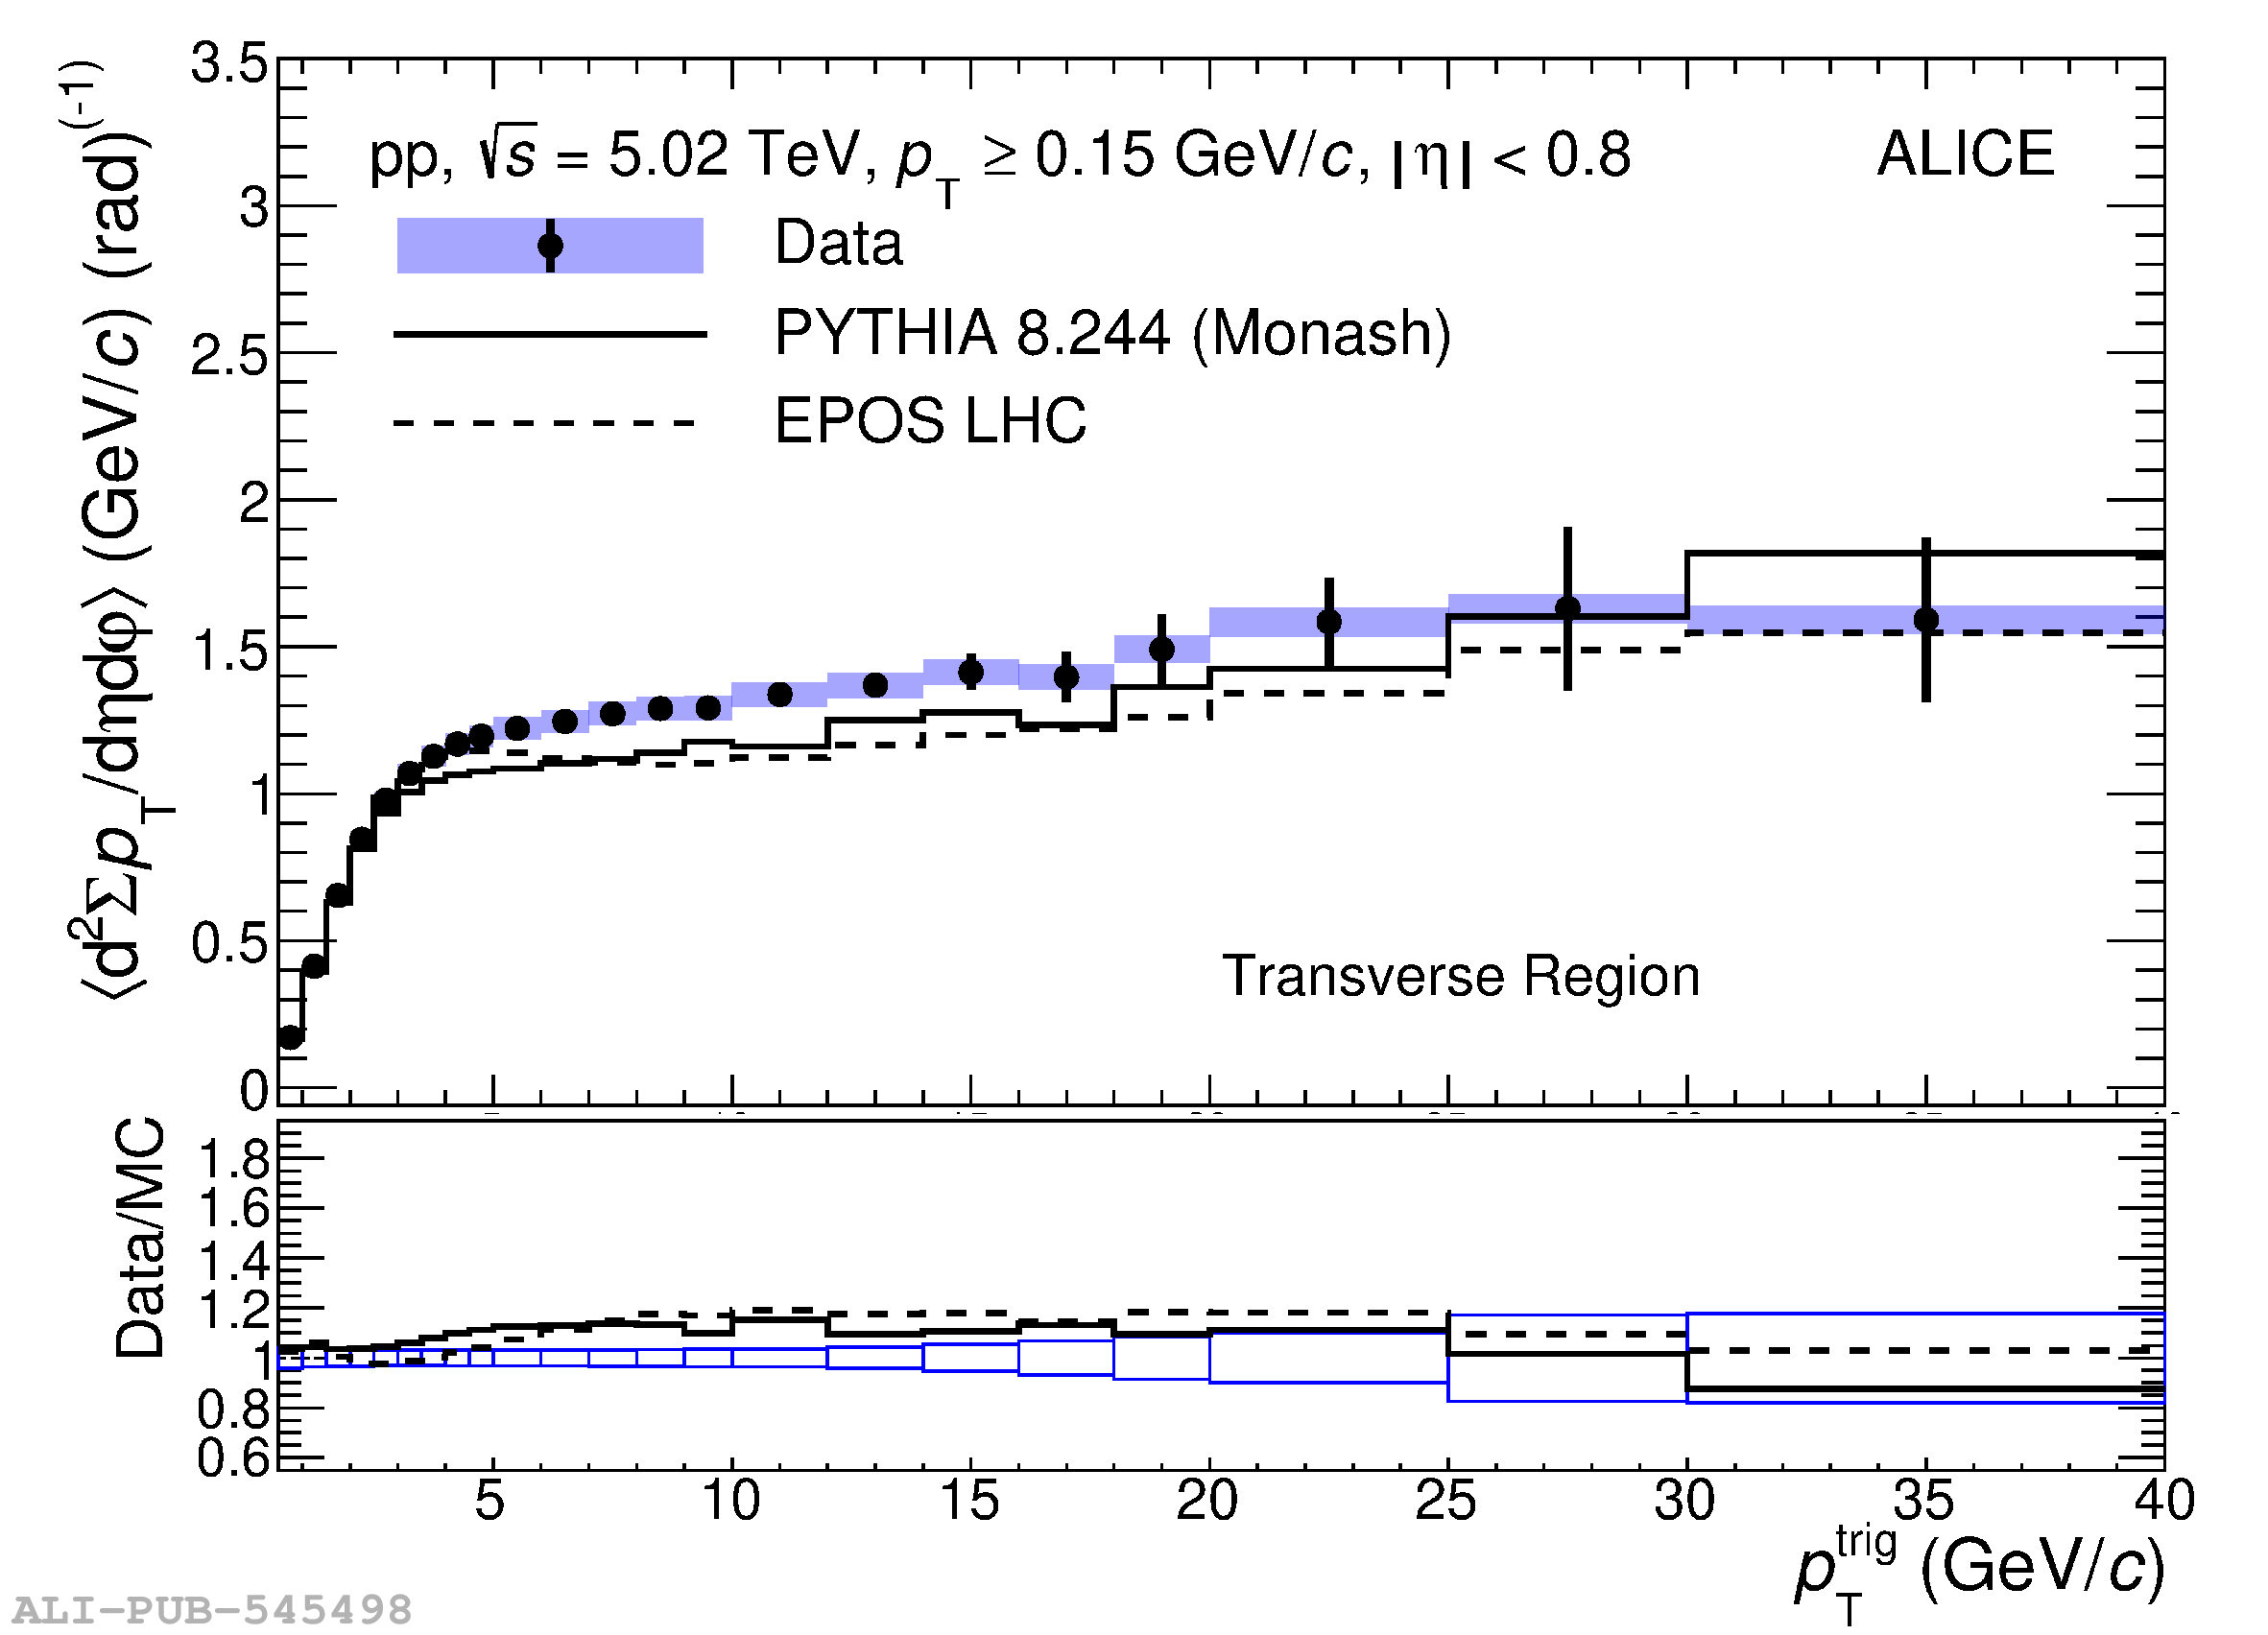 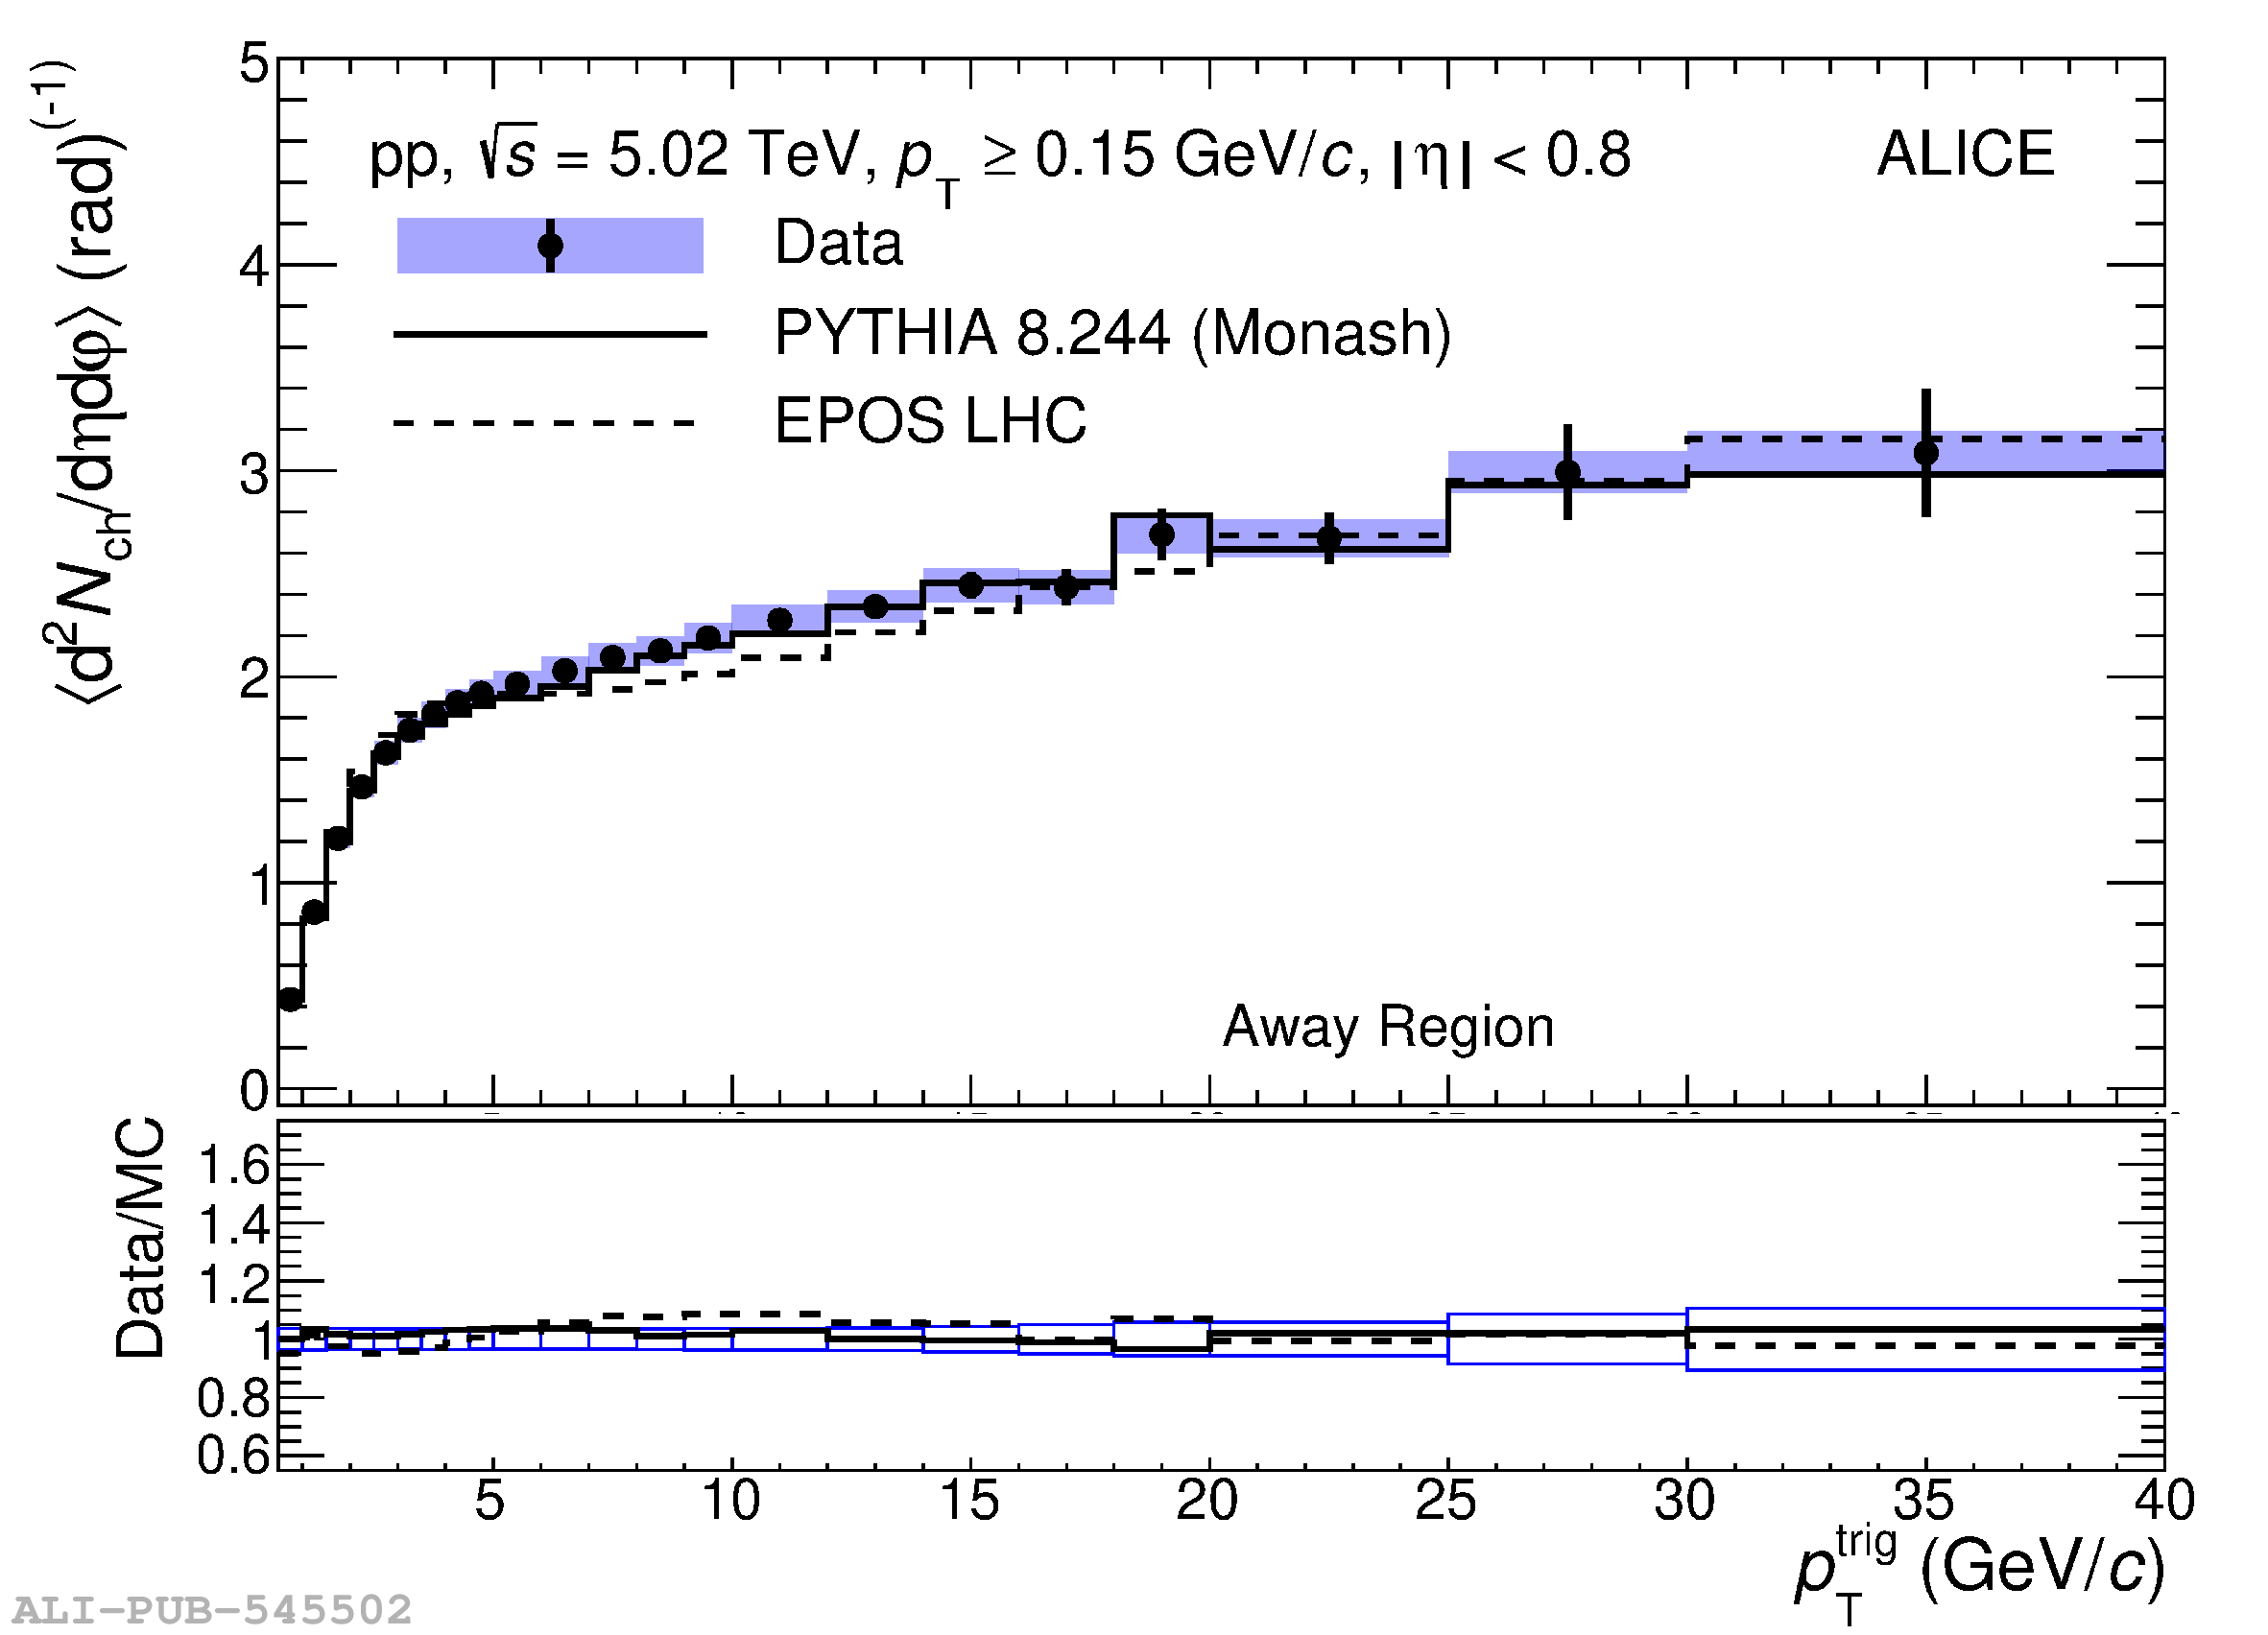 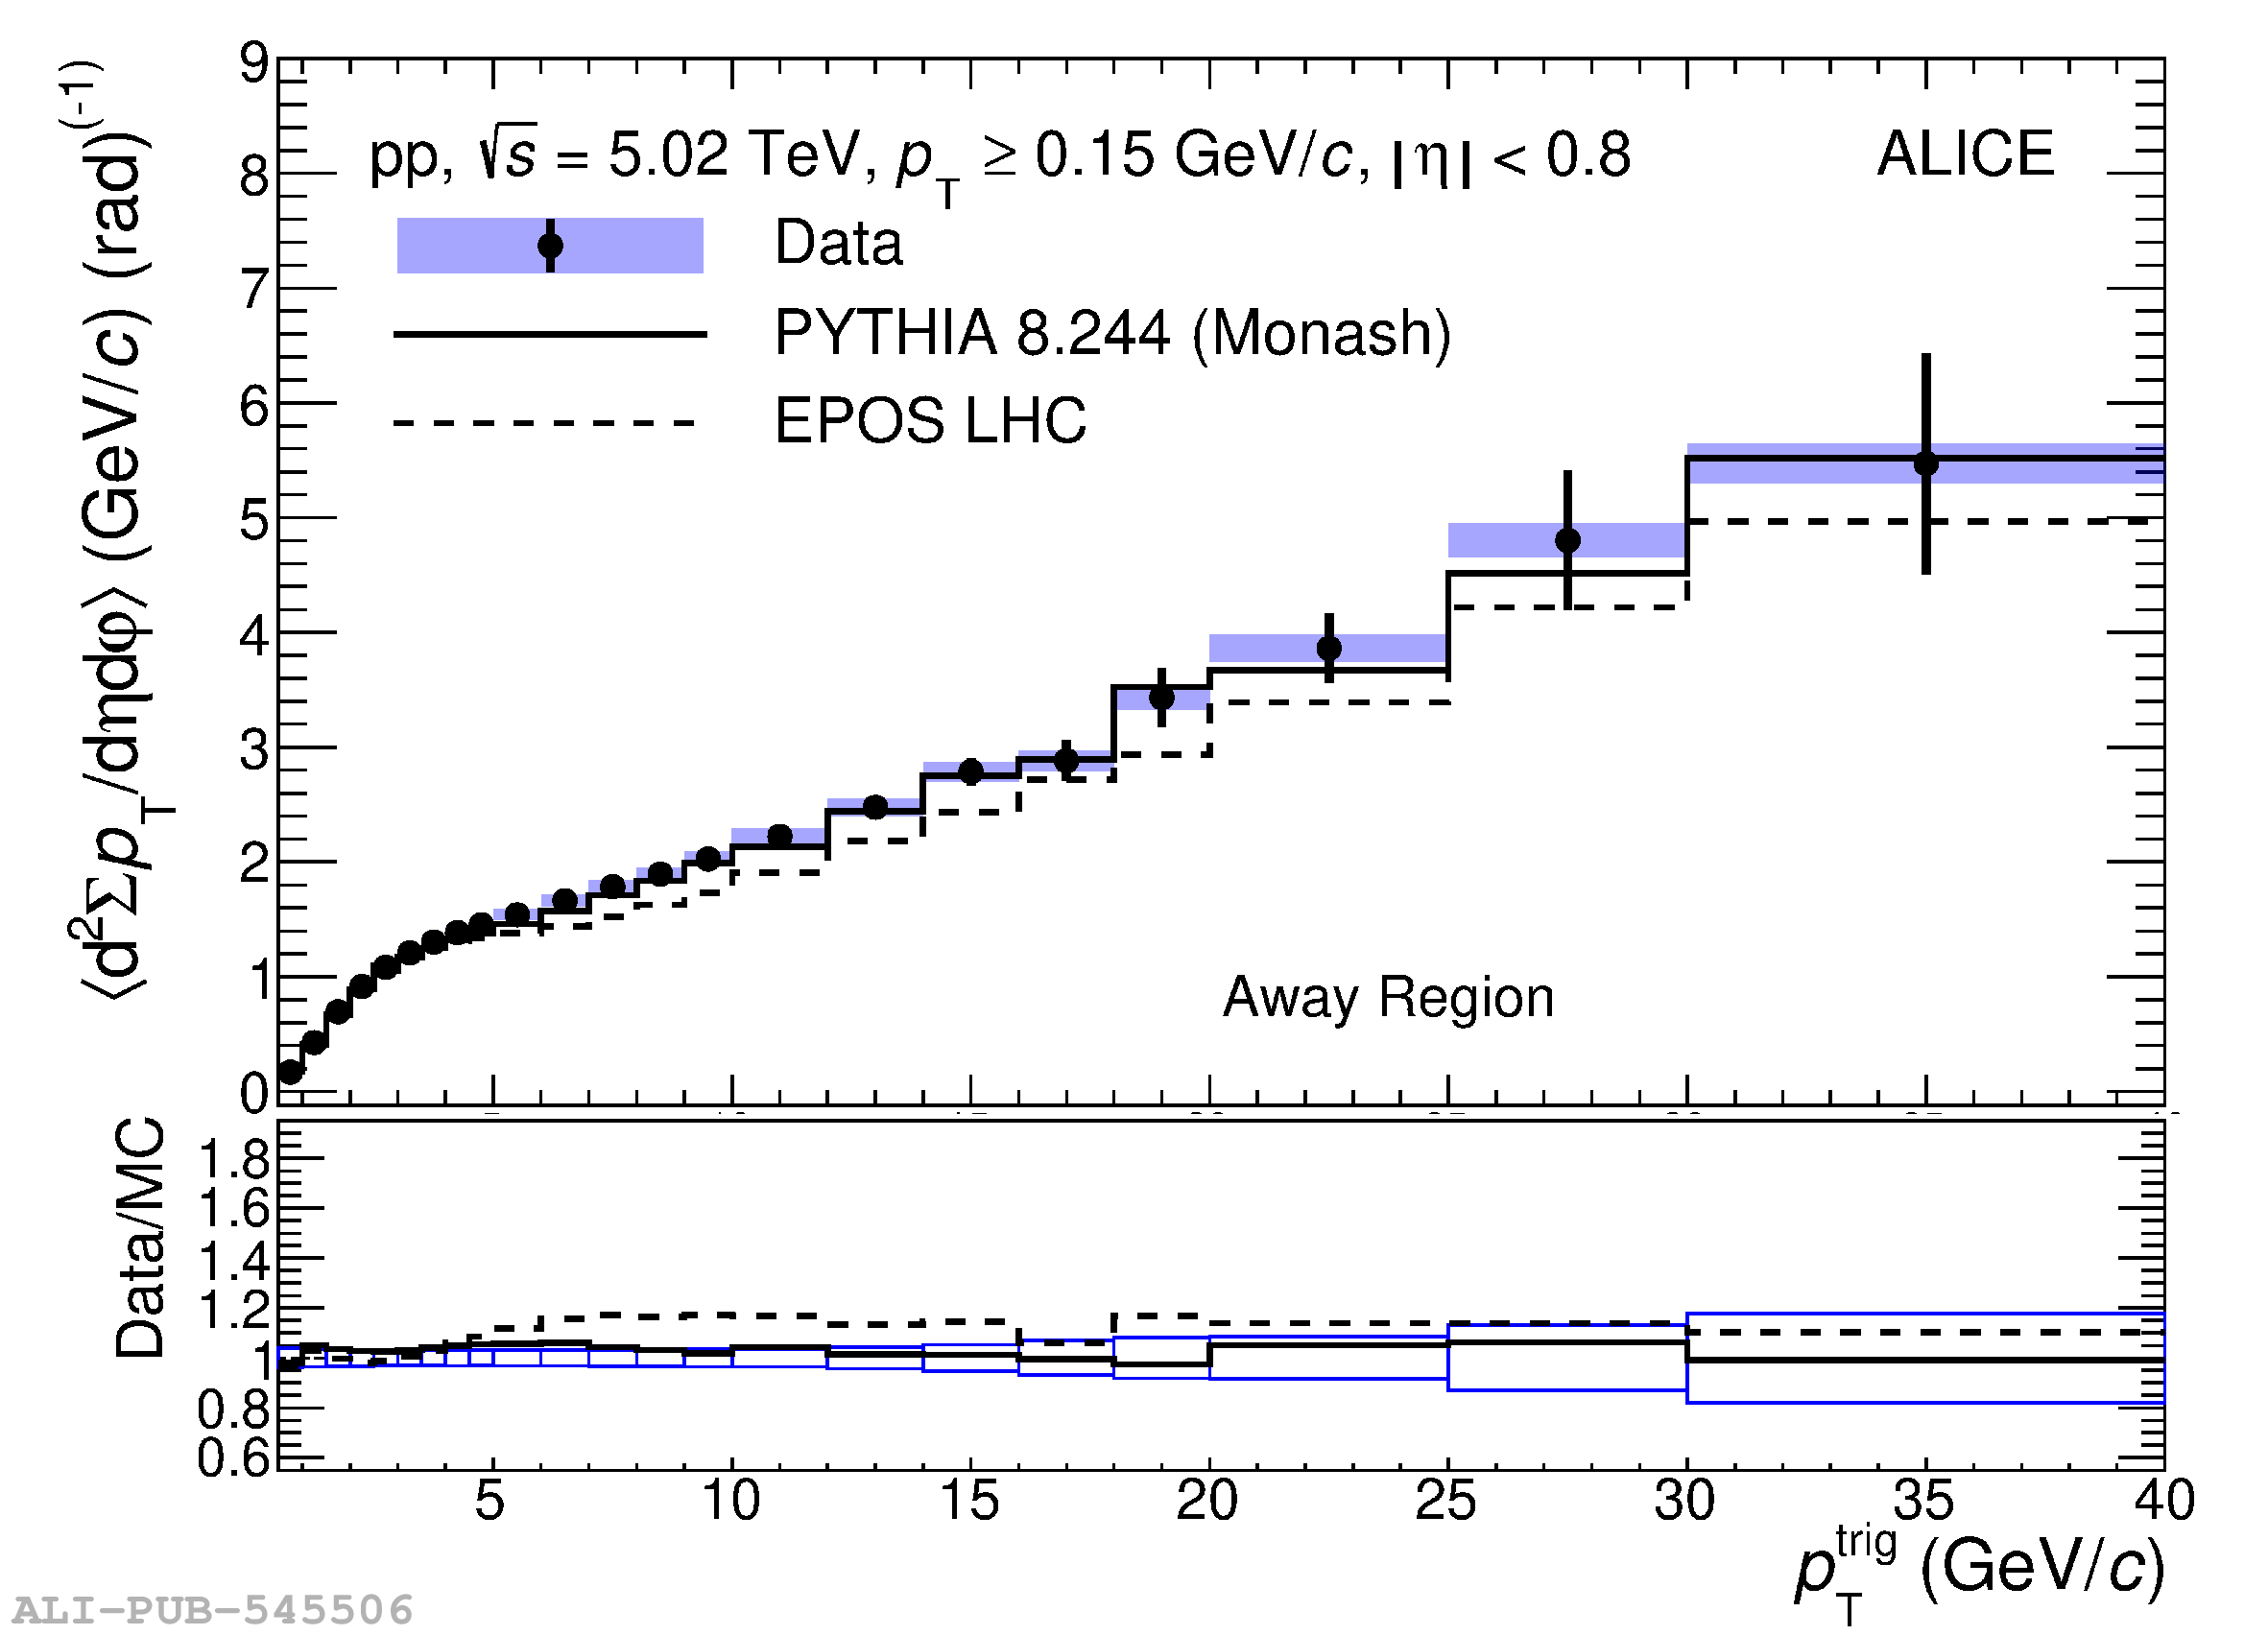 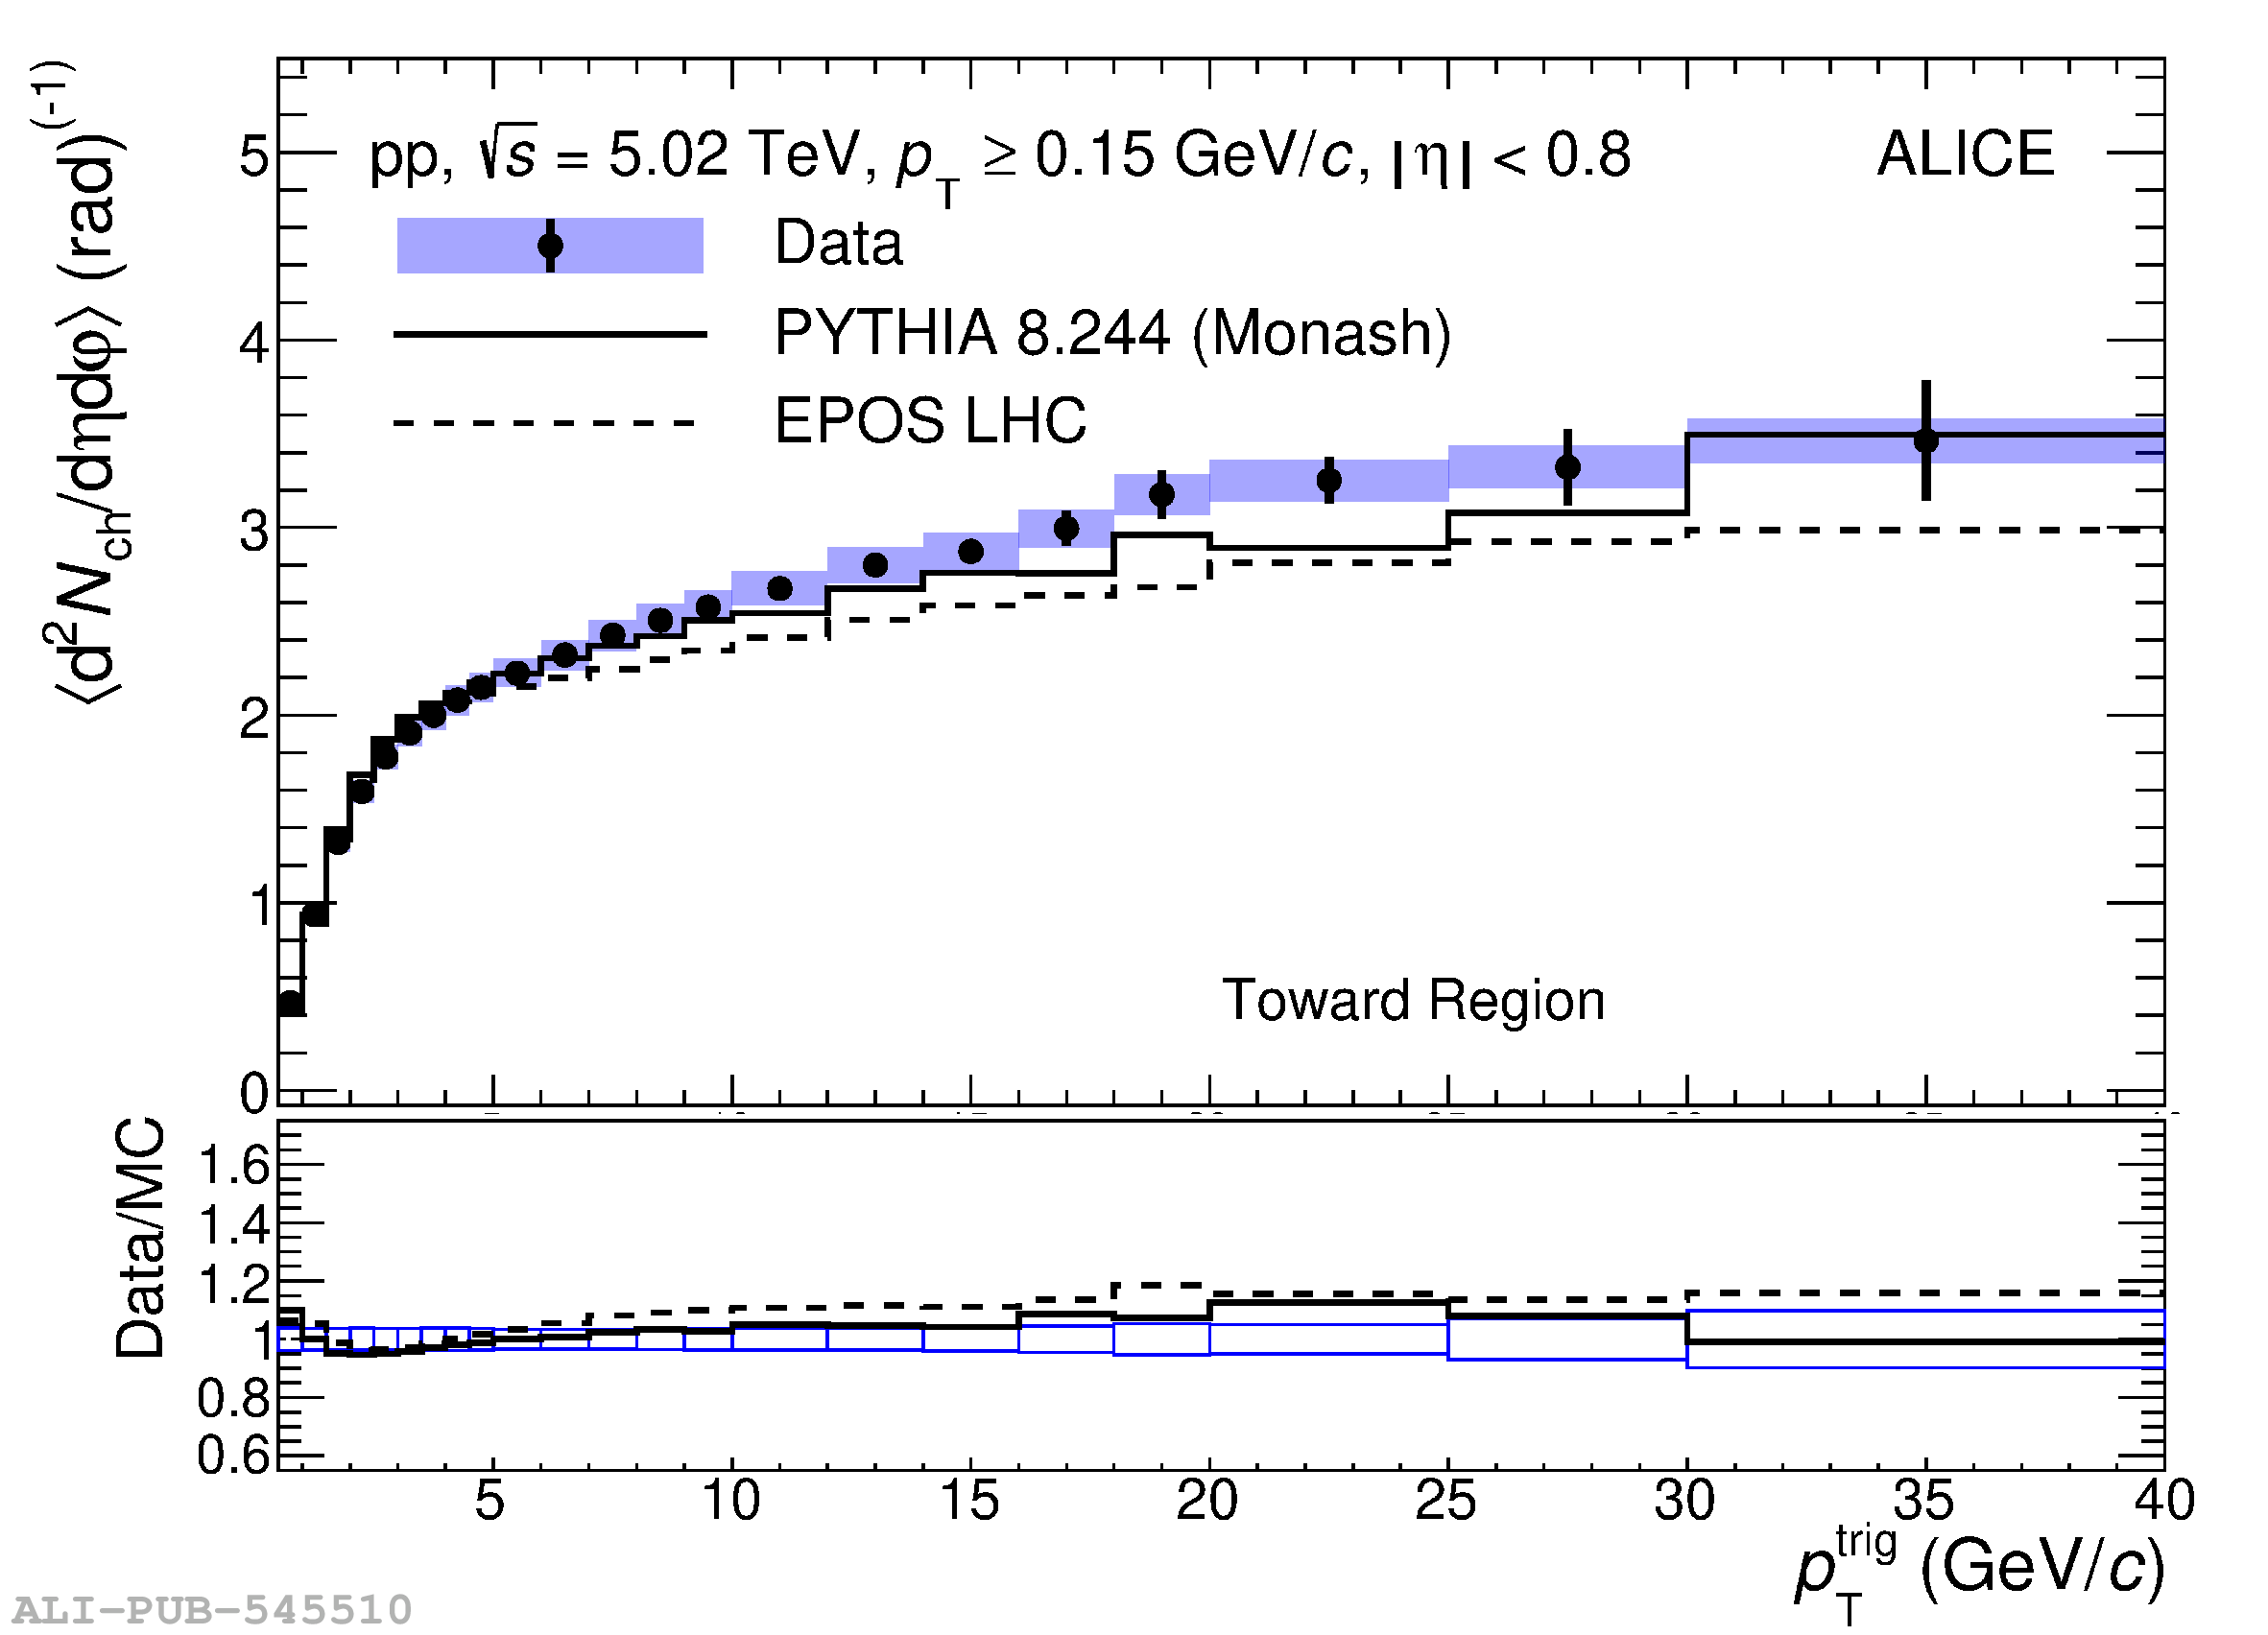 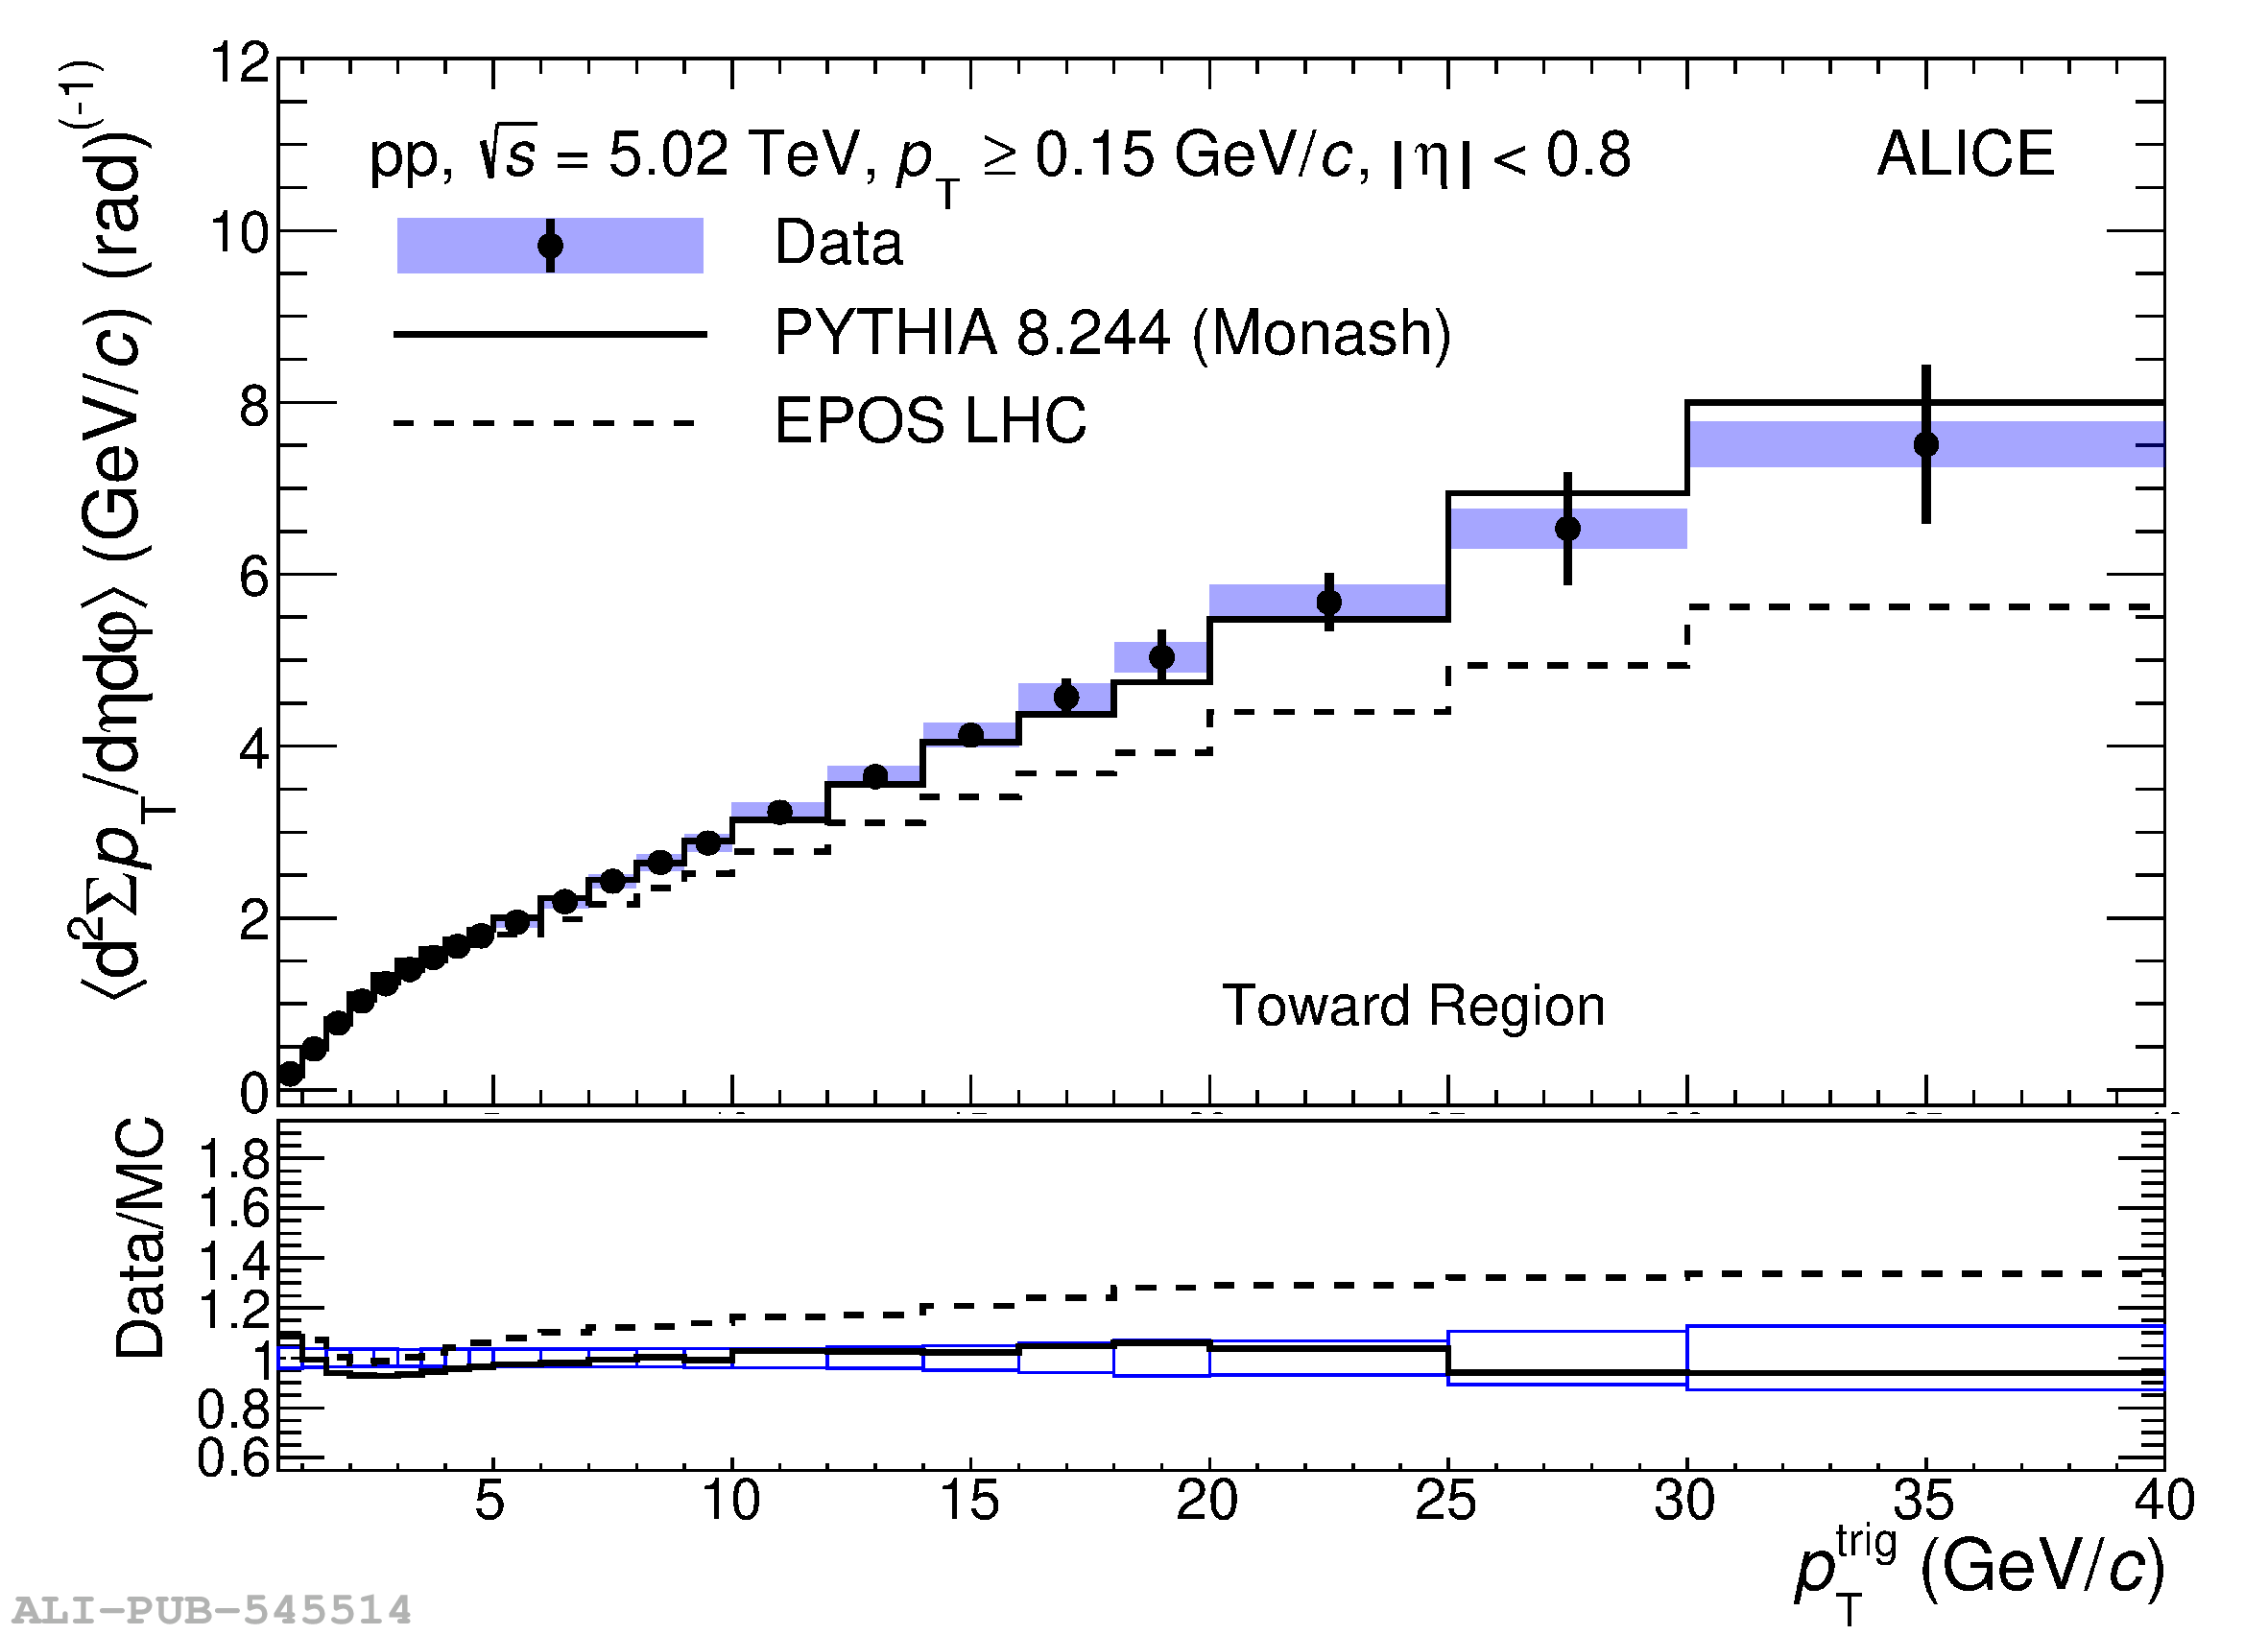 |