Left: charged-particle number density in the transverse region as a function of $p_{\rm T}^{\rm trig}$ for pp collisions at $\sqrt{s}$ = 0.9, 5.02, 7, and 13TeV. A constant function (solid lines) is used to fit the data in the range $5 < p_{\rm T}^{\rm trig} < 10$ GeV/$c$. Right: number densities scaled by the plateau values obtained from the fit to compare the shapes. The coloured boxes represent the systematic uncertainties, and vertical error bars indicate statistical uncertainties. | 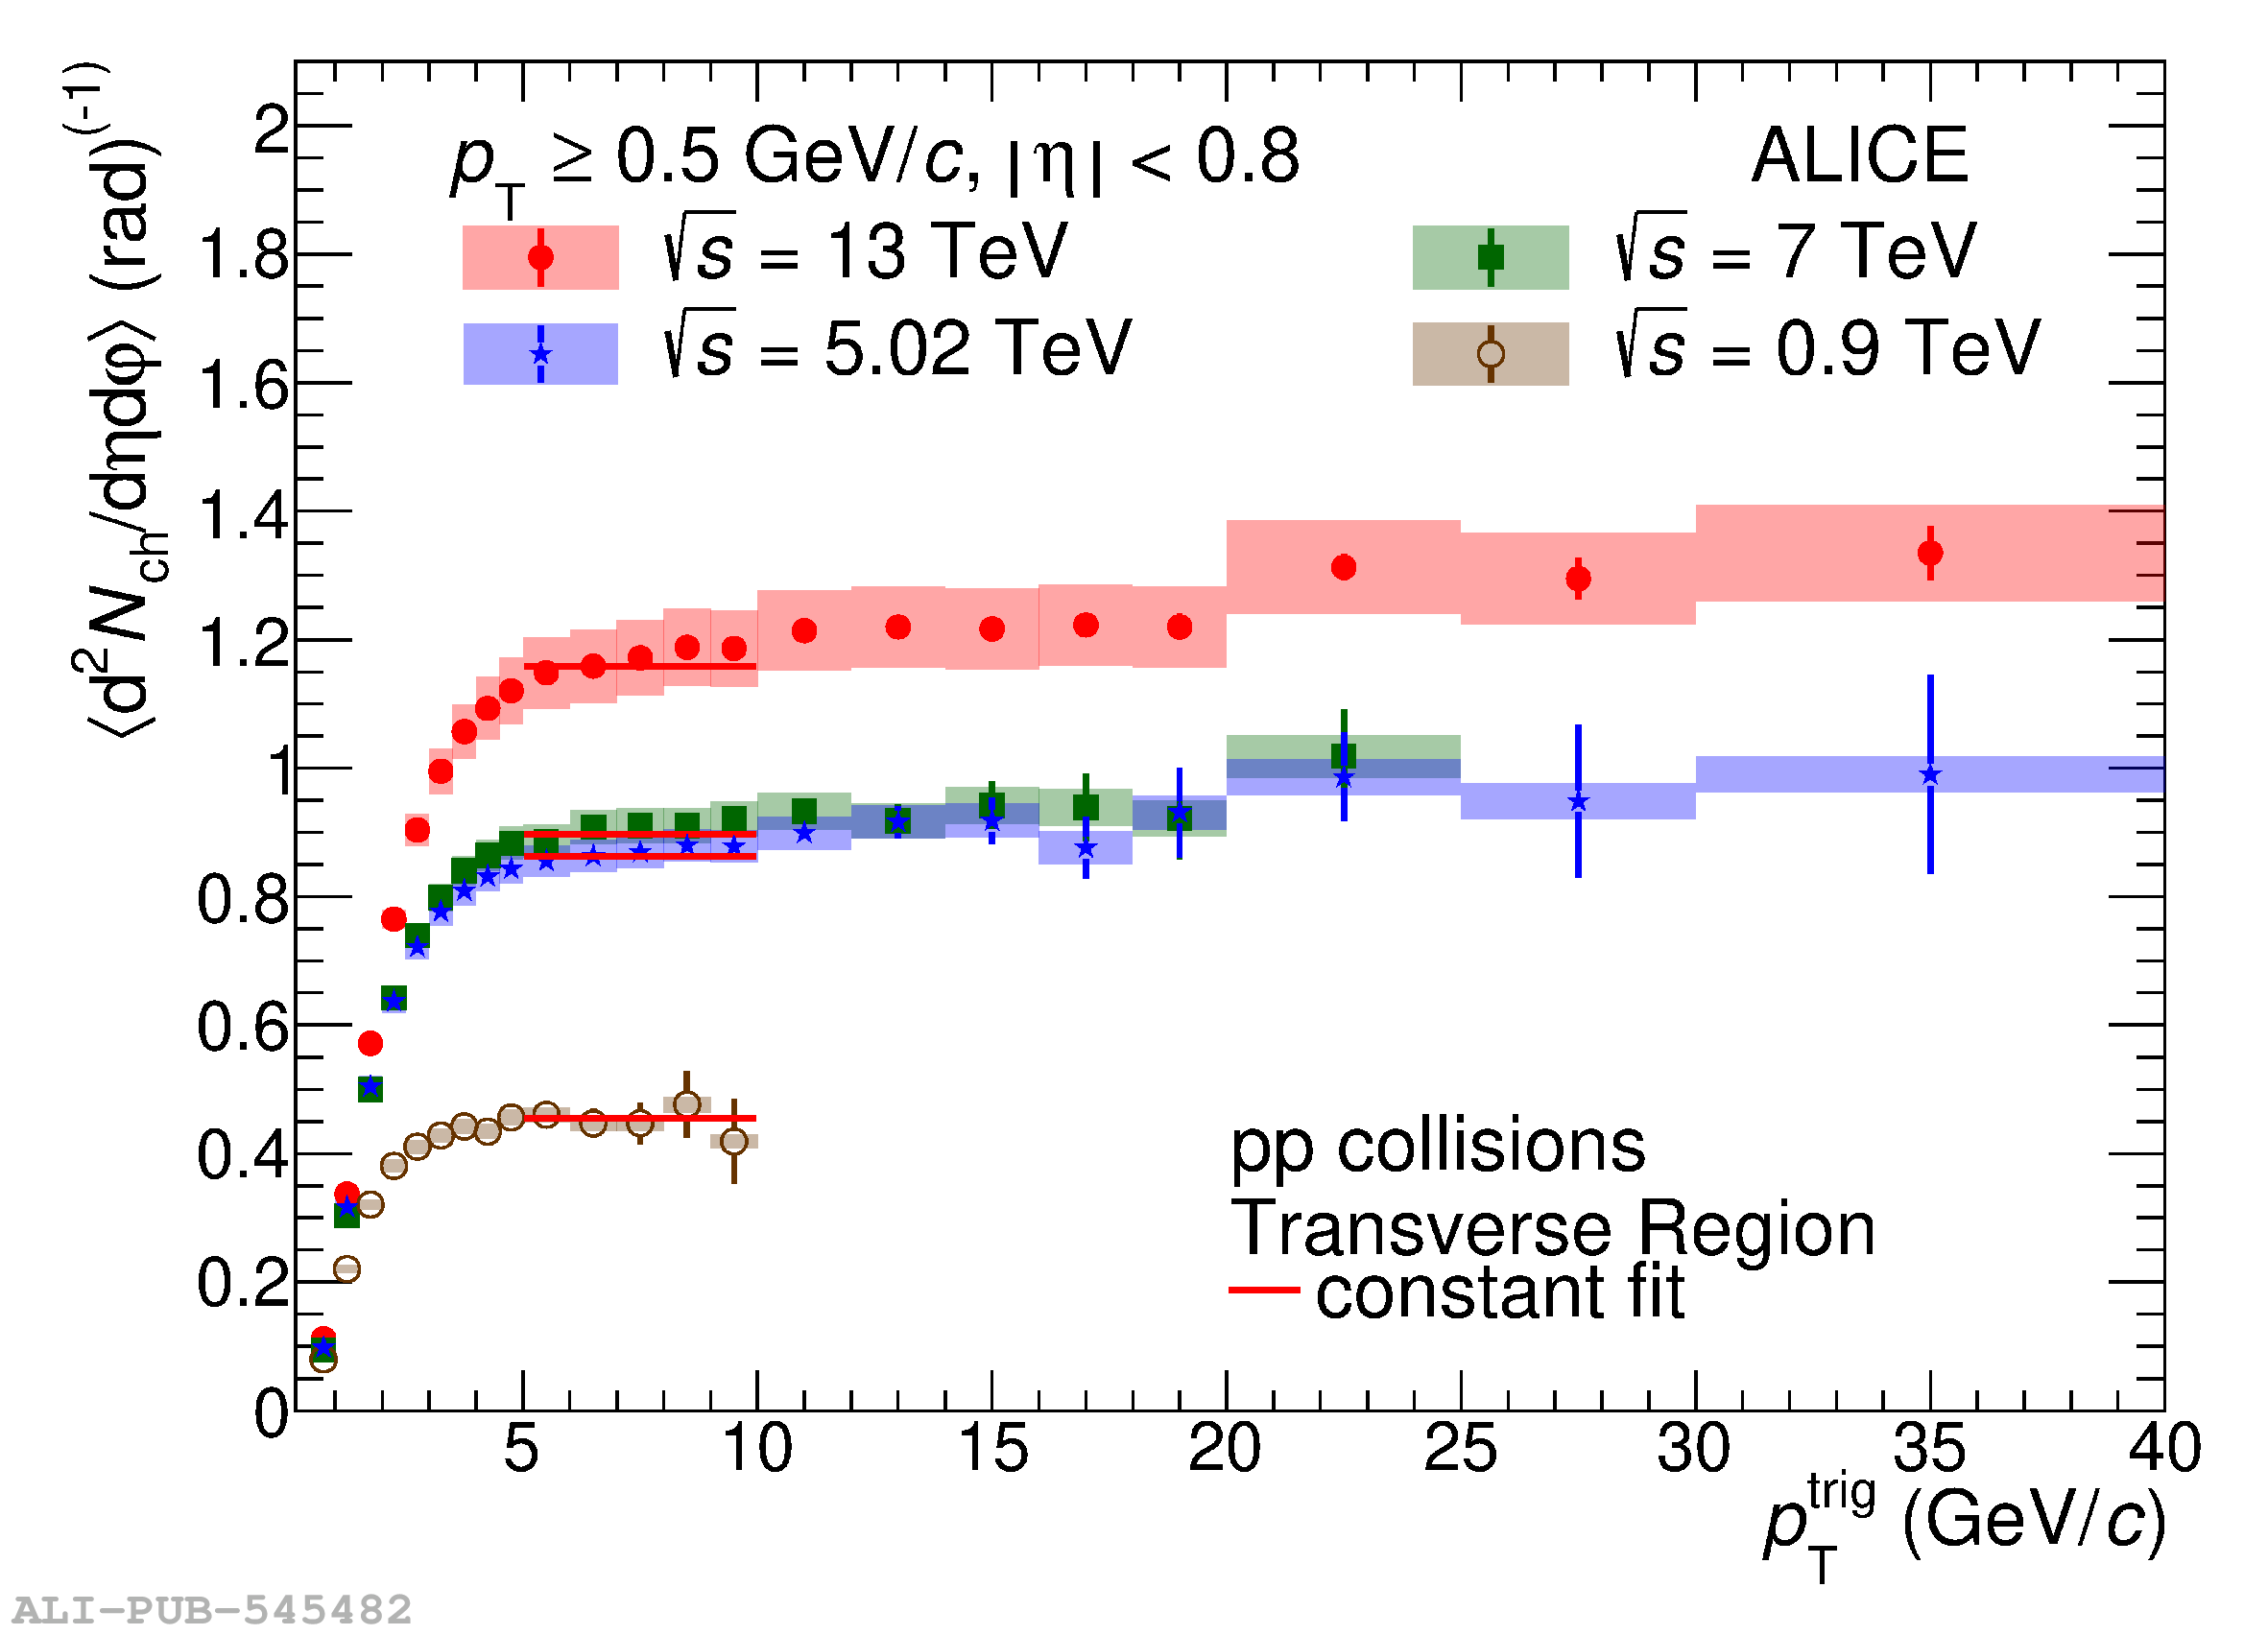 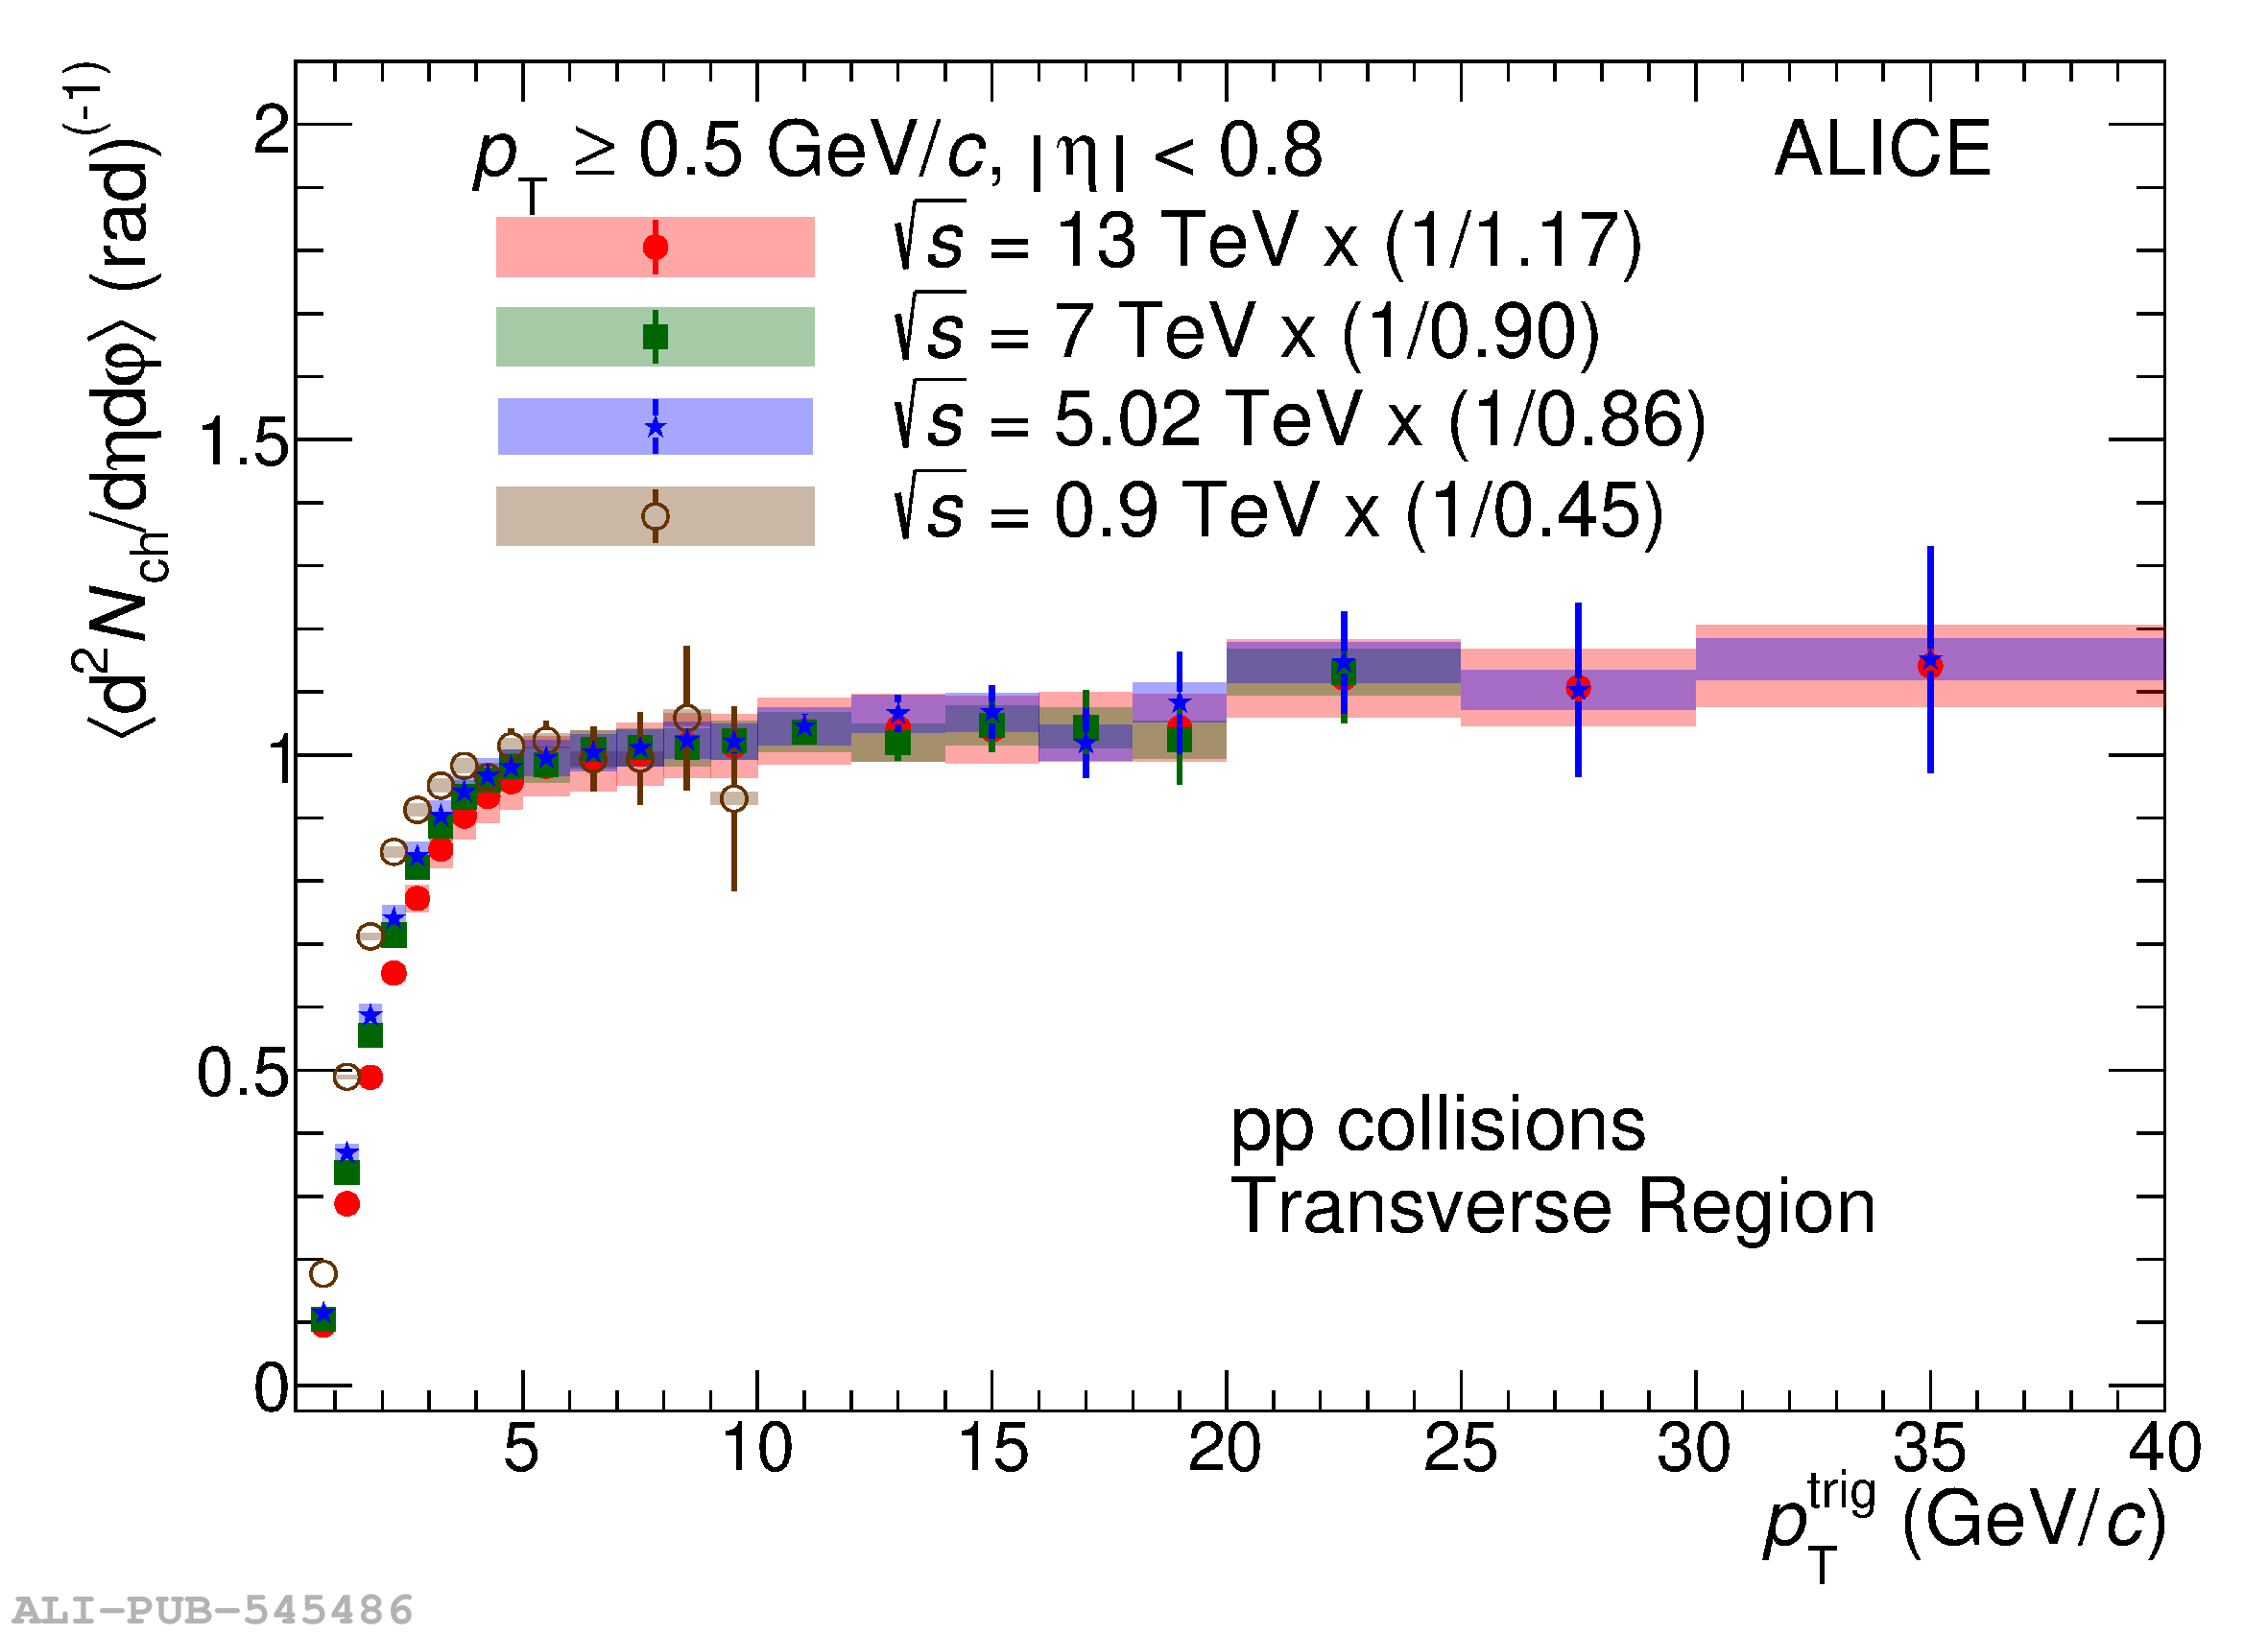 |