Upper panels: charged-particle number (left) and summed-$p_{\rm T}$ (right) densities as a function of $p_{\rm T}^{\rm trig}$ in pp (blue) and p-Pb (red) collisions at $\sqrt{s_{\rm NN}}=5.02$ TeV. Results for data and comparison with models PYTHIA 8 (green) and EPOS LHC (red) predictions for the away (upper) and toward (bottom) regions, after the subtraction of the charged-particle number (left) and summed-$p_{\rm T}$ (right) densities in the transverse region, are shown. Bottom panels: charged-particle number and summed-$p_{\rm T}$ densities measured in pp collisions divided by those in p-Pb collisions are displayed for both data and models. | 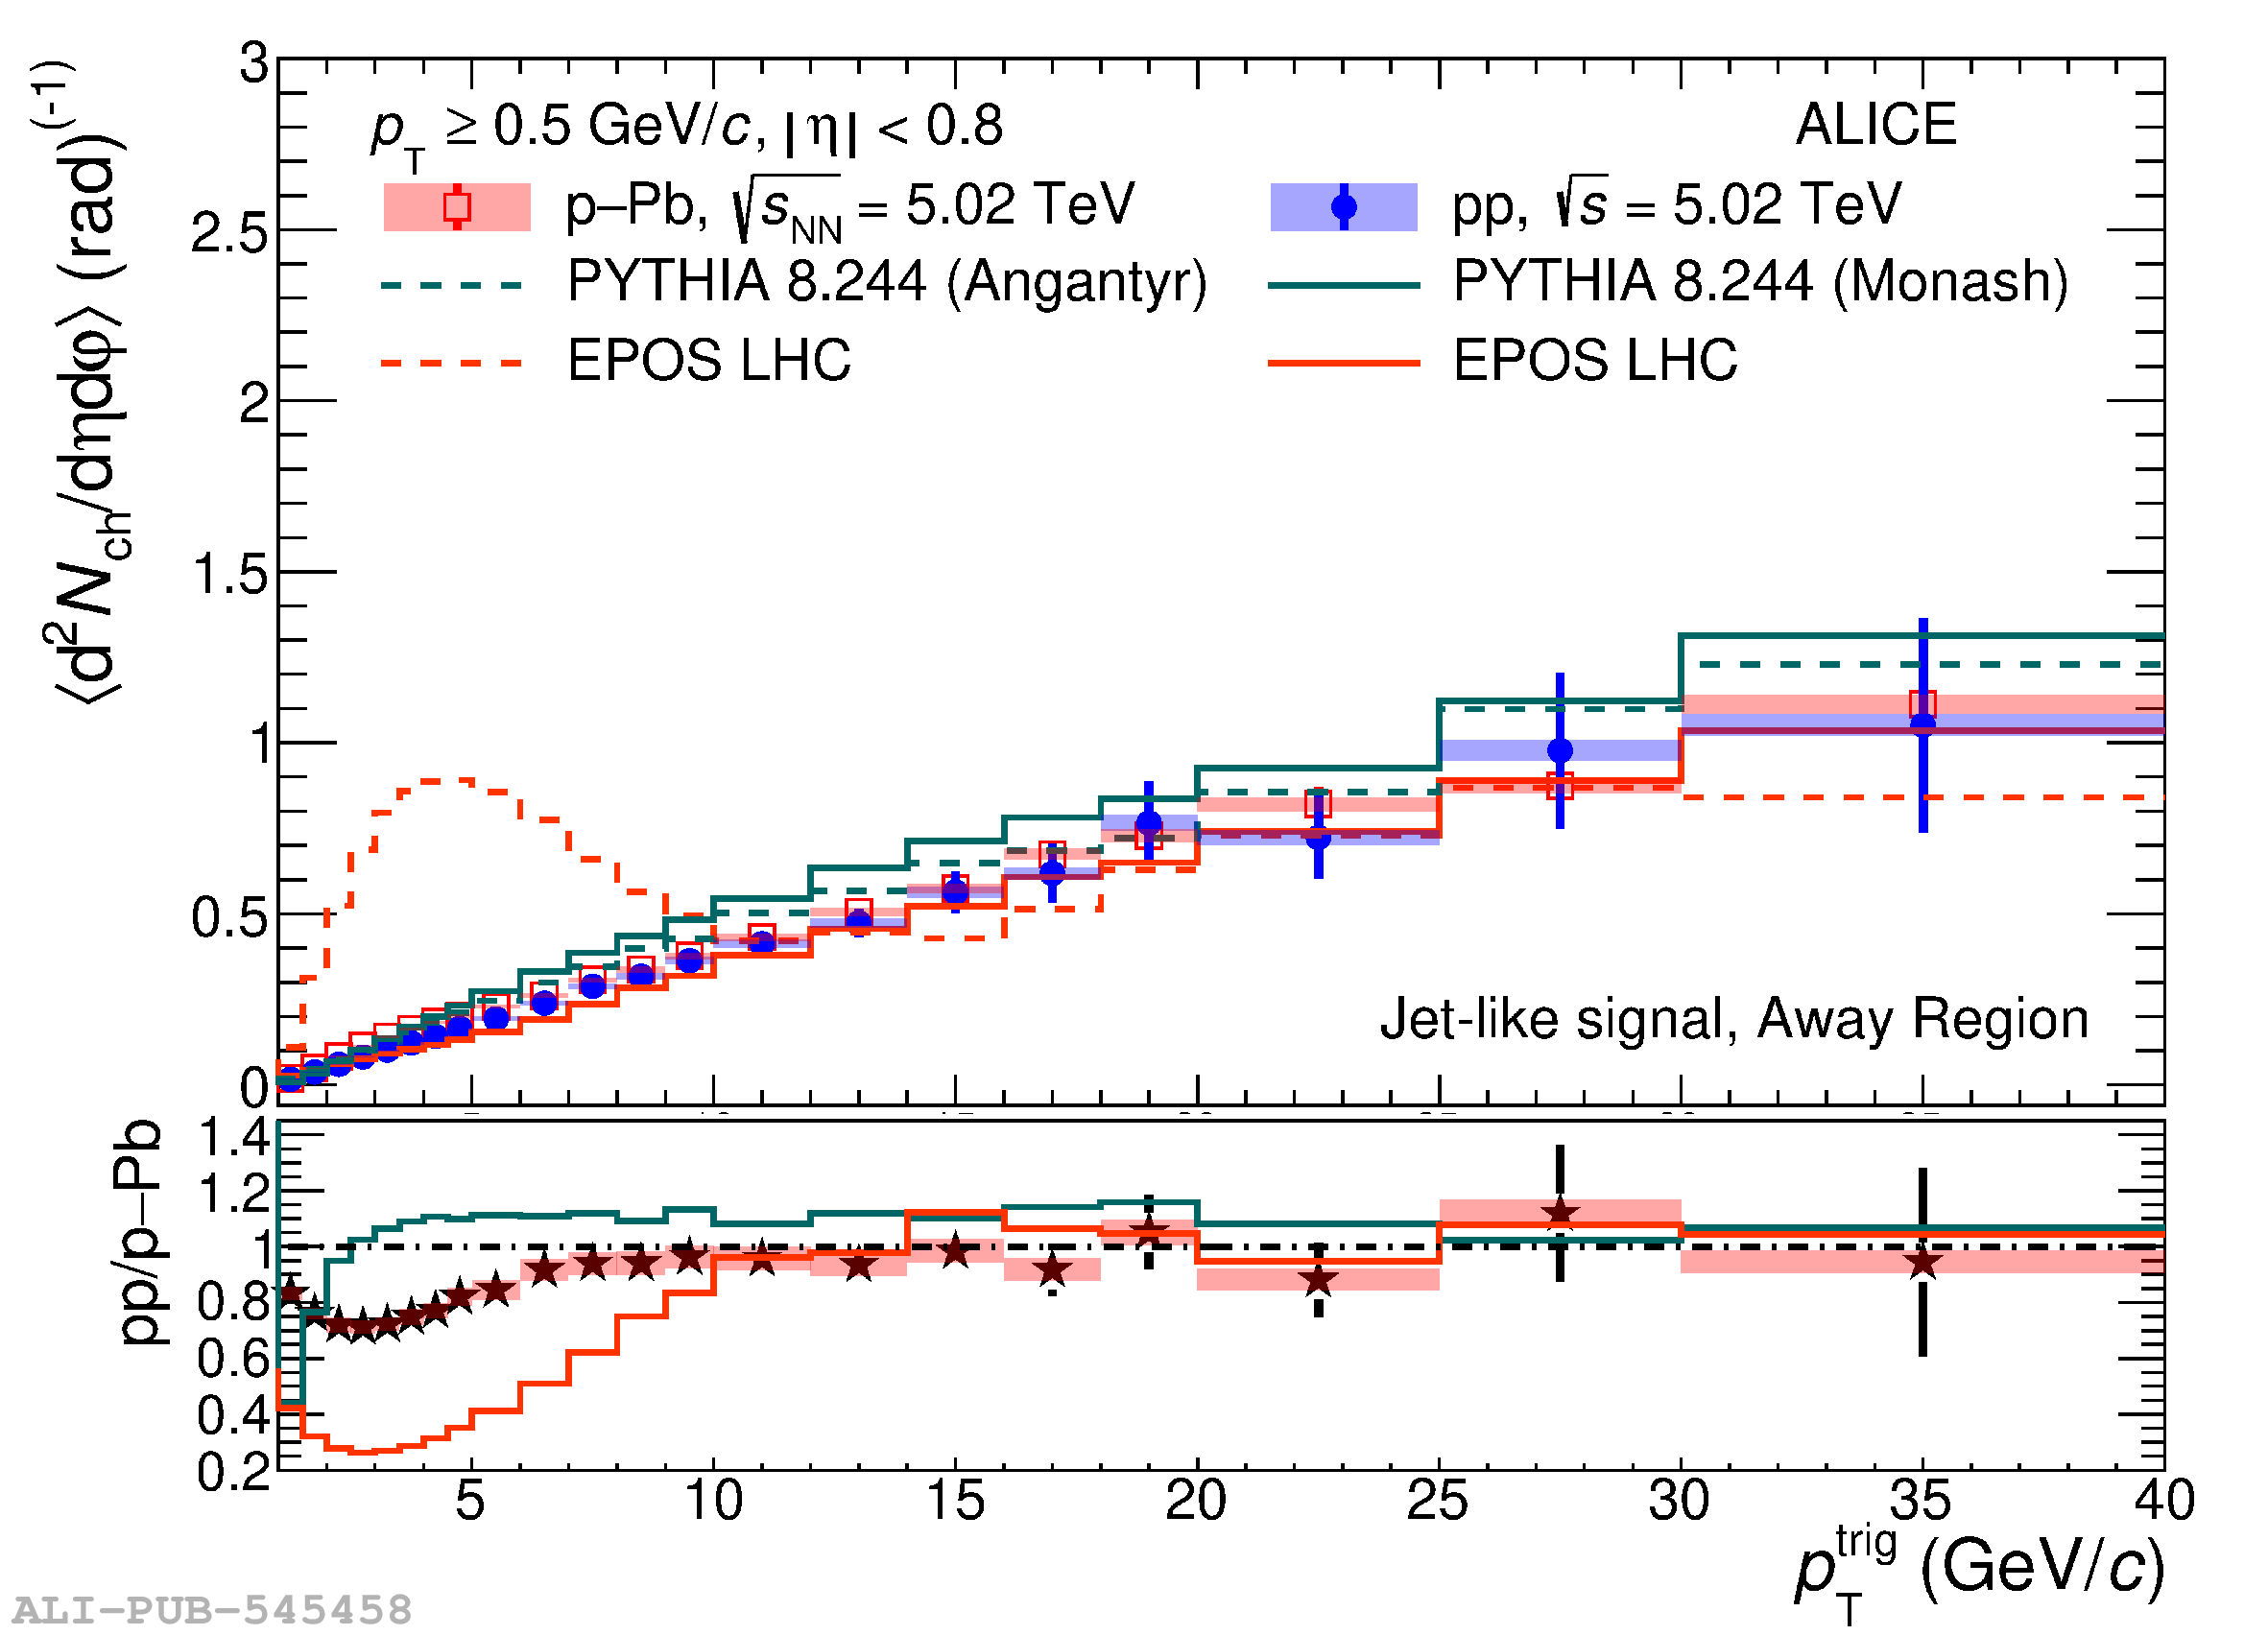 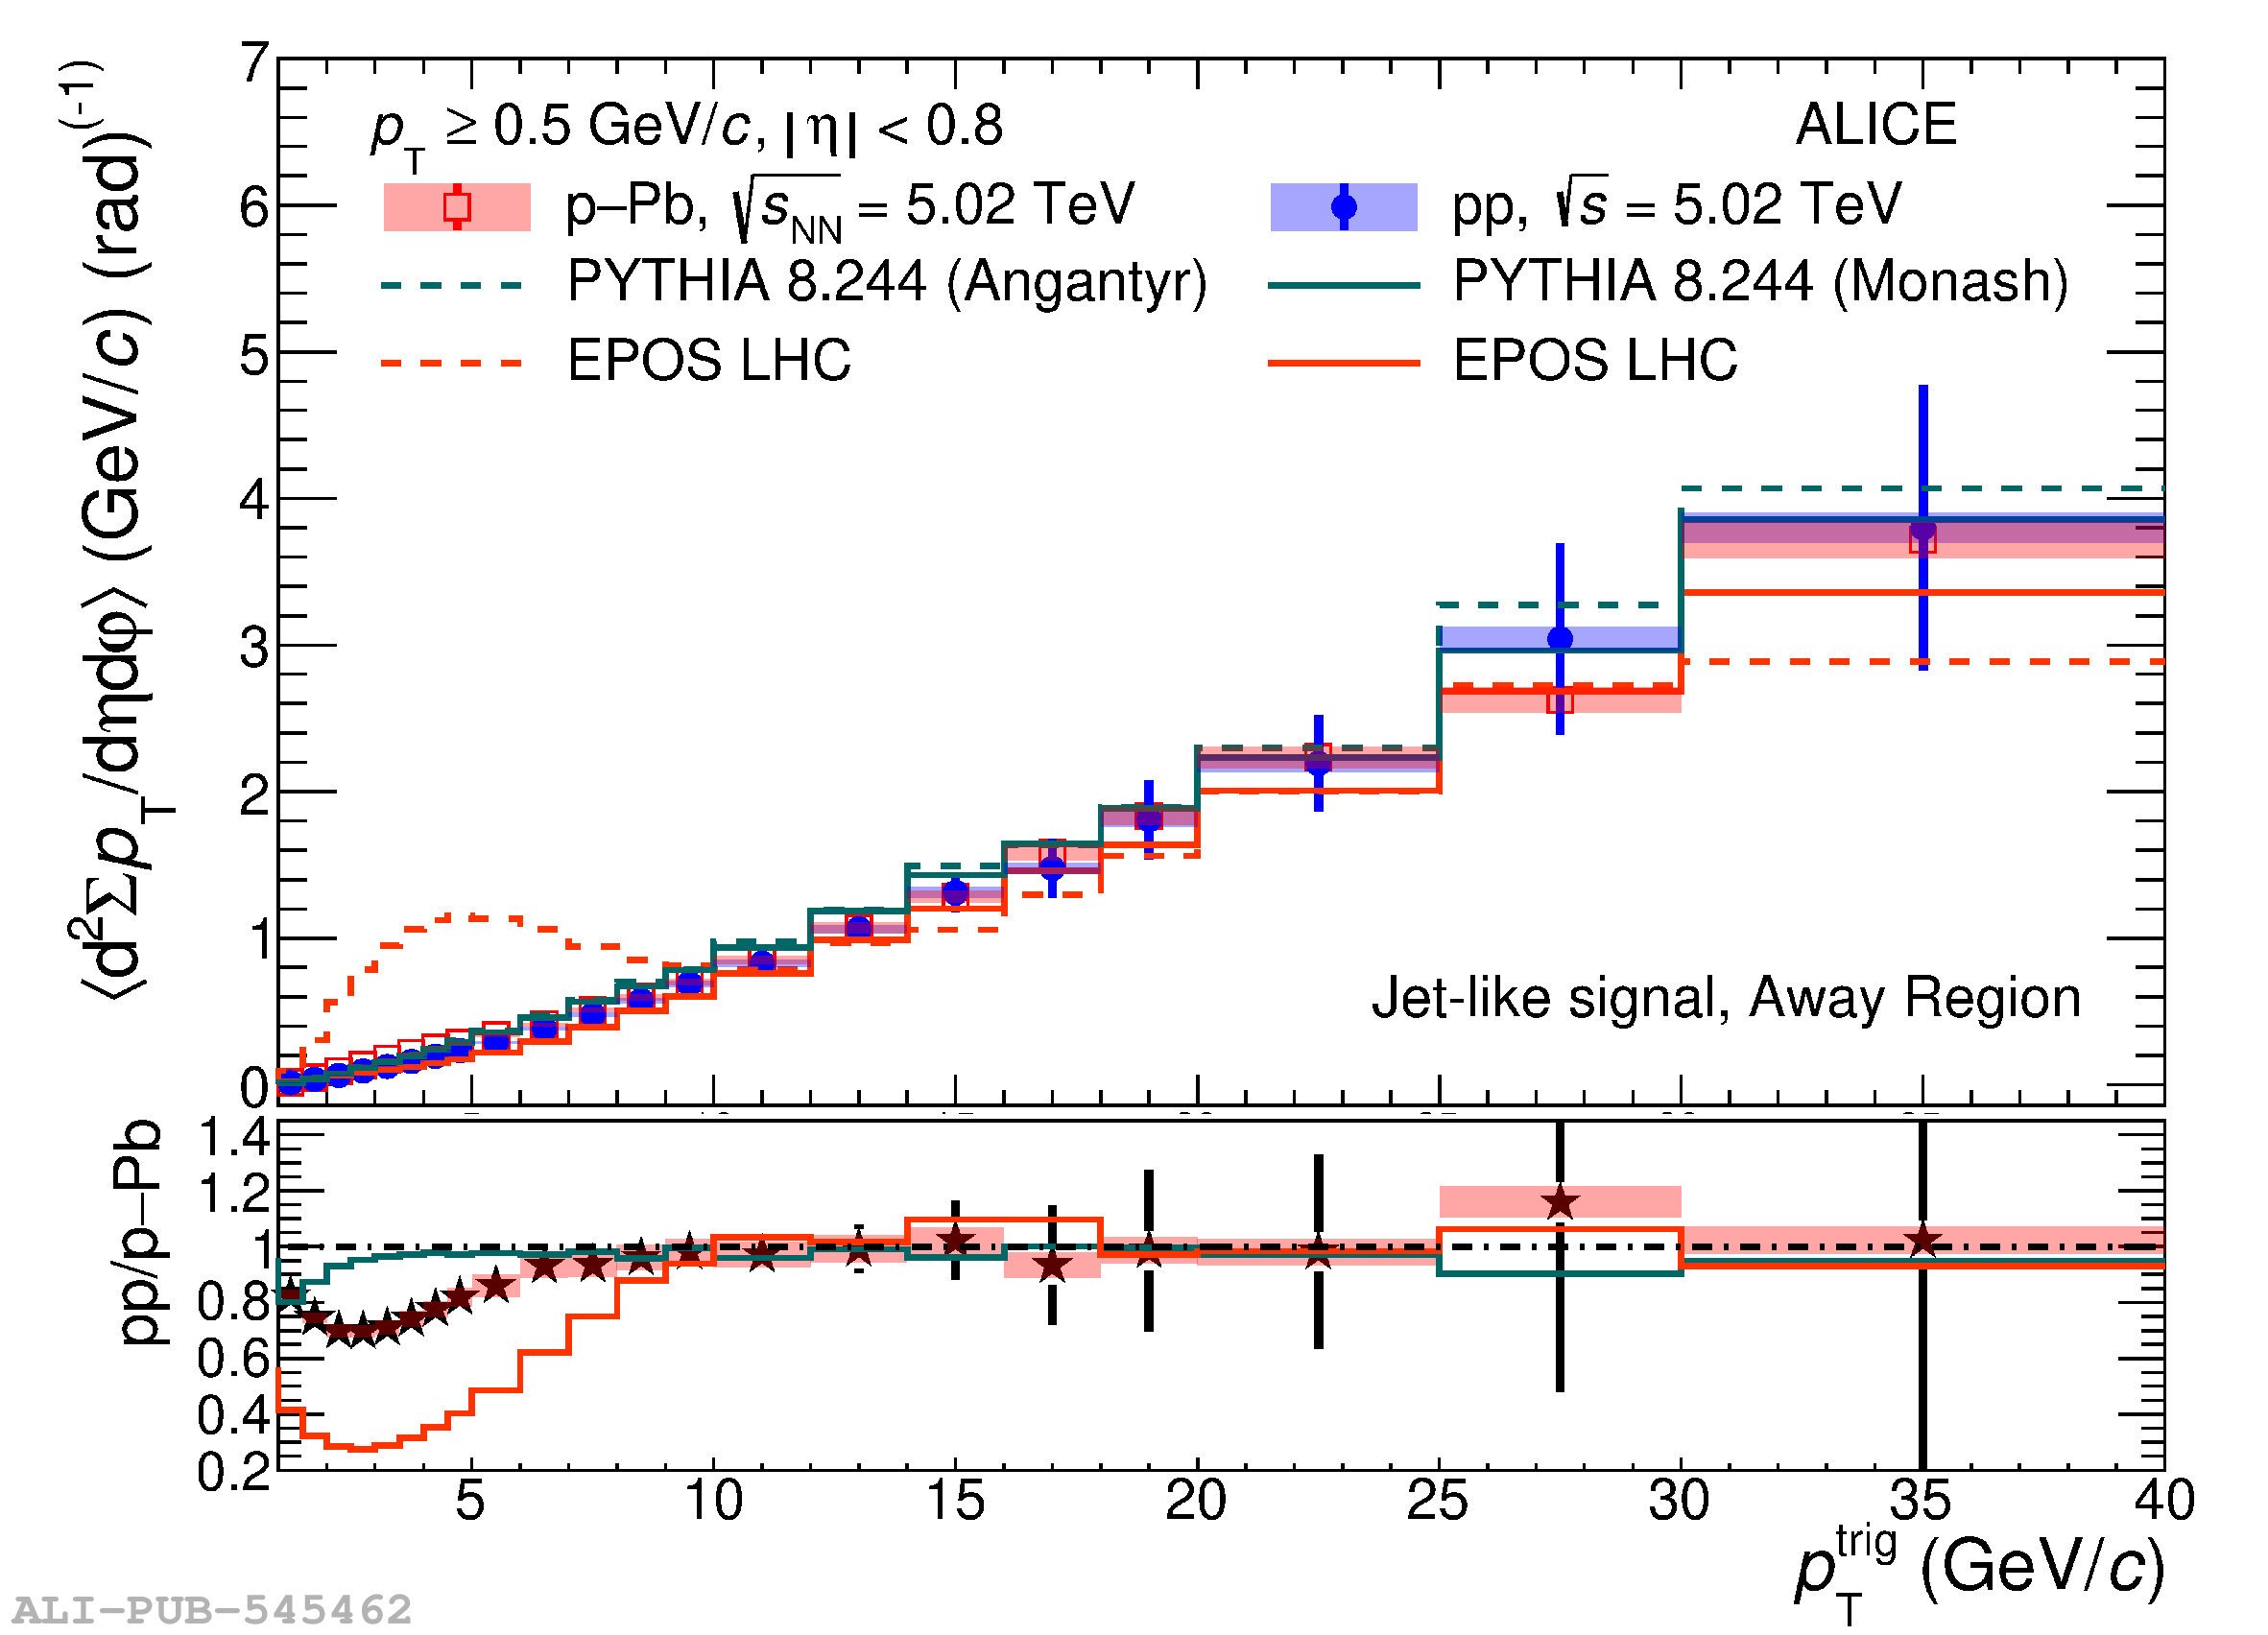 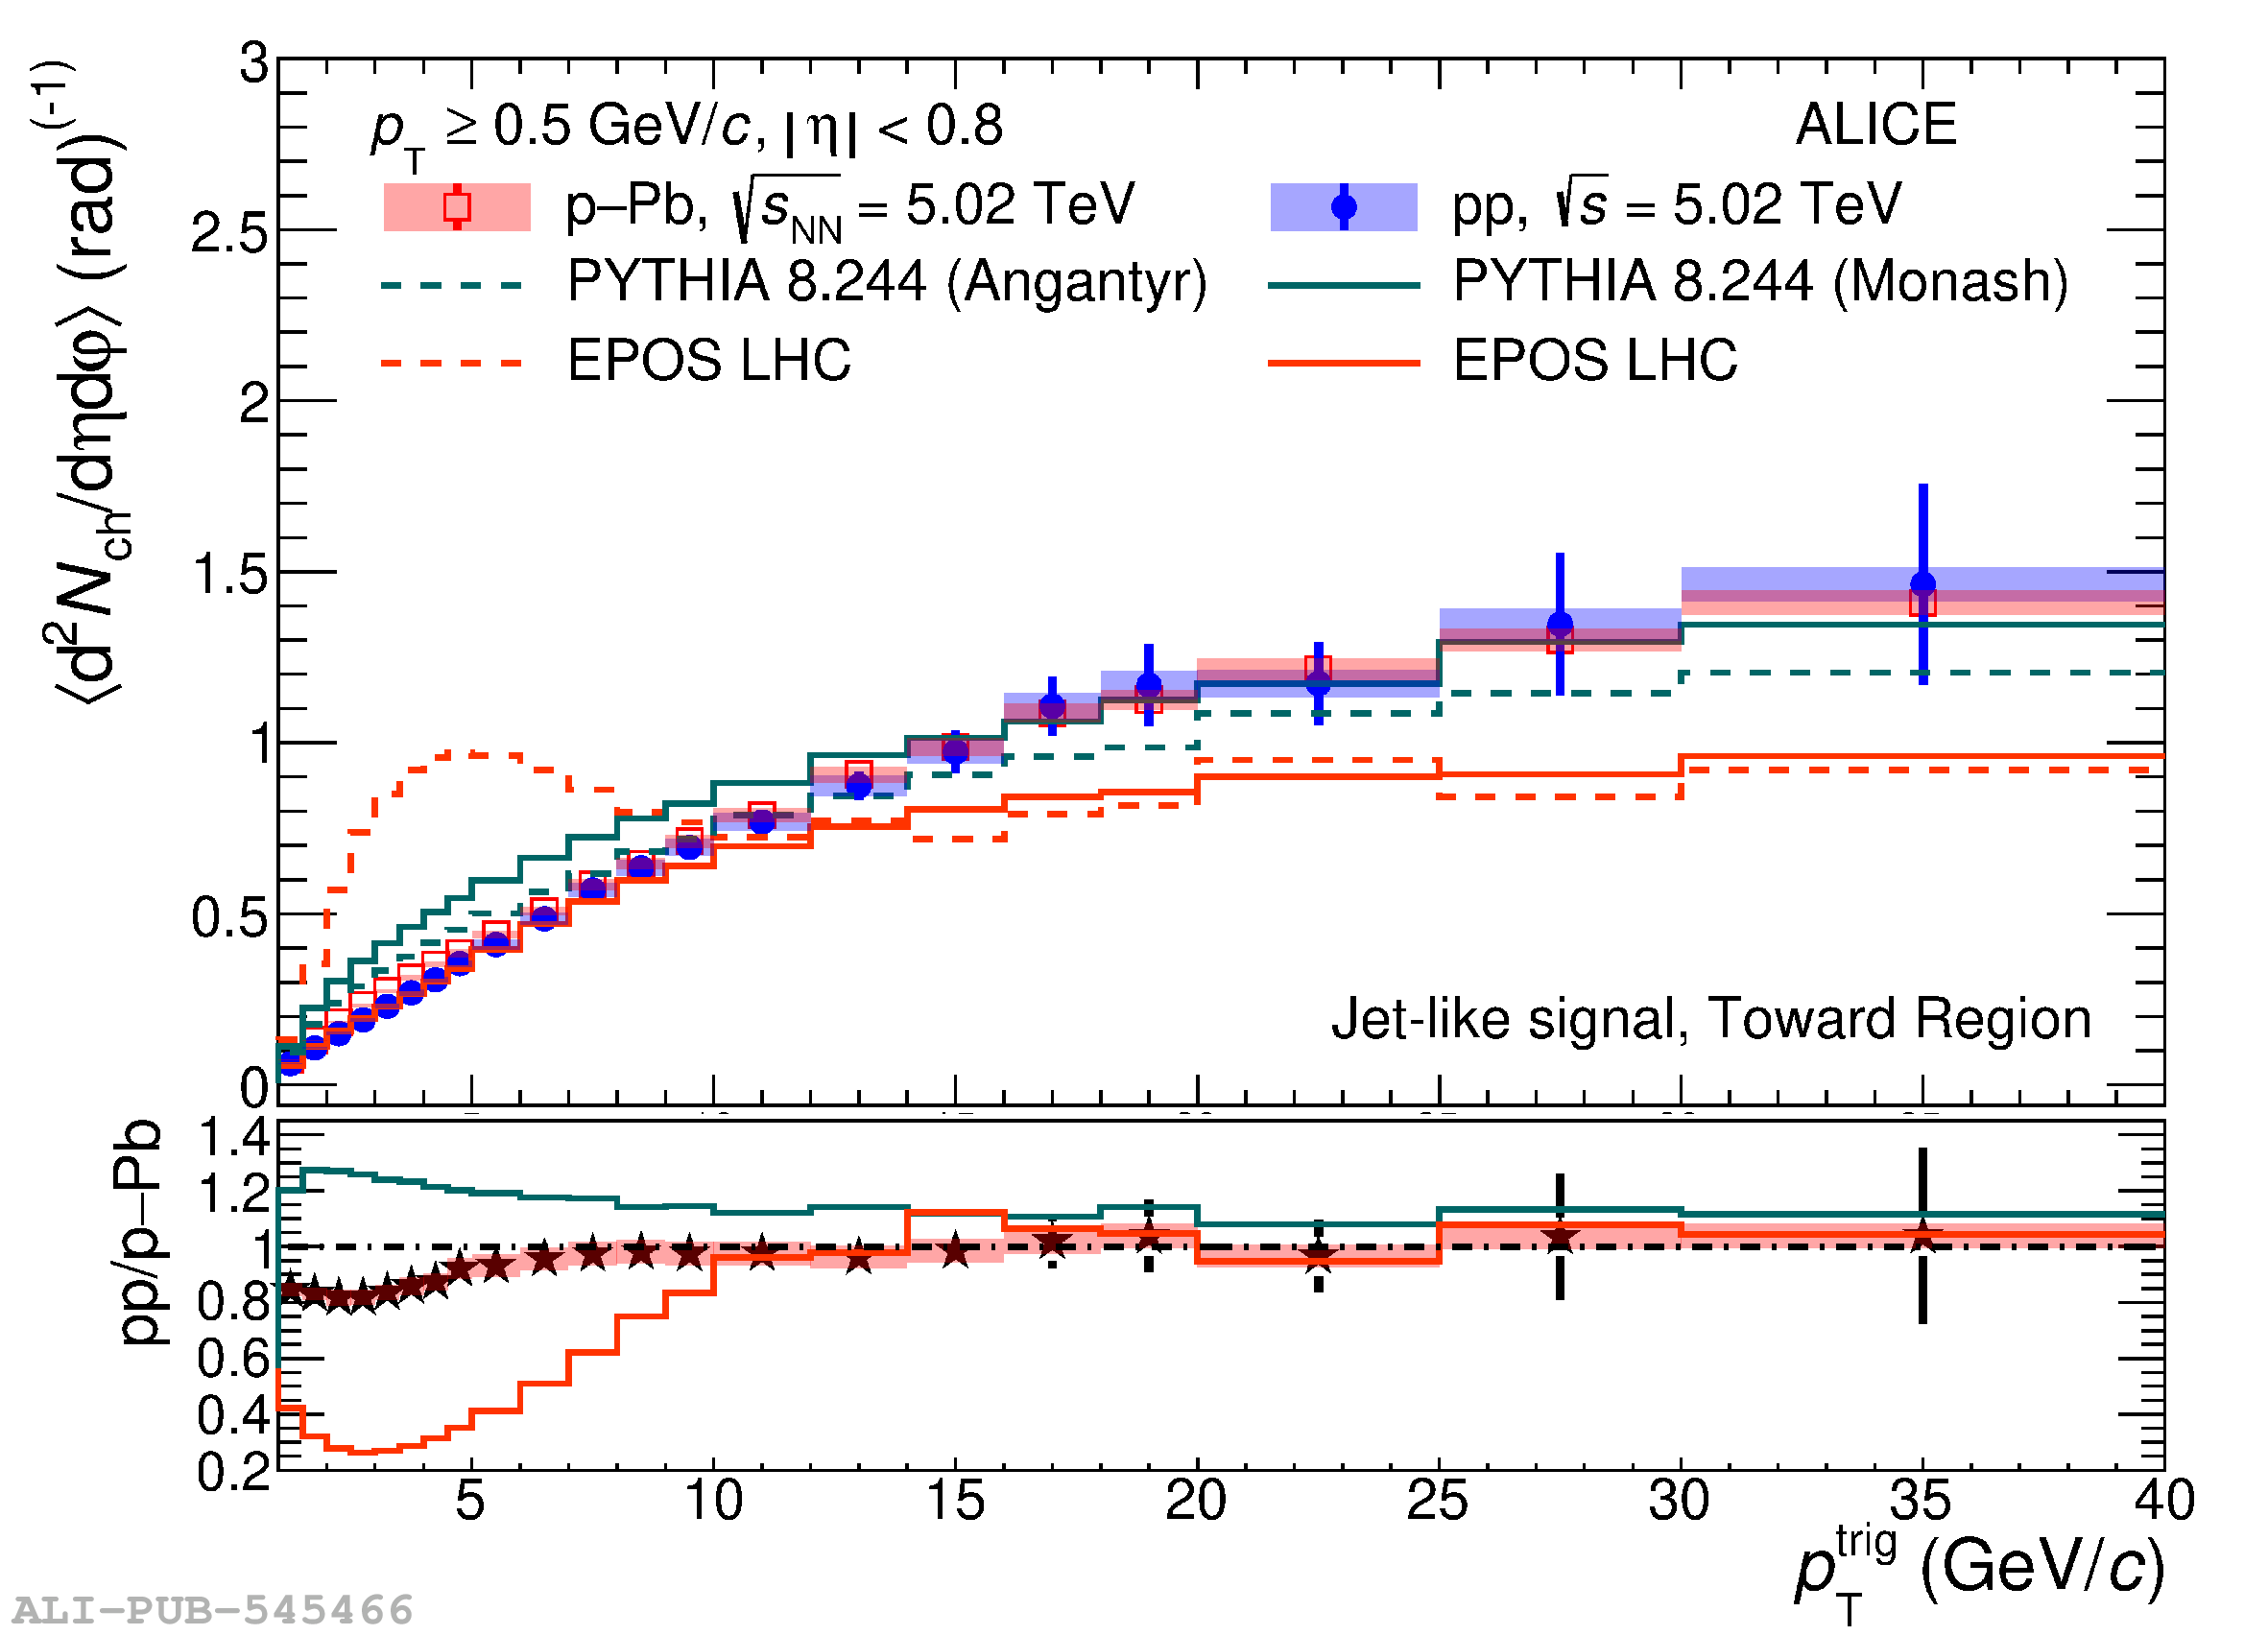 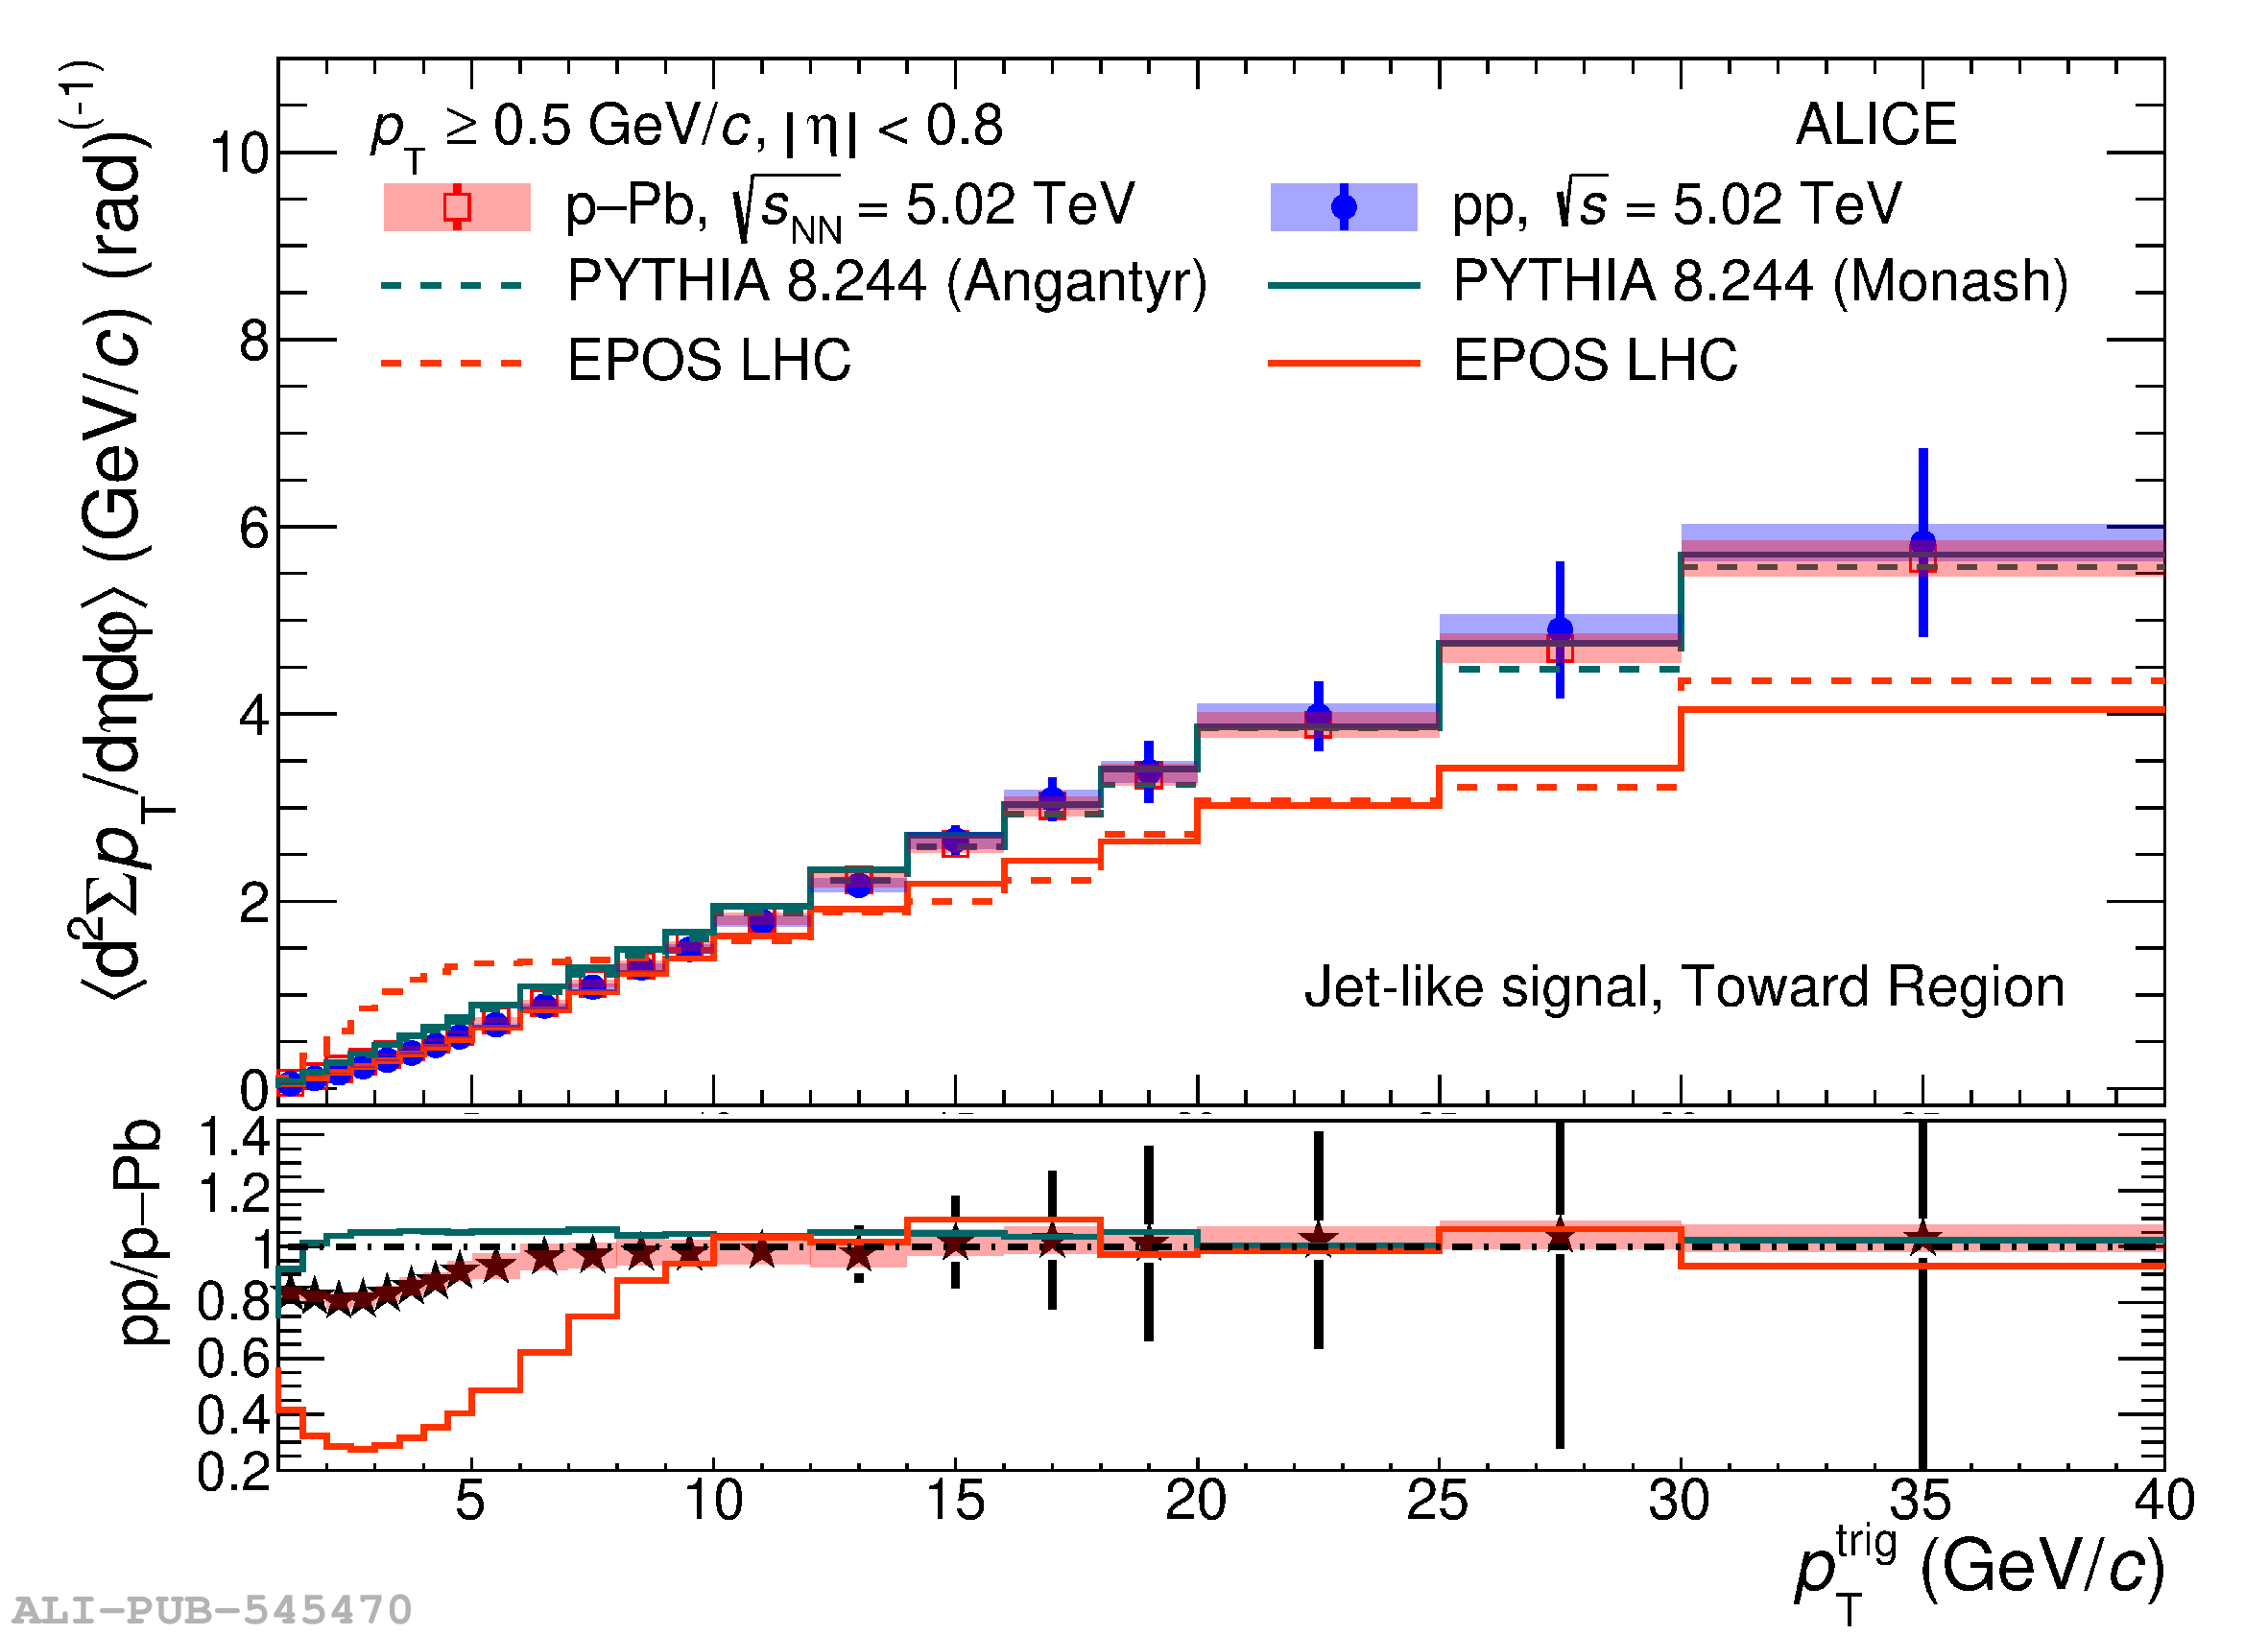 |