The intense photon fluxes from relativistic nuclei provide an opportunity to study photonuclear interactions in ultraperipheral collisions. In particular, it allows for the investigations of excited, light-flavour vector mesons. The measurement of coherently photoproduced $ π^+ π^- π^+ π^-$ final states in ultraperipheral Pb$-$Pb collisions at $\sqrt{s_{\rm NN}} = 5.02$ TeV is presented for the first time. The cross section, d$σ$/d$y$, times the branching ratio ($ρ\rightarrow π^+ π^+ π^- π^-$) is found to be $47.8\pm2.3~\rm{(stat.)}\pm7.7~\rm{(syst.)}$ mb in the rapidity interval $|y| <~ 0.5$. The invariant mass distribution is not well described with a single Breit-Wigner resonance without an interference term. Including interference with a non-resonant contribution results in the mass and width values being too far from those reported in PDG, while the production of two interfering resonances, $ρ(1450)$ and $ρ(1700)$, also provides a good description of the data. The values of the masses ($m$) and widths ($Γ$) of the resonances extracted from the fit assuming two interfering resonances are $m_{1}=1385\pm14~\rm{(stat.)}\pm3~\rm{(syst.)}$ MeV/$c^2$, $Γ_{1}=431\pm36~\rm{(stat.)}\pm82~\rm{(syst.)}$ MeV/$c^2$, $m_{2}=1663\pm13~\rm{(stat.)}\pm22~\rm{(syst.)}$ MeV/$c^2$ and $Γ_{2}=357~\pm31~\rm{(stat.)}\pm49~\rm{(syst.)}$ MeV/$c^2$, respectively. The measured cross sections times the branching ratios are compared to recent theoretical predictions.
Phys. Lett. B. 872 (2025) 140006
HEP Data
e-Print: arXiv:2404.07542 | PDF | inSPIRE
CERN-EP-2024-104
Figure group
Figure 1
Distribution of the event $p_{\rm T}$ in events with zero net charge in the invariant mass range $0.8 < m < 2.5$ GeV/$c^2$ and the rapidity interval $|y| < 0.5$. The data (red circles) are shown together with the fitted function (solid black line) and its three components as described in the text. | 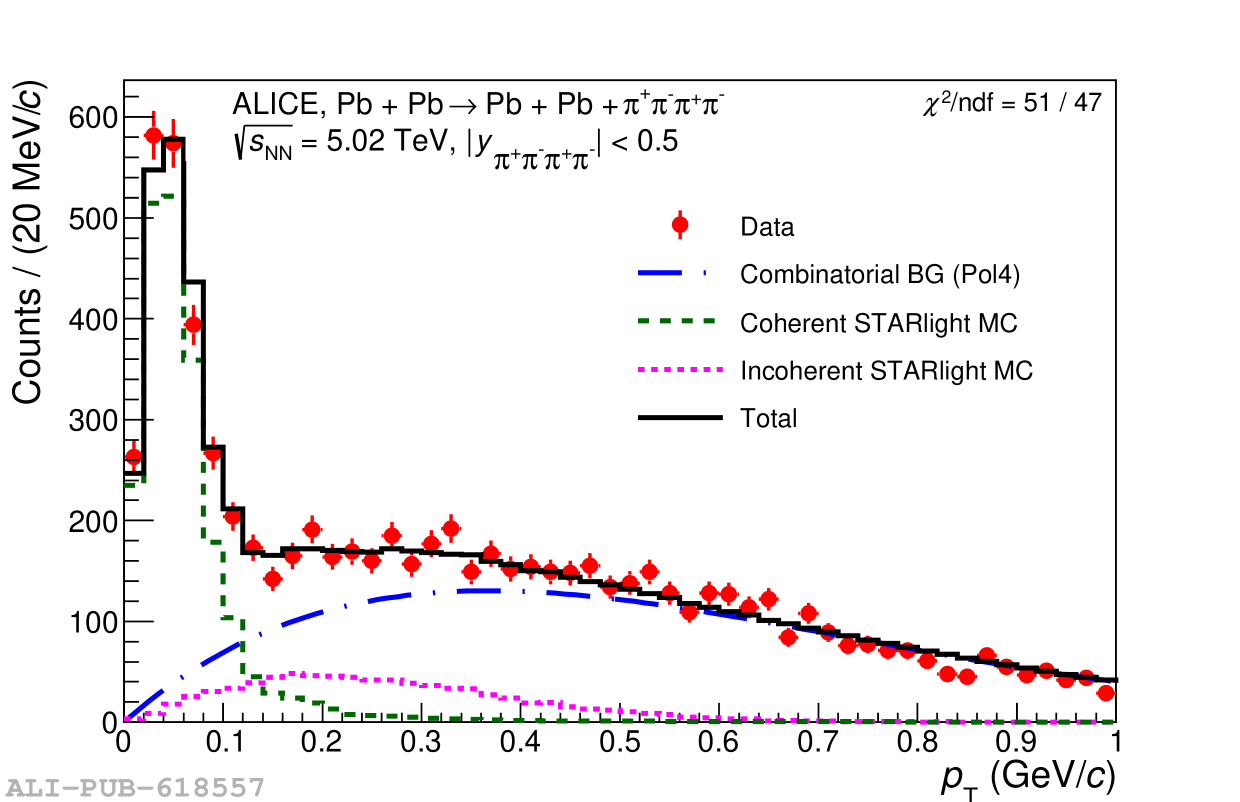 |
Figure 2
Corrected invariant mass spectrum for the coherent four pion photoproduction fitted with one resonance (top), one resonance interfering with non-resonant production (middle) and two resonance with interference (bottom) models, as described in the text. Black error bars represent the statistical error, the orange band shows the uncorrelated systematic uncertainty, and the boxes show them added in quadrature. "Prob" reflects the probability of having the given or a higher $\chi^2/\rm{ndf}$ of the fit. | 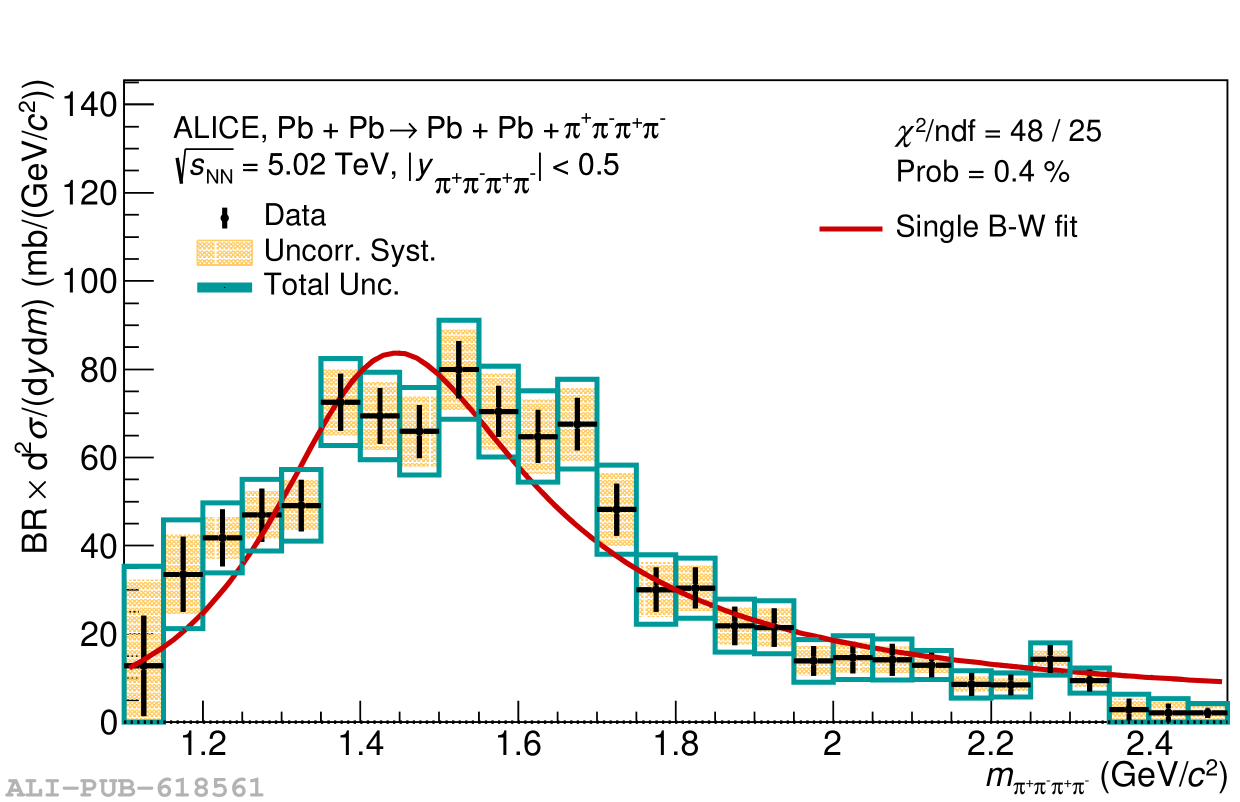 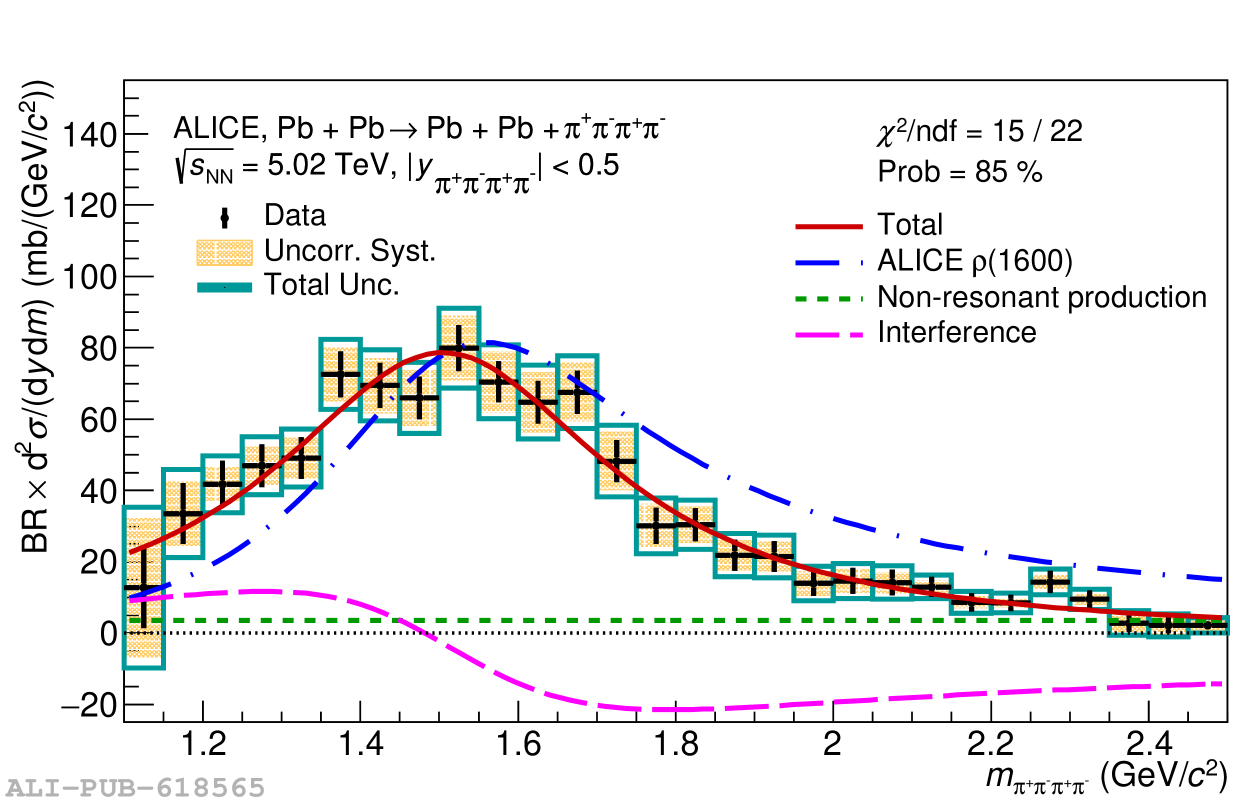 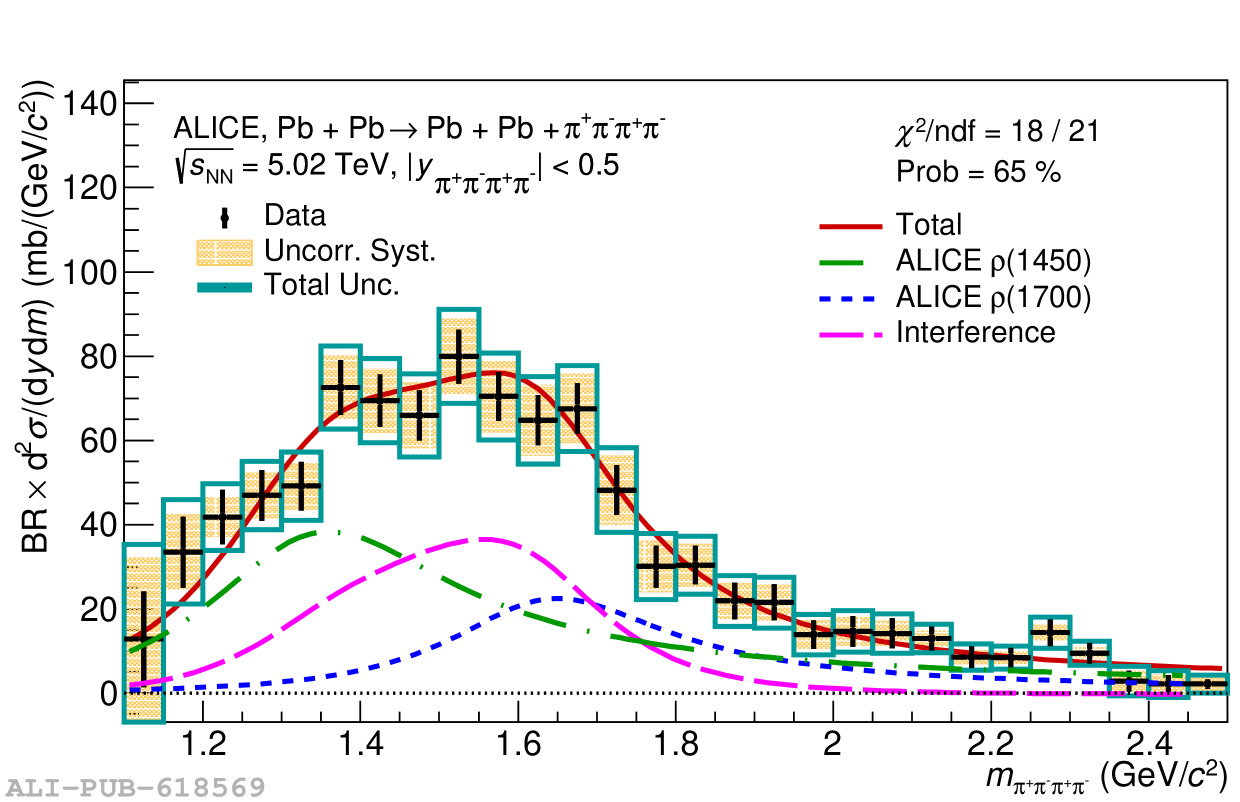 |
Figure 3
Cross sections for the one-resonance and two-resonances scenarios (full red circles) compared to the theoretical calculations from Ref.[44] (open black circles). Horizontal error bars on the data points show the statistical uncertainty and the boxes represent the statistical and systematic uncertainties added in quadrature. Horizontal error bars on the theory points show the theoretical uncertainty. | 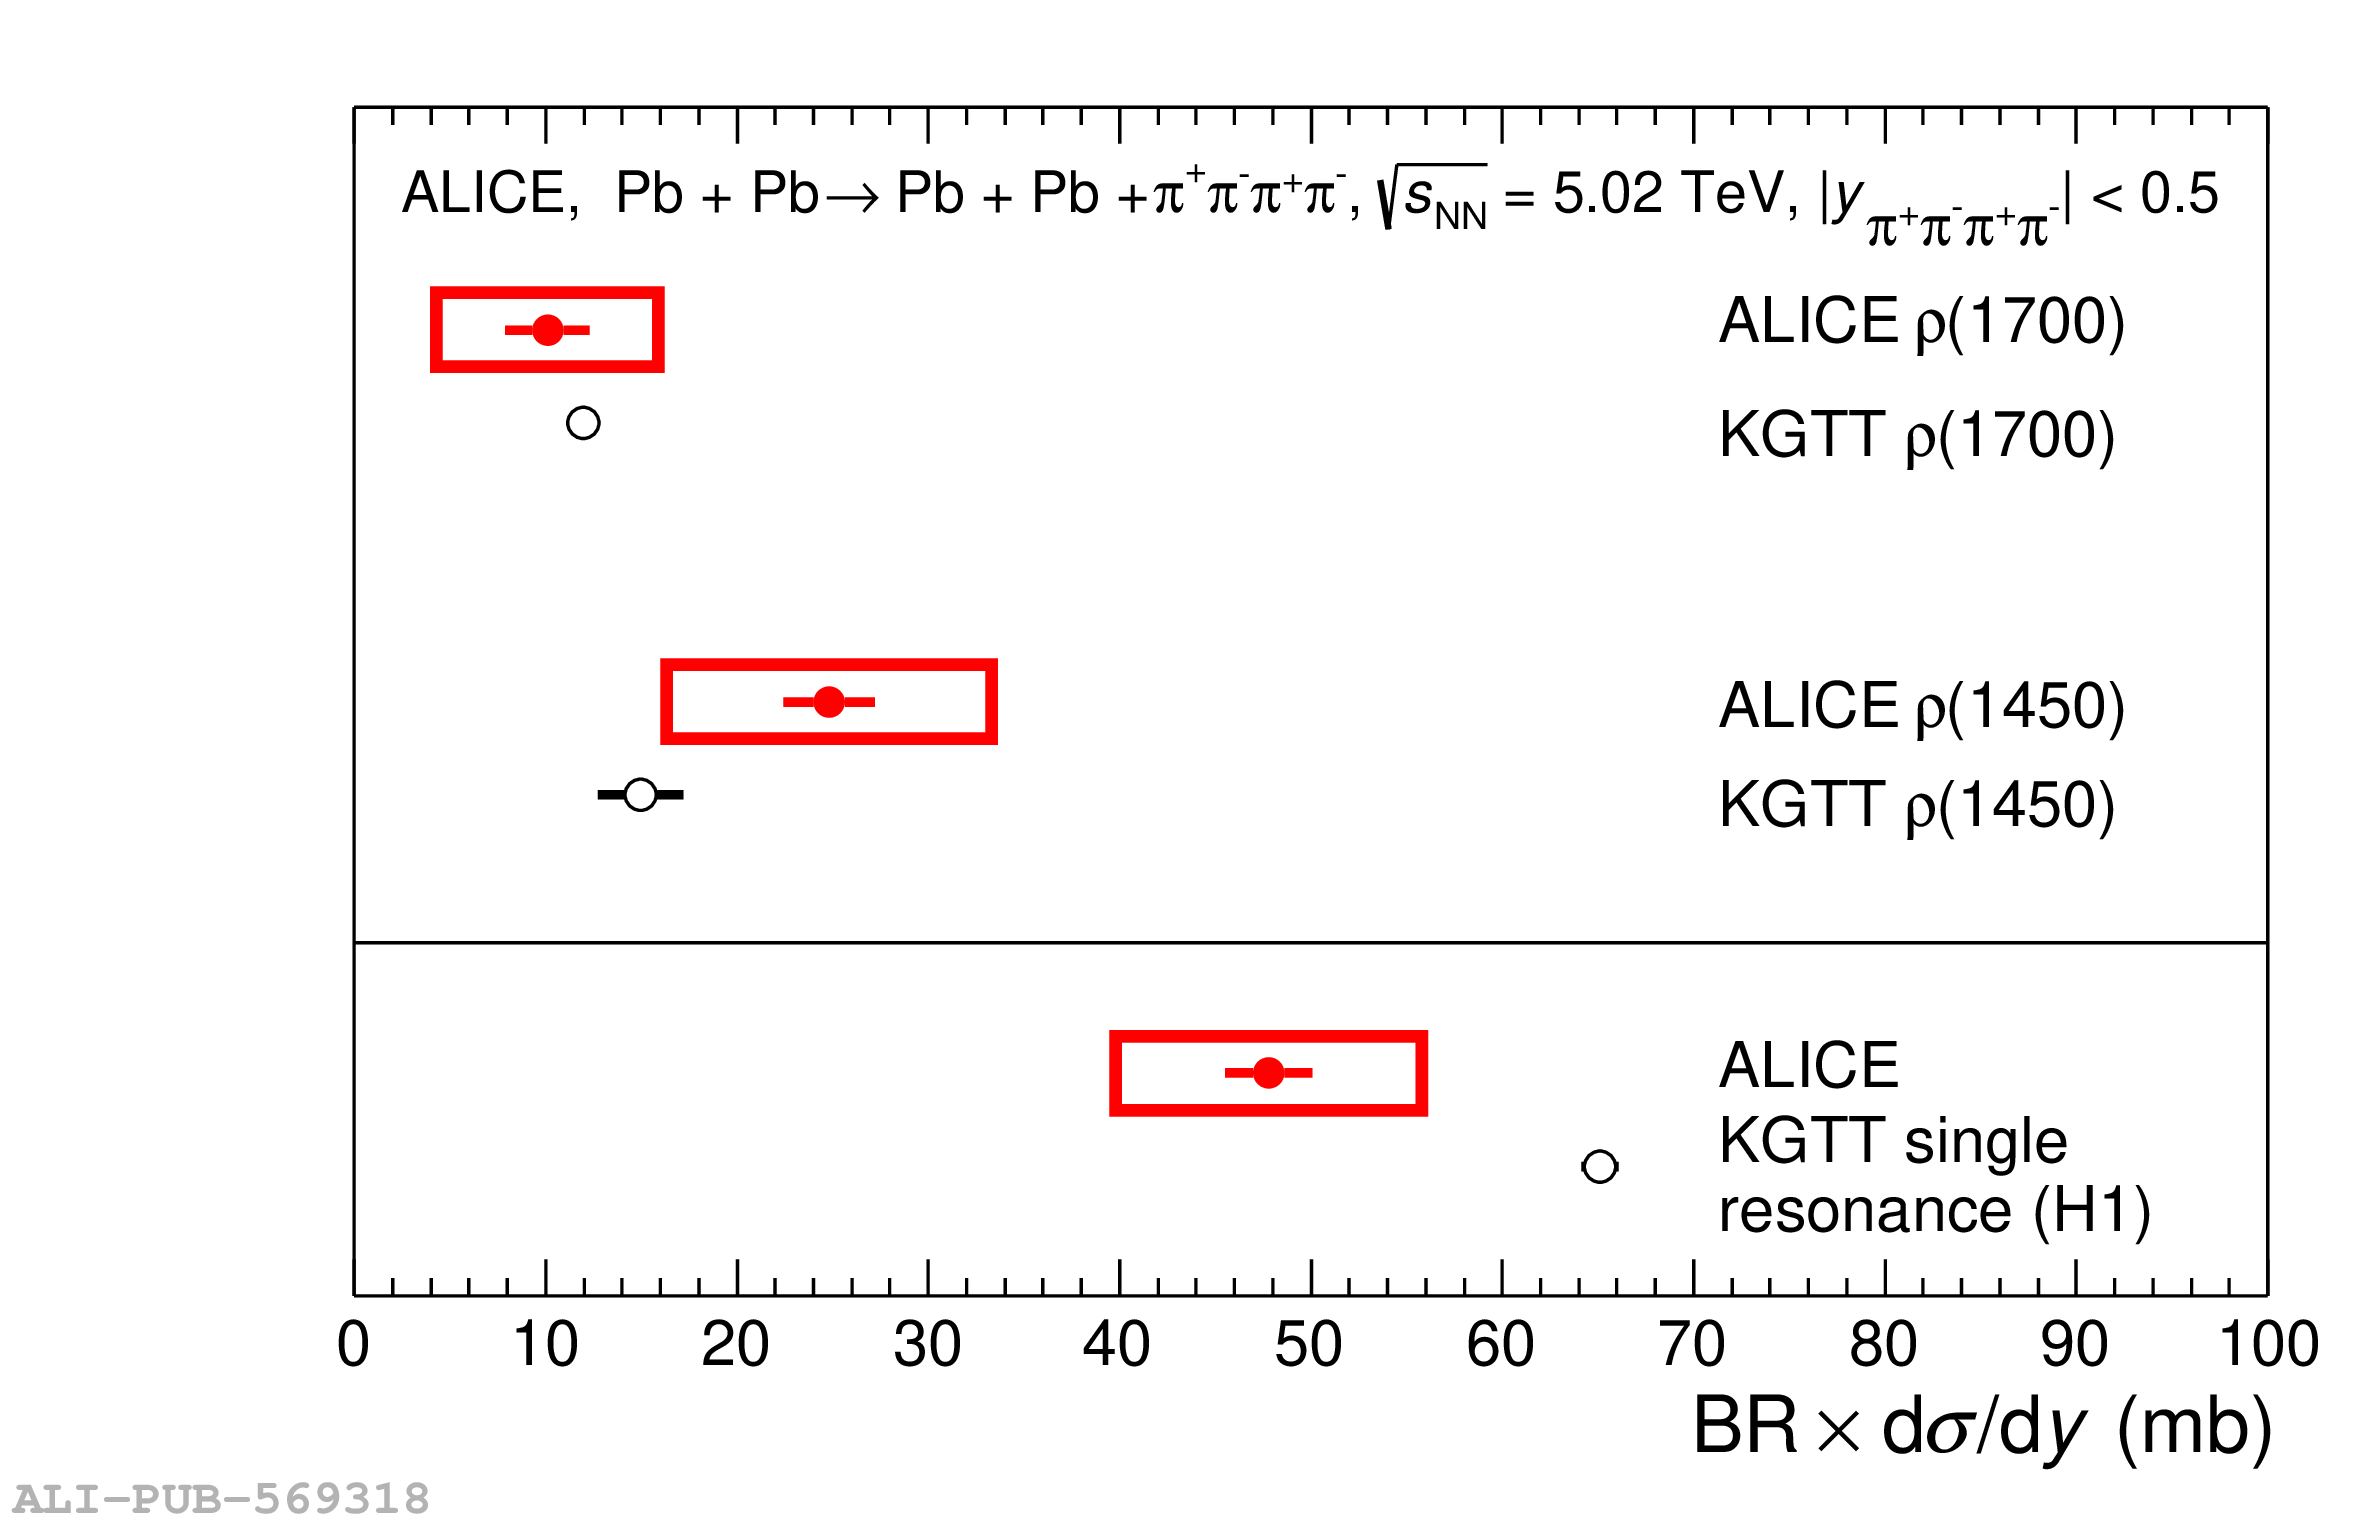 |
Figure A.1
Corrected invariant mass spectrum for the coherent four-pion photoproduction fitted to the model described by a single resonance and an alternative shape of the non-resonant production given by Eq.A.2.. Black error bars represent the statistical uncertainty, the orange band shows the uncorrelated systematic uncertainty, and the boxes show them added in quadrature. "Prob'' reflects the probability of obtaining the given or a higher $\chi^2/\mathrm{ndf}$ of the fit. | 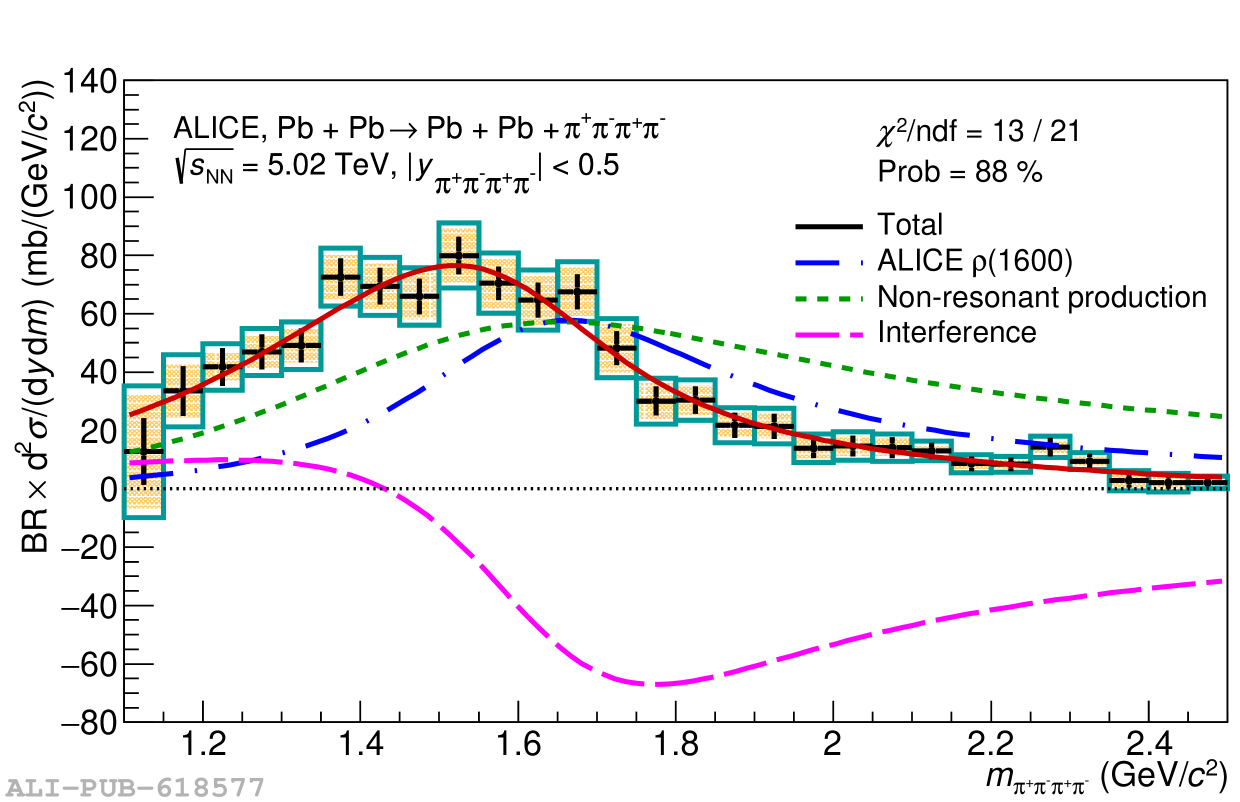 |
Figure A.2
Corrected invariant mass spectrum for the coherent four-pion photoproduction fitted with two resonances plus a non-resonant continuum, Eq.A.3.. Black error bars represent the statistical uncertainty, the orange band shows the uncorrelated systematic uncertainty, and the boxes show them added in quadrature. "Prob'' reflects the probability of obtaining the given or a higher $\chi^2/\mathrm{ndf}$ of the fit. | 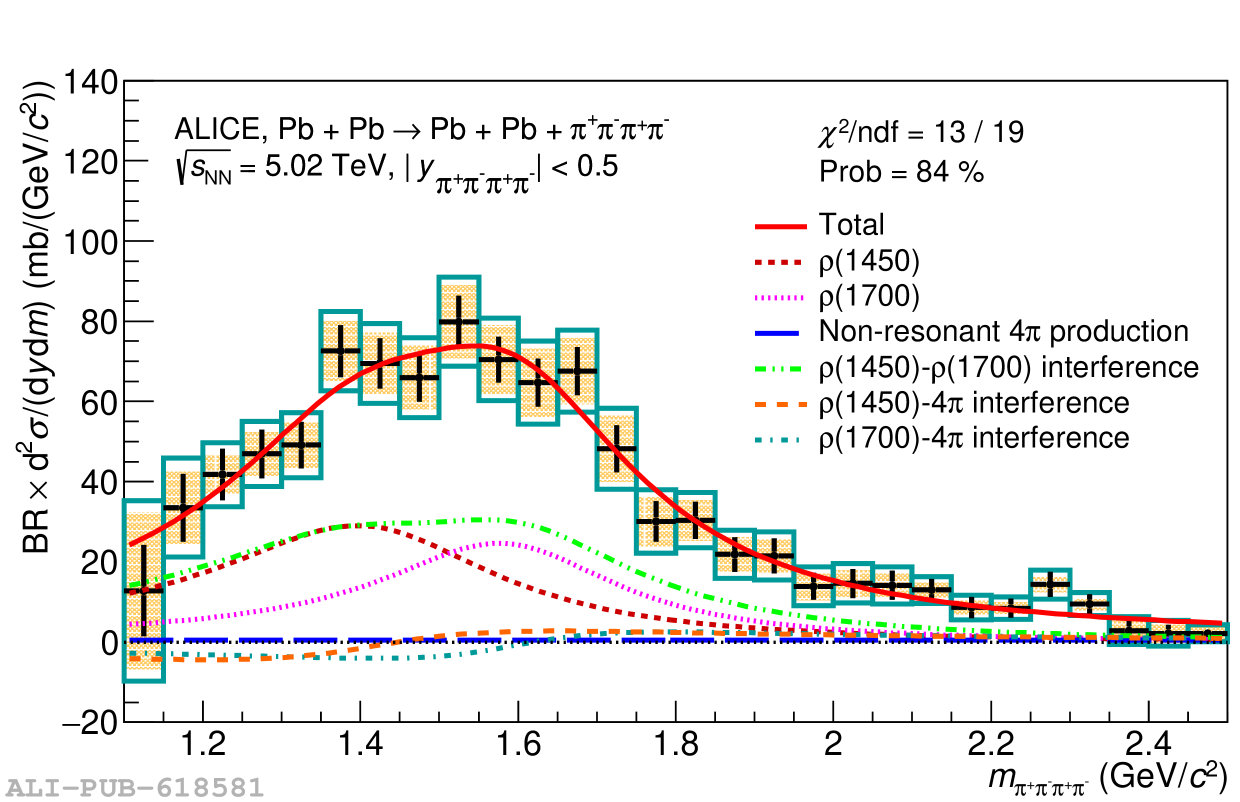 |