Invariant mass distributions of $\Lambda_\mathrm{c}^{+}\rightarrow\mathrm{pK}^0_\mathrm{S}$ candidates in $0 < p_\mathrm{T} < 1\,\mathrm{GeV}/c$, in pp (left) and p–Pb (right) collisions at $\sqrt{s_\mathrm{NN}} = 5.02$ TeV. The red dashed curves represent the background fits, and the blue curves the total fits. The lower panels show the distributions after subtracting the background estimated with the fit. | 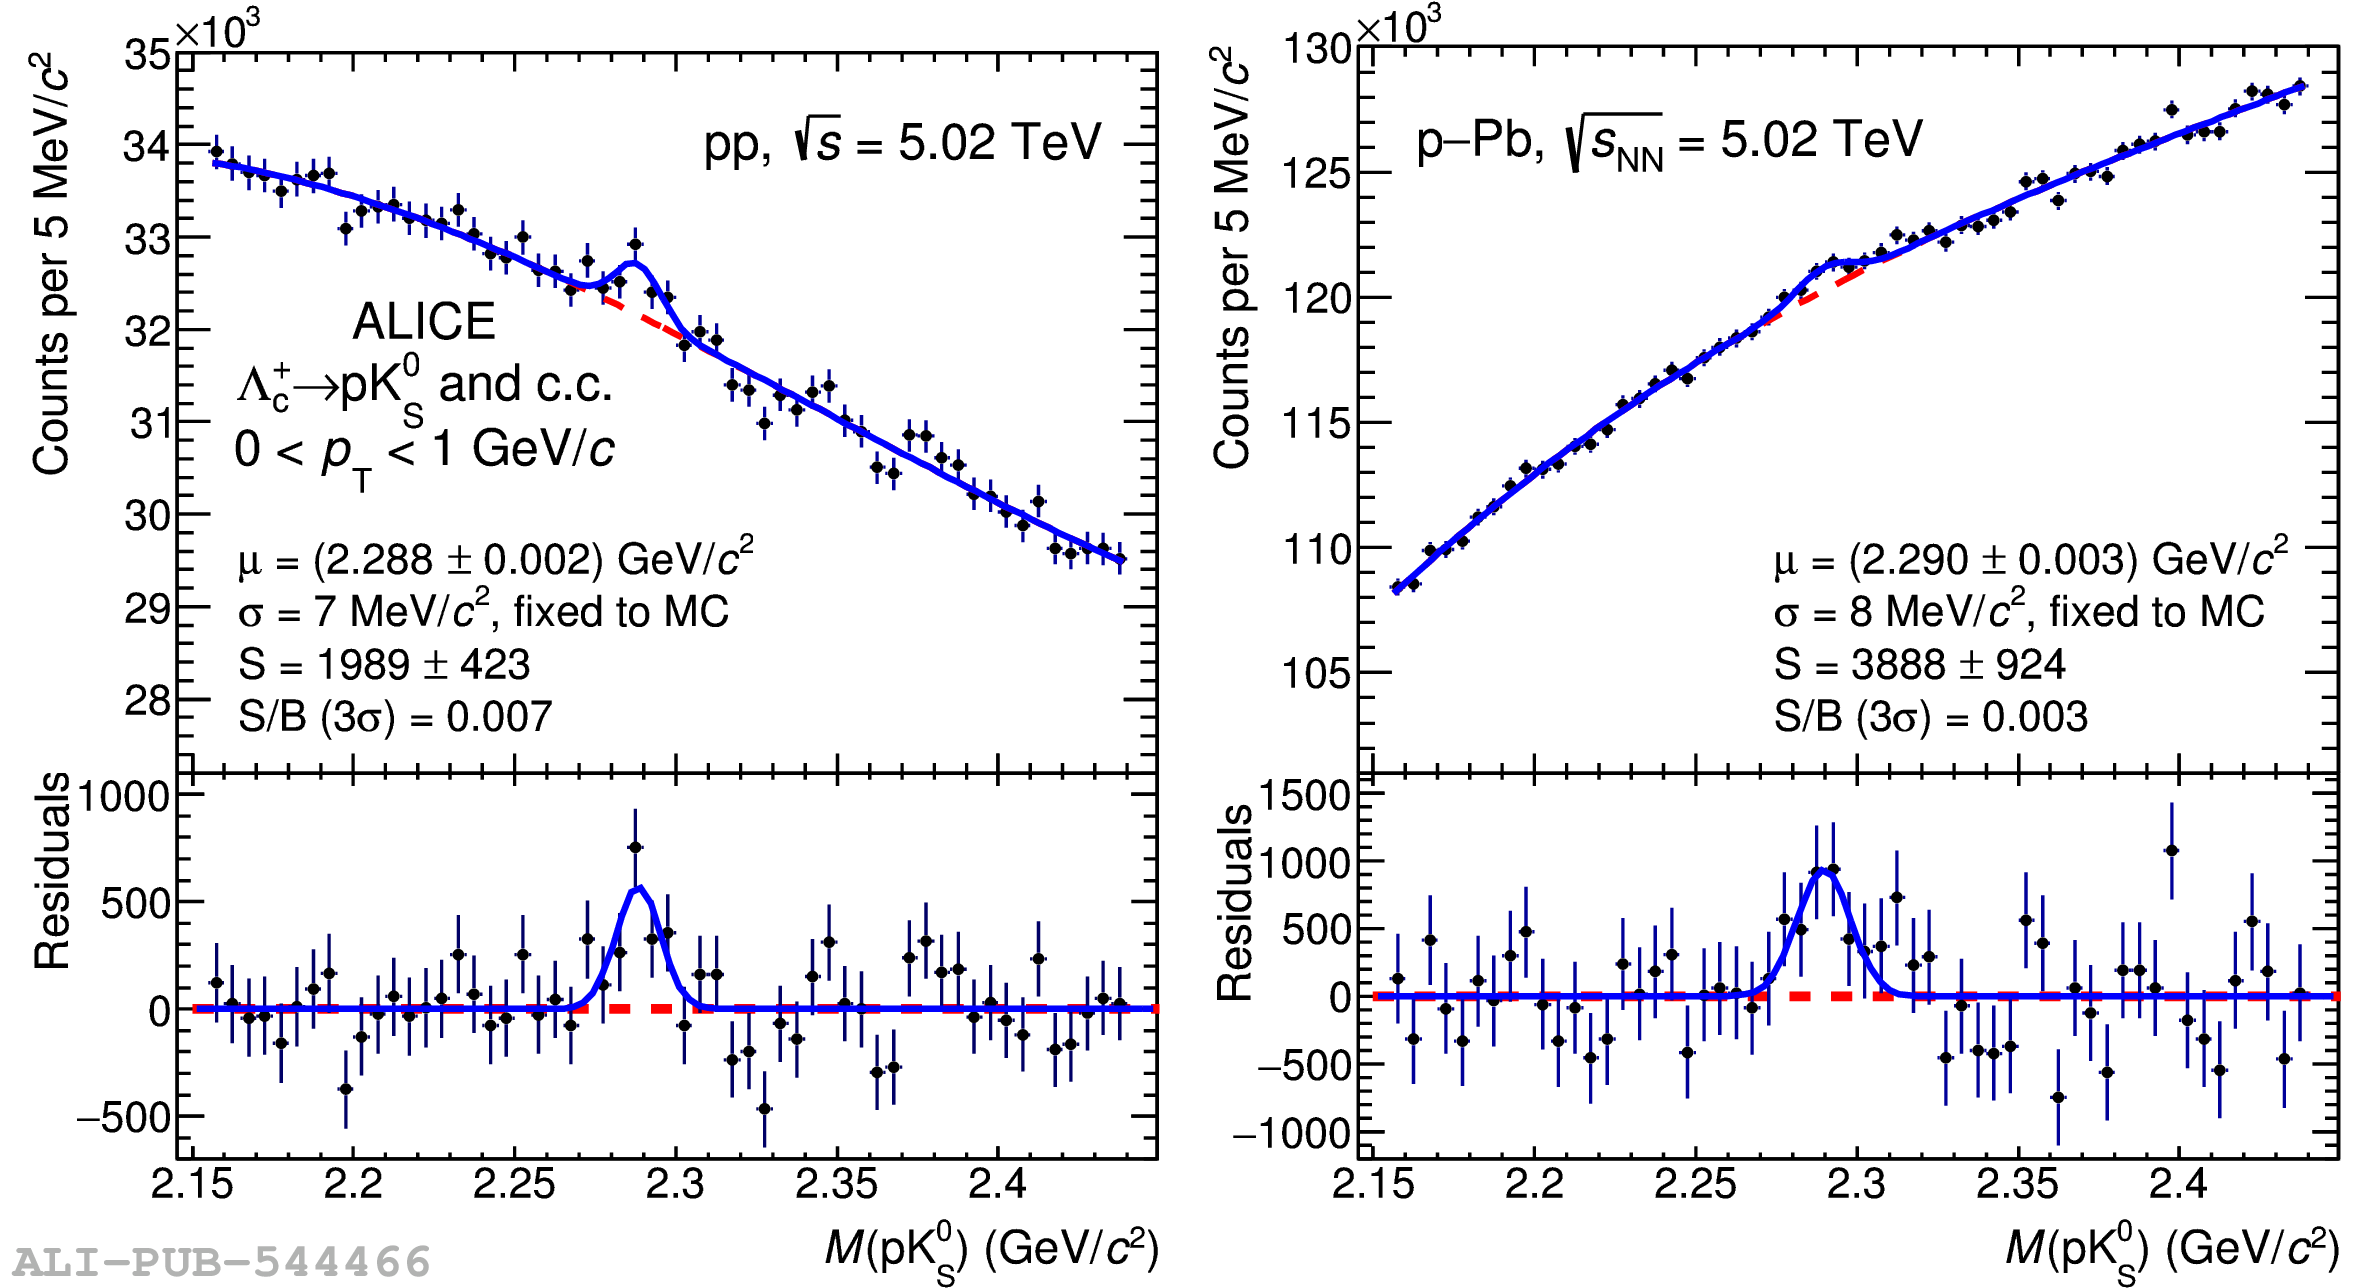 |