Distributions of the BDT output probabilities for $\Lambda_\mathrm{c}^{+}\rightarrow\mathrm{pK}^0_\mathrm{S}$ signal (red) and background (blue) candidates for $0 < p_\mathrm{T} < 1\,\mathrm{GeV}/c$. The left plot shows the model output for pp collisions, and the right plot for p–Pb collisions. The shaded regions represent the output of the training sample, and the markers are the results after applying the model on the test sample. | 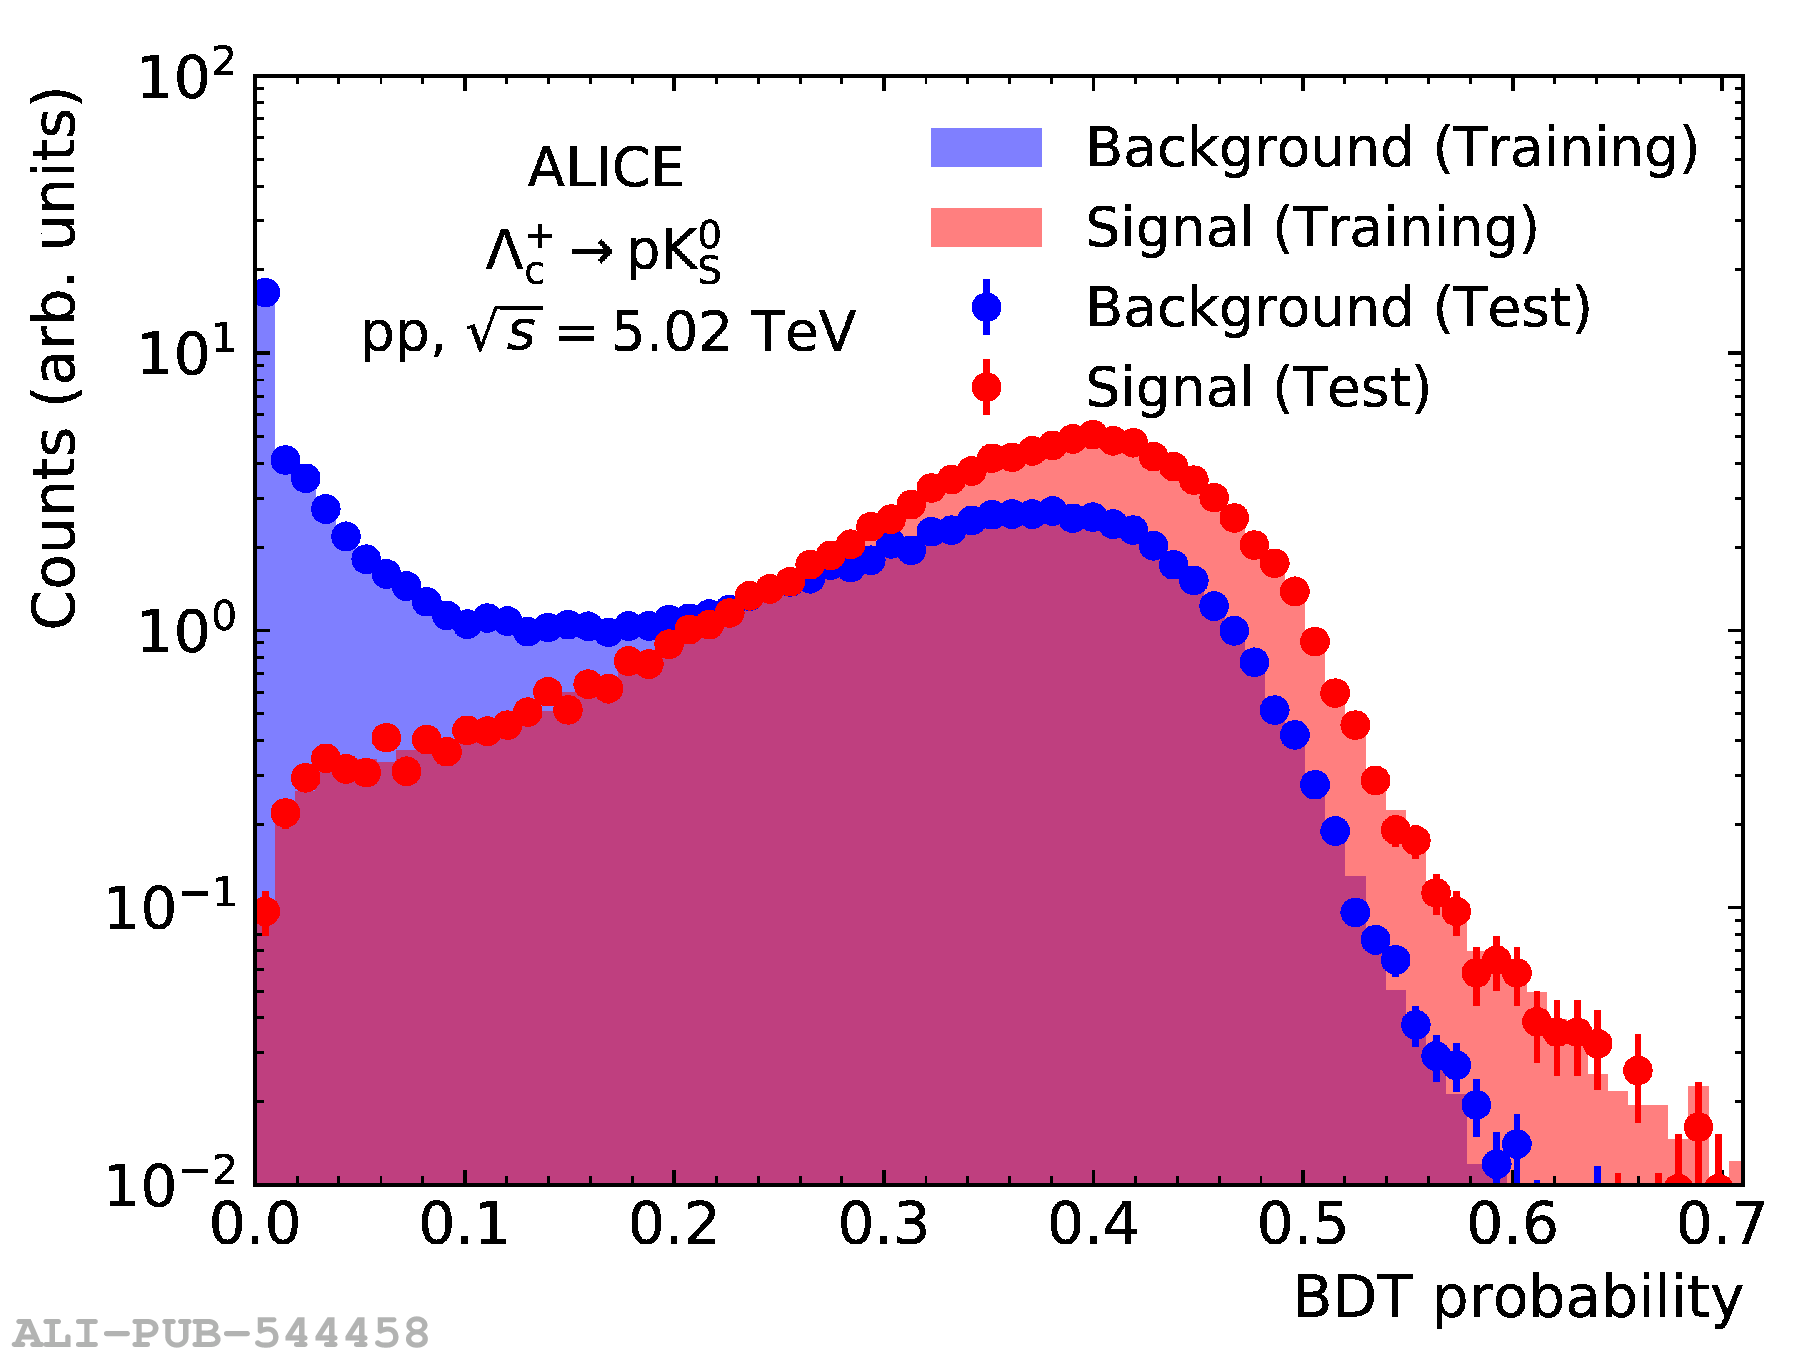 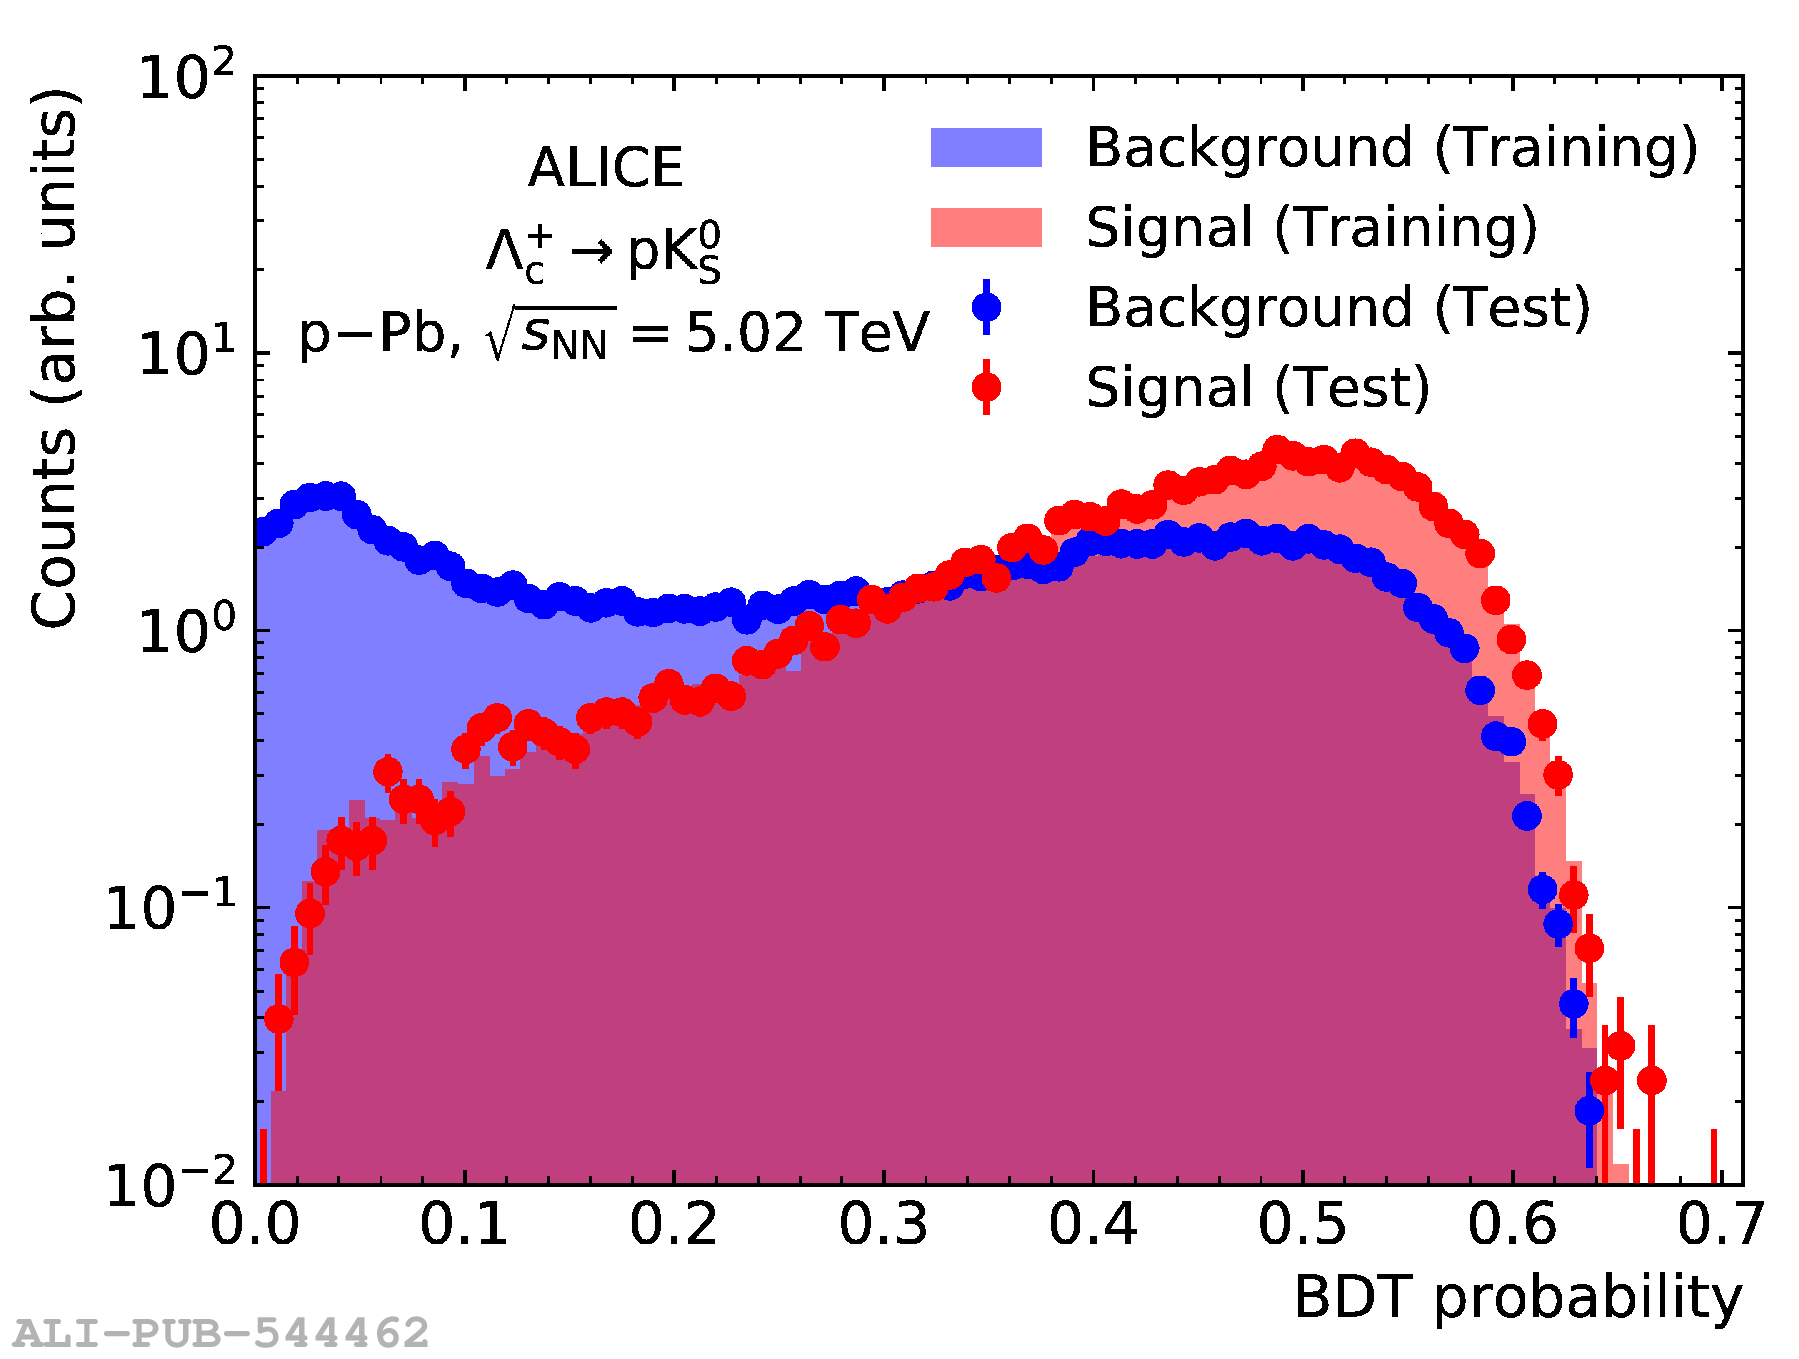 |