Top panels: Transverse momentum spectrum of K*$^0$ (left) and $\phi$ (right) as a function of $p_{\rm T}$ for the NSD events, measured in the rapidity interval $-$0.5 $< y$ $<$ 0 for p$-$Pb collisions at $\sqrt{s_{\rm NN}} = 8.16$ TeV. The statistical and systematic uncertainties are shown as bars and boxes, respectively. The NSD spectrum is compared with the predictions from EPOS-LHC, DPMJET and HIJING. Bottom panels: The ratios of $p_{\rm T}$ spectra from model to data. The shaded bands around unity describe the statistical and systematic uncertainties of the data point. | 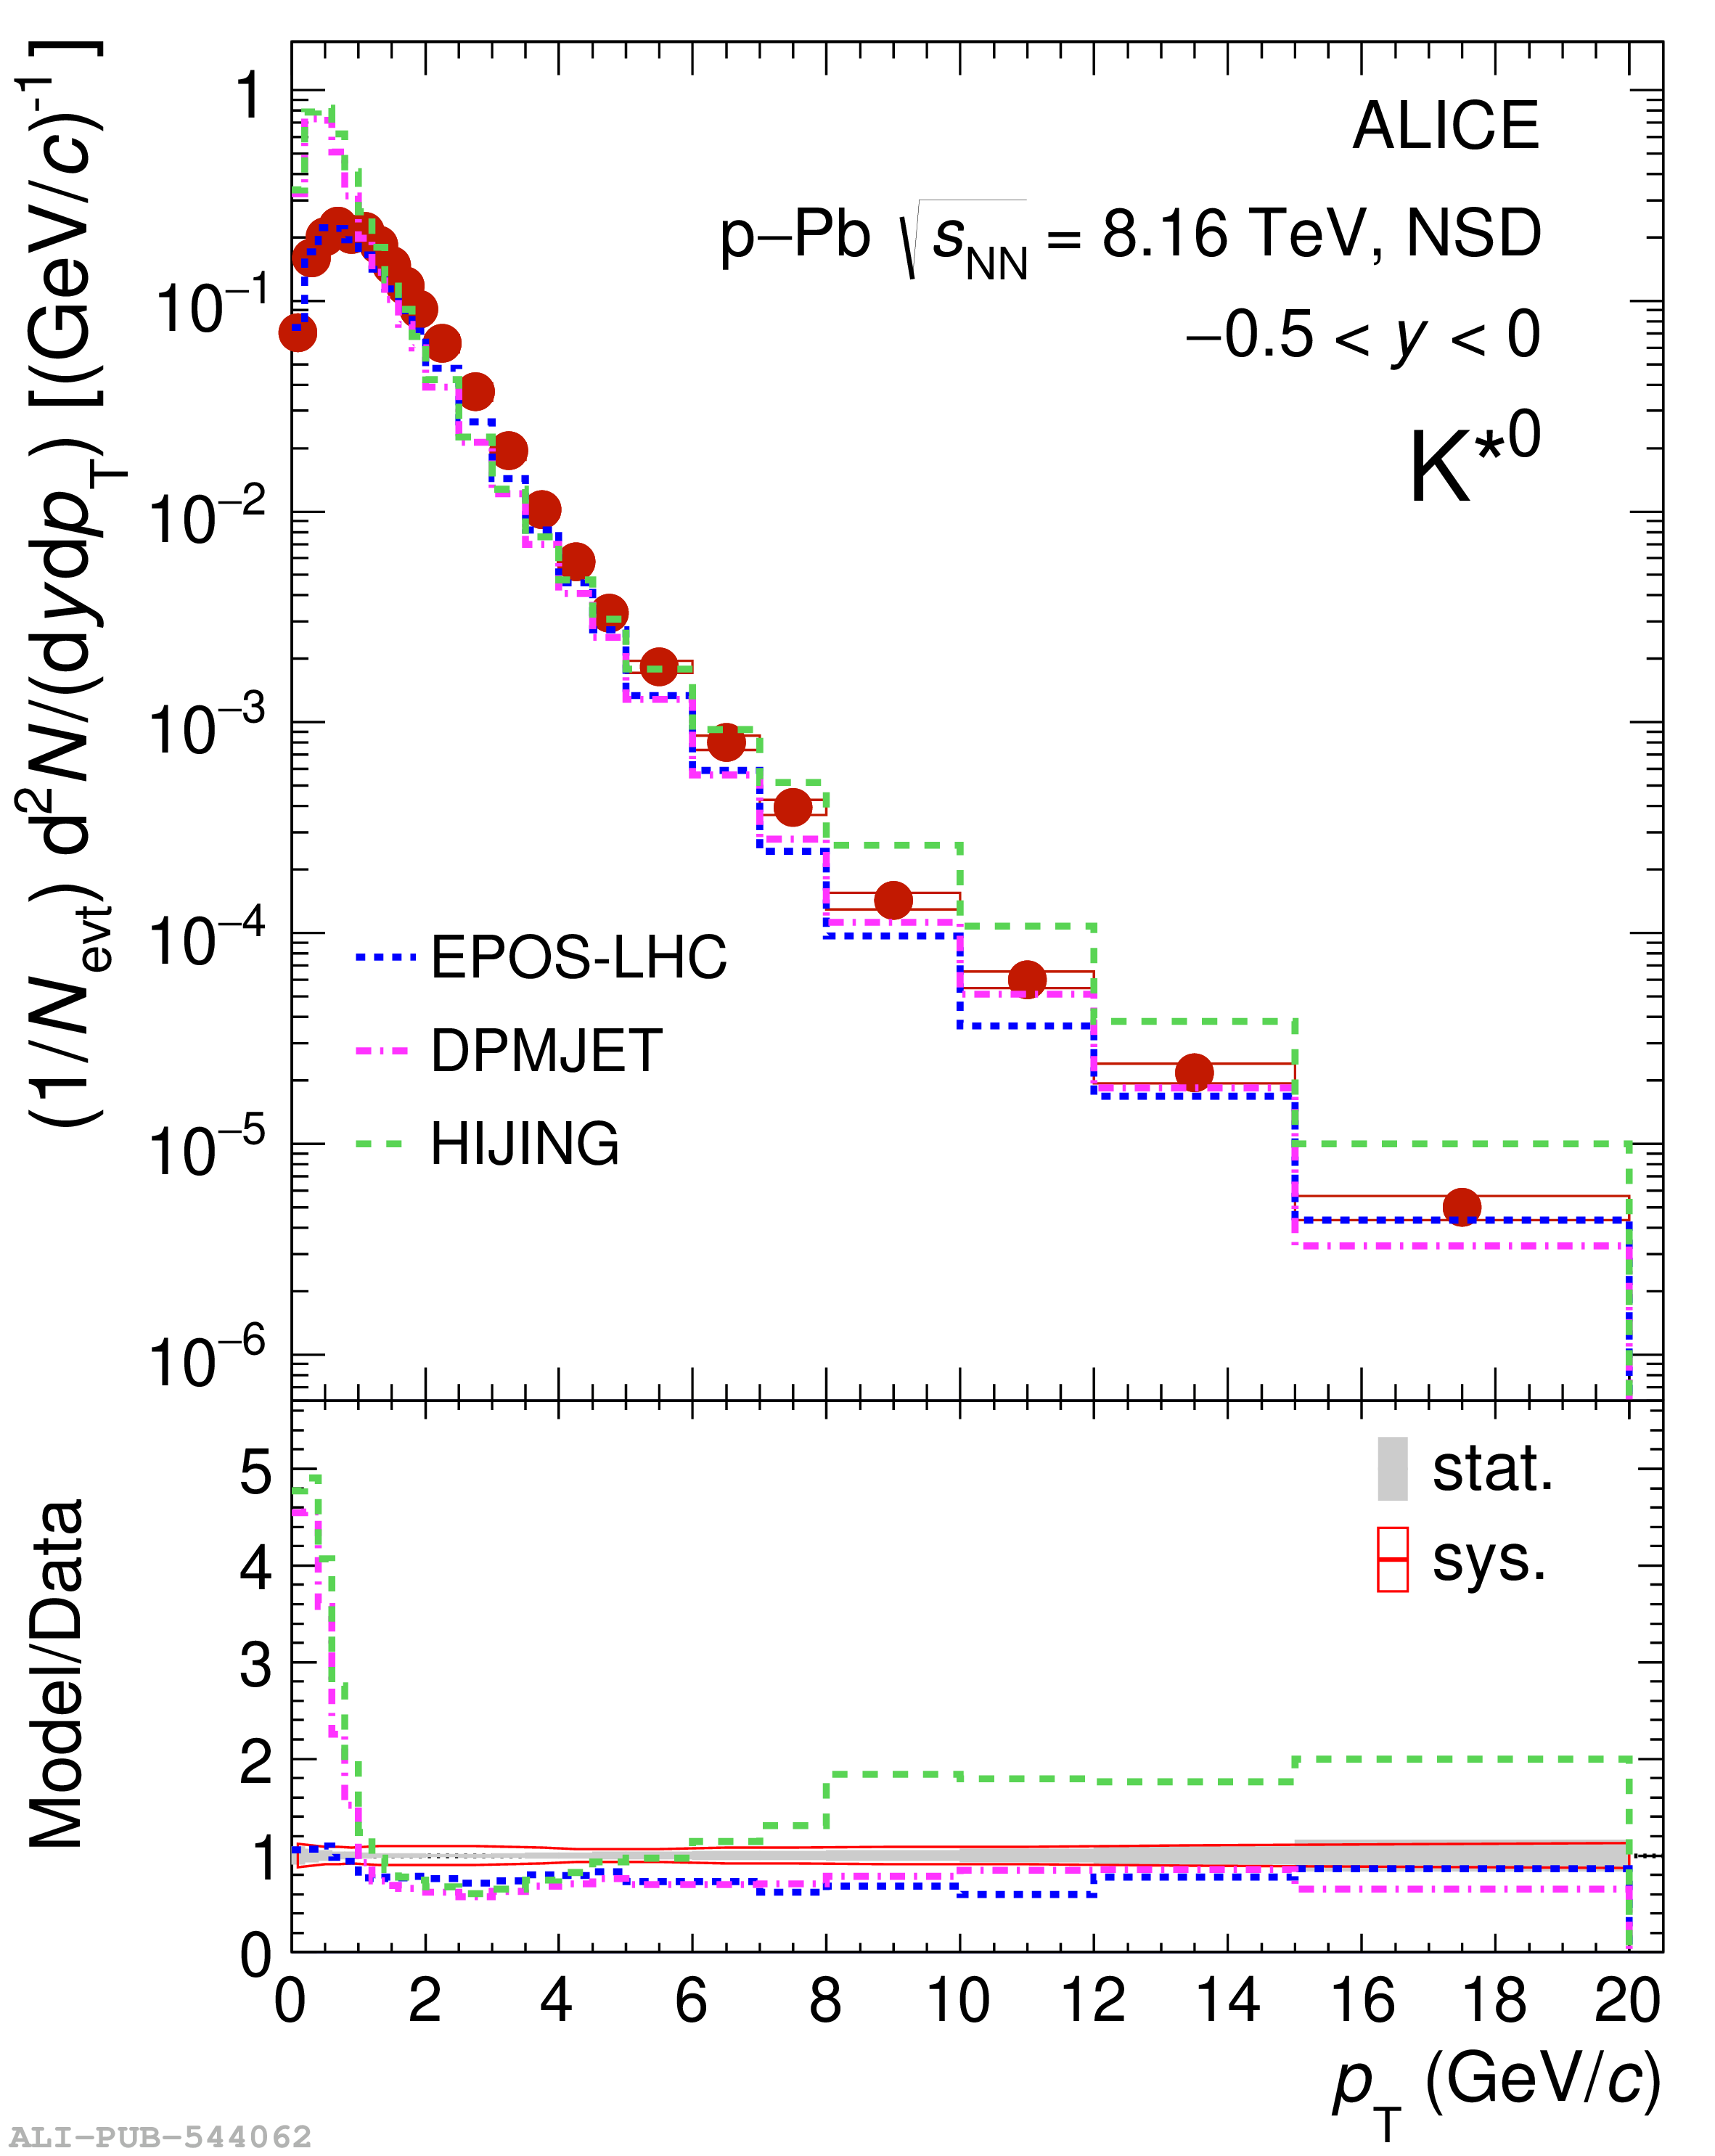 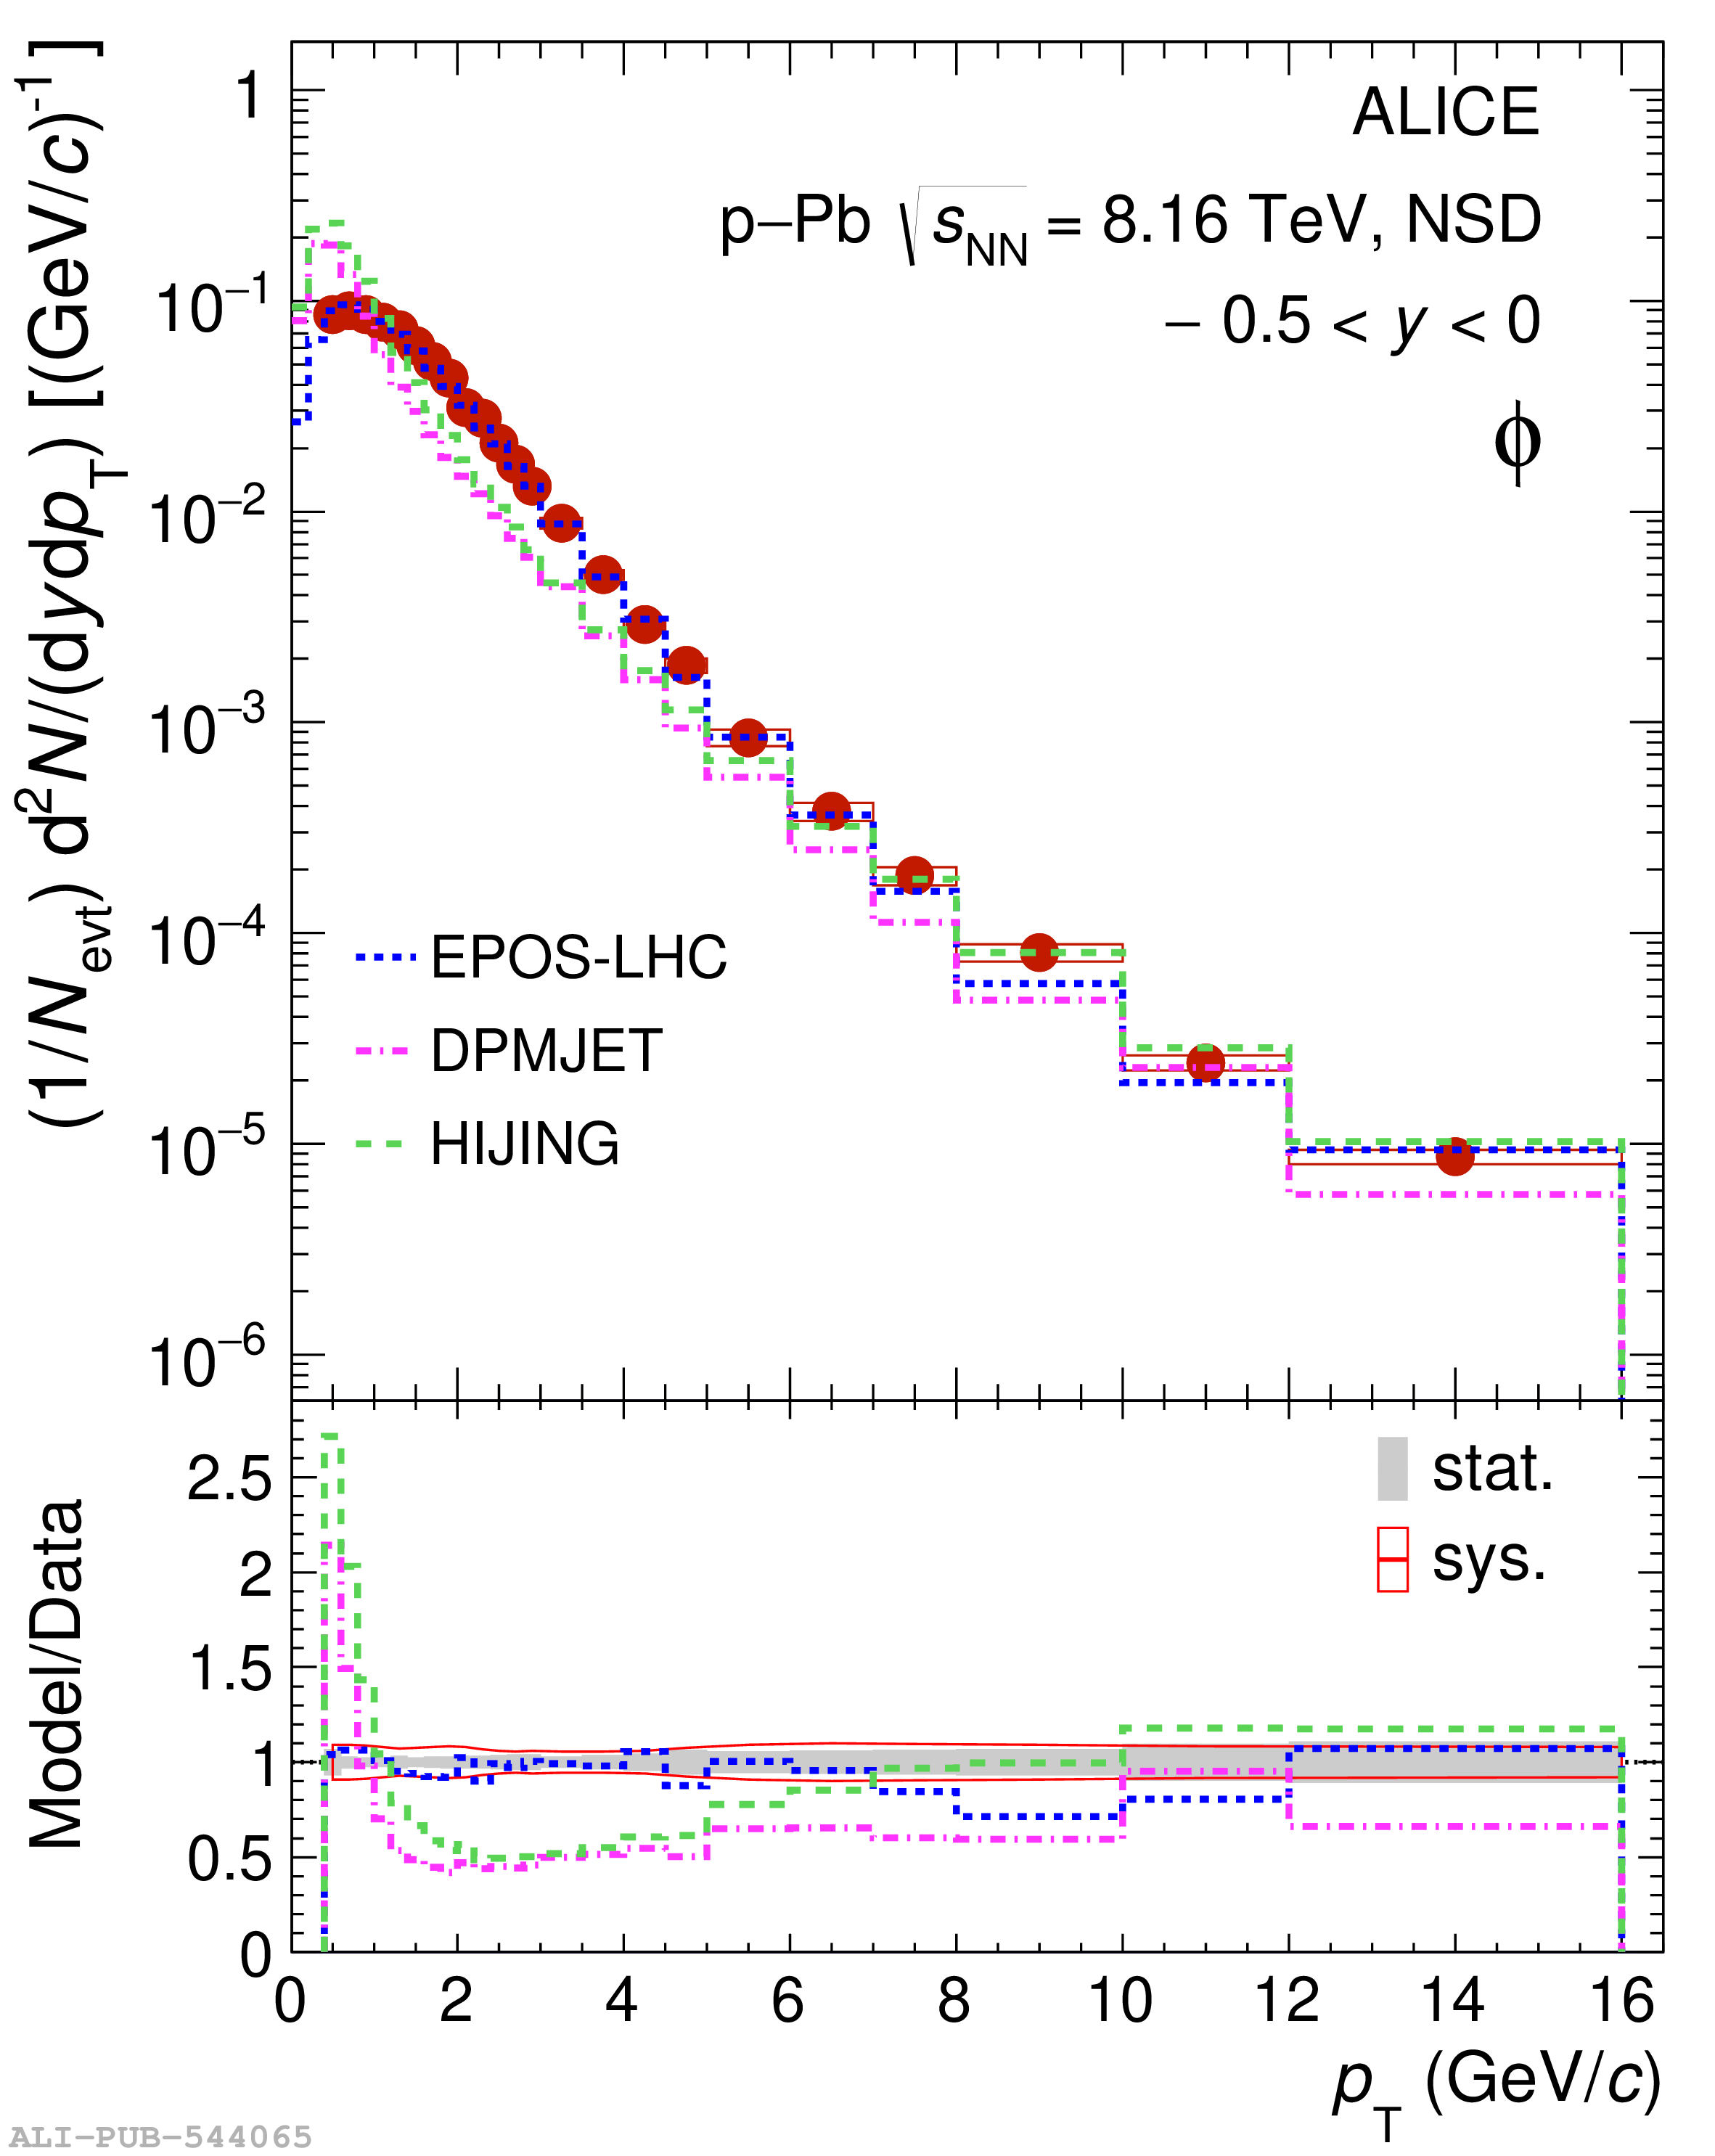 |