Measurements of (anti)deuteron and (anti)$^3$He production in the rapidity range $ |y| <~ $ 0.5 as a function of the transverse momentum and event multiplicity in Xe$-$Xe collisions at a center-of-mass energy per nucleon$-$nucleon pair of $\sqrt{s_{\rm NN}}$ = 5.44 TeV are presented. The coalescence parameters $B_2$ and $B_3$ are measured as a function of the transverse momentum per nucleon. The ratios between (anti)deuteron and (anti)$^3$He yields and those of (anti)protons and pions are reported as a function of the mean charged-particle multiplicity density, and compared with two implementations of the statistical hadronization model and with coalescence predictions. The elliptic flow of (anti)deuterons is measured for the first time in Xe$-$Xe collisions and shows features similar to those already observed in Pb$-$Pb collisions, i.e., the mass ordering at low transverse momentum and the meson$-$baryon grouping at intermediate transverse momentum. The production of nuclei is particularly sensitive to the chemical freeze-out temperature of the system created in the collision, which is extracted from a grand-canonical-ensemble-based thermal fit, performed for the first time including light nuclei along with light-flavor hadrons in Xe$-$Xe collisions. The extracted chemical freeze-out temperature $T_{\rm chem}$ = (154.2 $\pm$ 1.1) MeV in Xe$-$Xe collisions is similar to that observed in Pb$-$Pb collisions and close to the crossover temperature predicted by lattice quantum chromodynamics calculations.
Phys. Rev. C 110 (2024) 064901
HEP Data
e-Print: arXiv:2405.19826 | PDF | inSPIRE
CERN-EP-2024-144
Figure group
Figure 1
Distribution of the $\left(\mathrm{d}E/\mathrm{d}x-\langle\mathrm{d}E/\mathrm{d}x\rangle_{\rm ^{3}He}\right)/\sigma^{\rm ^{3}He}_{\mathrm{d}E/\mathrm{d}x}$ method used to extract the signal of $^3\overline{\rm{He}}$ (left), and distribution of $(\Delta t - \Delta t_{\rm d}^{\rm exp})/\sigma_{\rm TOF}$ used to extract the signal of $\overline{\rm{d}}$ (right). The regions highlighted in green represent the regions of the signal integration, different for the two signal extraction methods. | 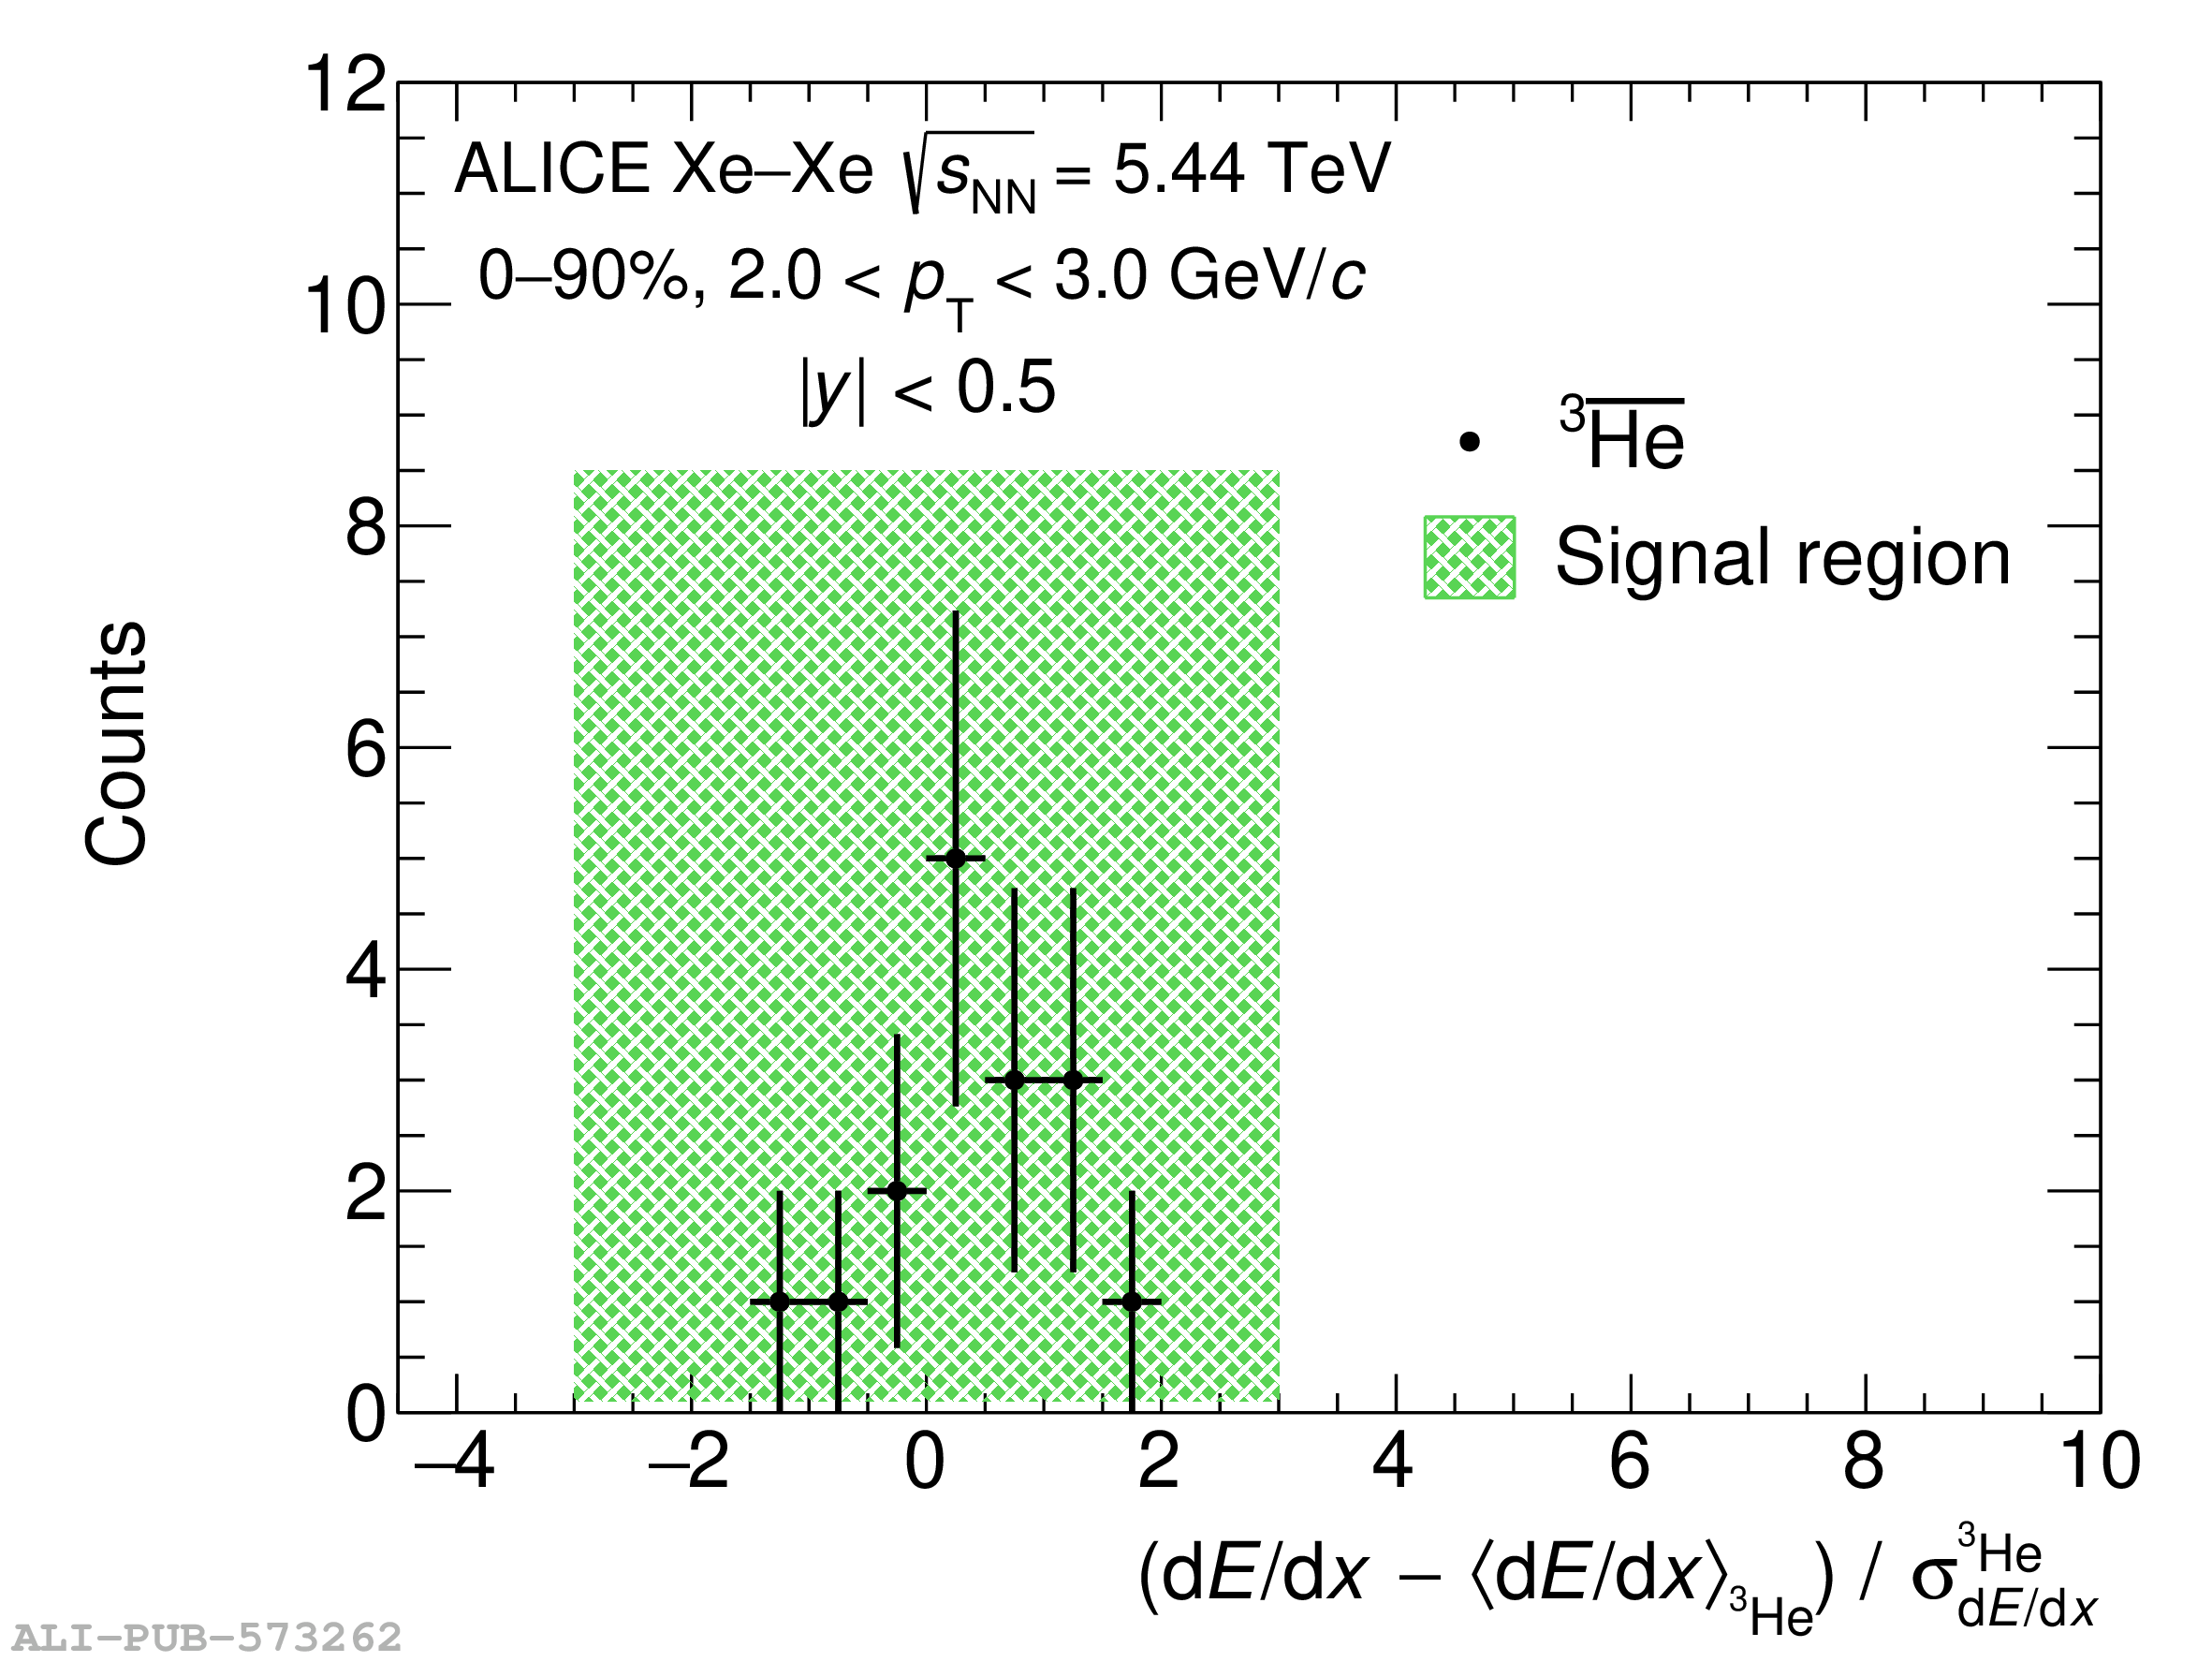 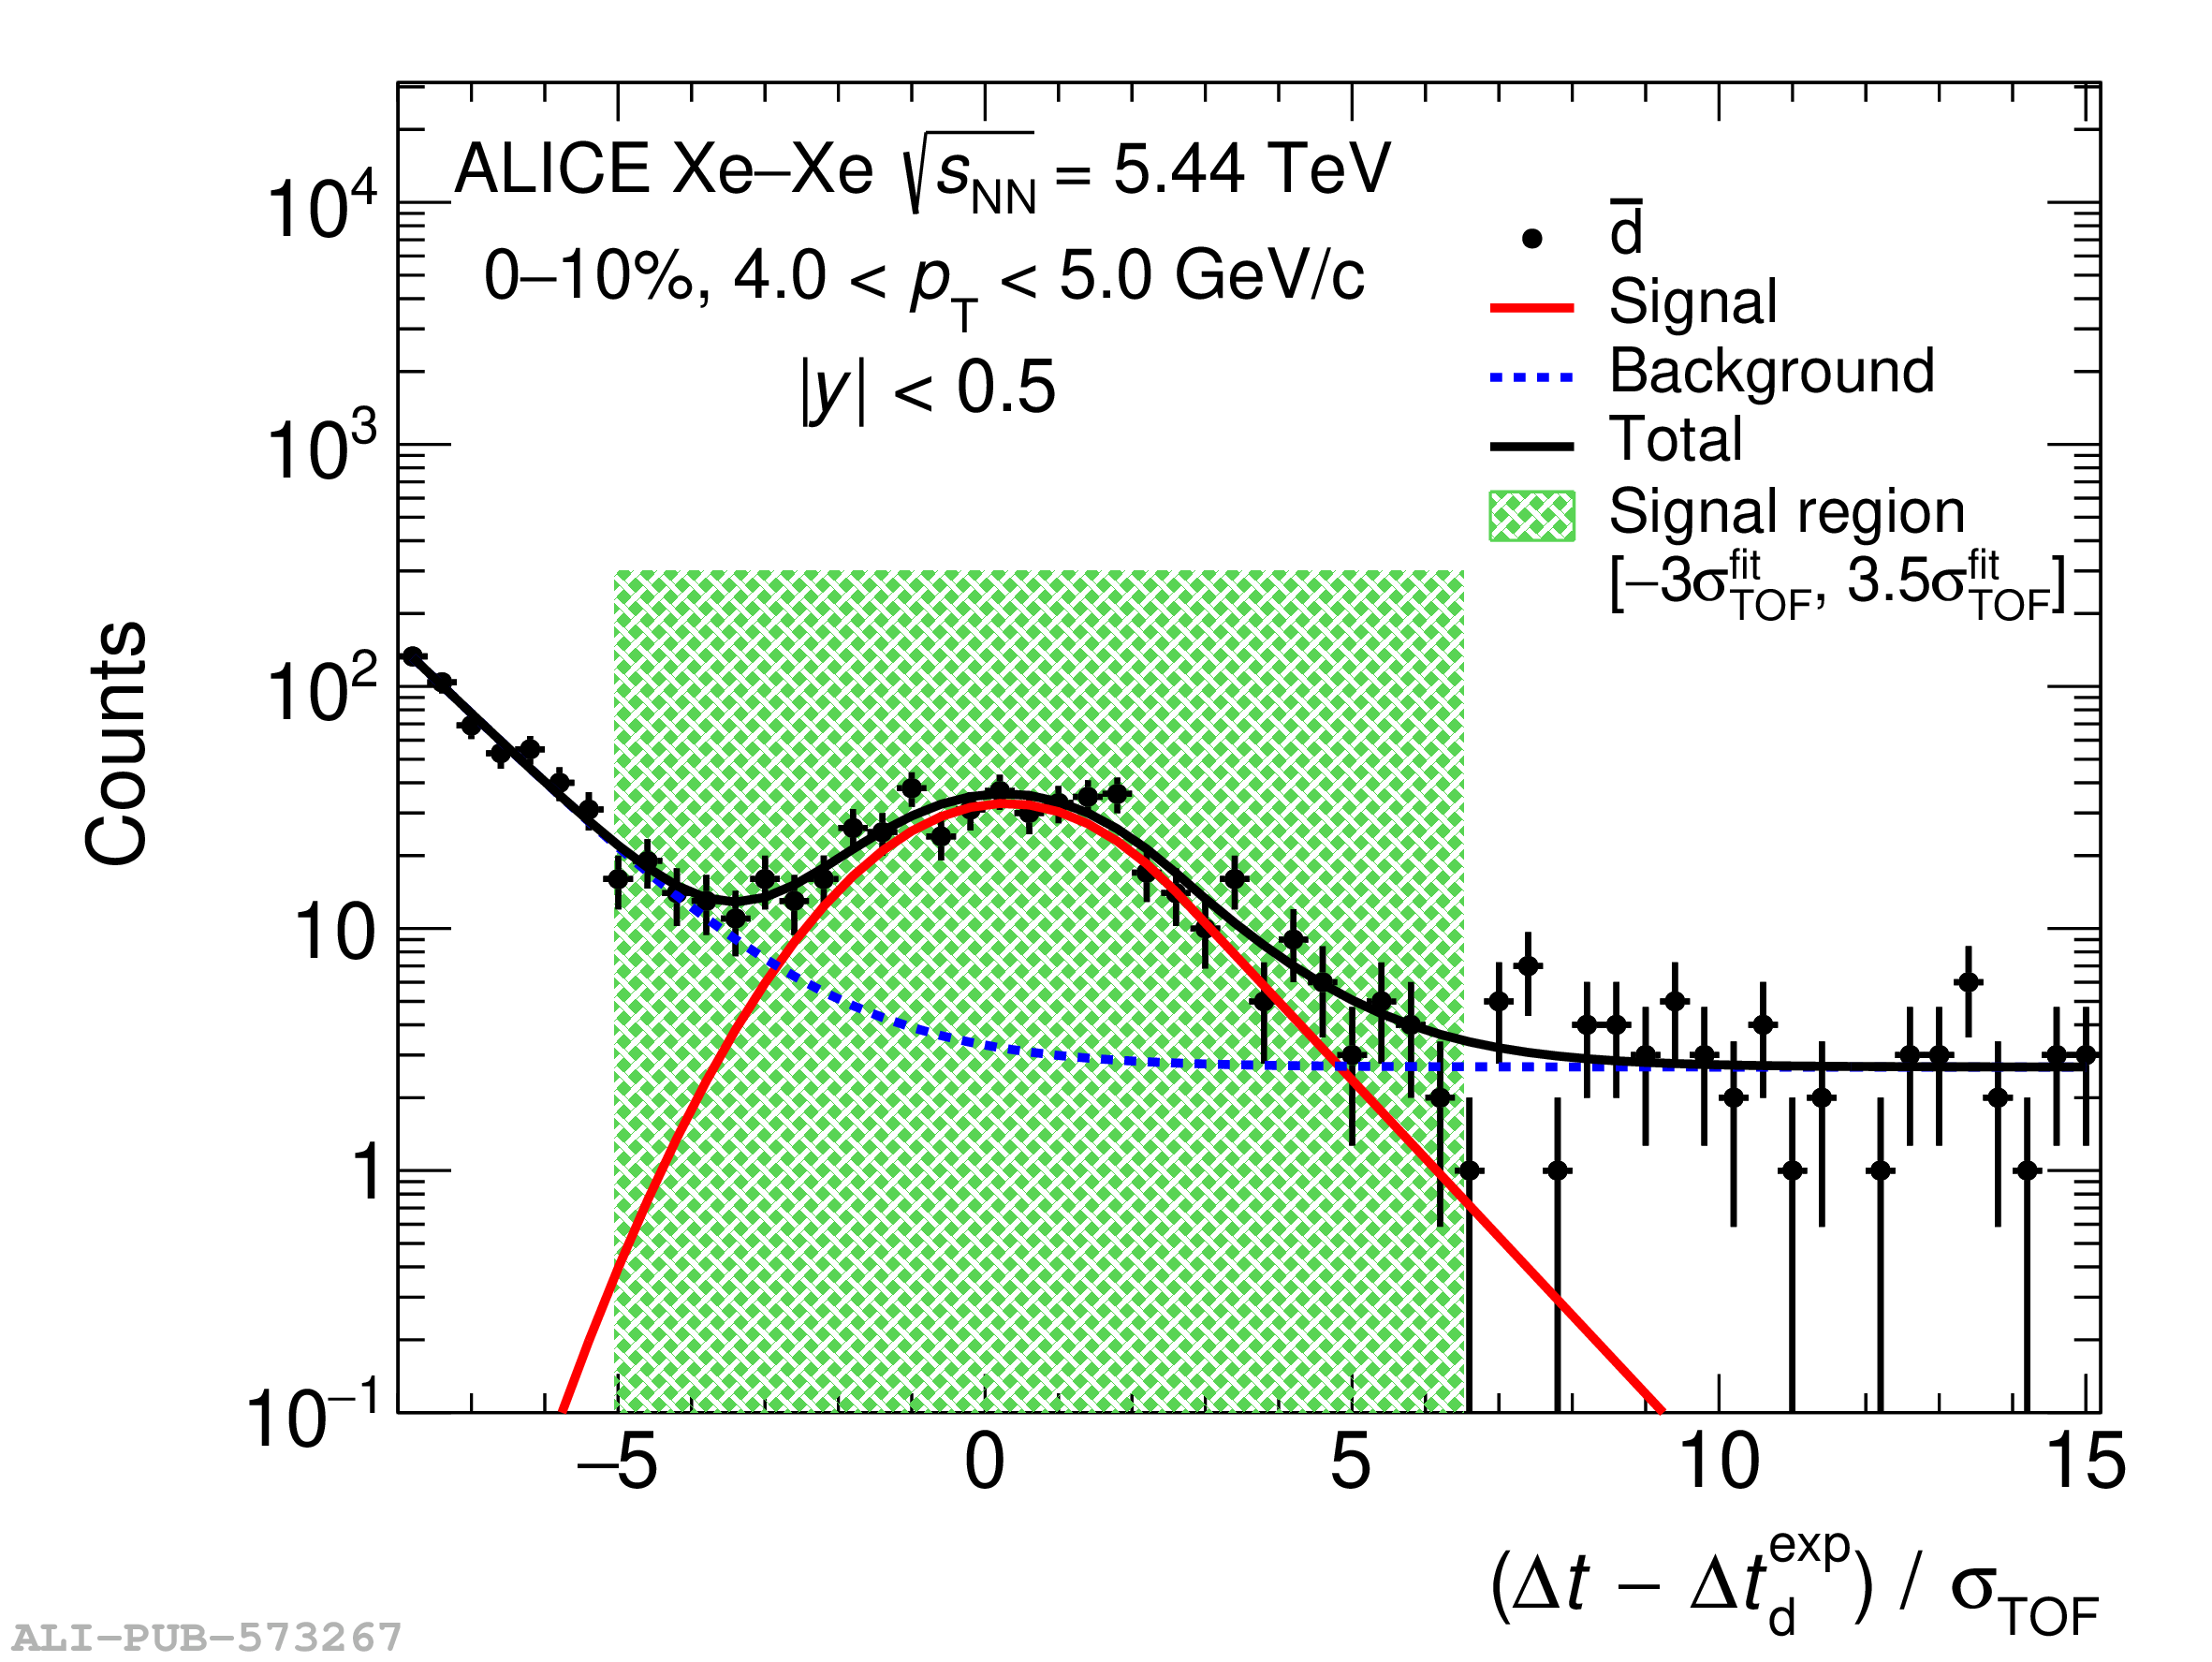 |
Figure 2
The $\Delta M$ distribution (left) and the extracted $v_2$ (right) of deuteron candidates as a function of $\Delta M$ for $0.8 $ $< p_{\rm T}$ $< 1.6$ GeV/$c$ in the centrality interval 0$-$20$\%$ in Xe$-$Xe collisions. The statistical uncertainties on the data points are represented by bars. The measurement is carried out at midrapidity, i.e., $\left|y\right|< 0.5$. |  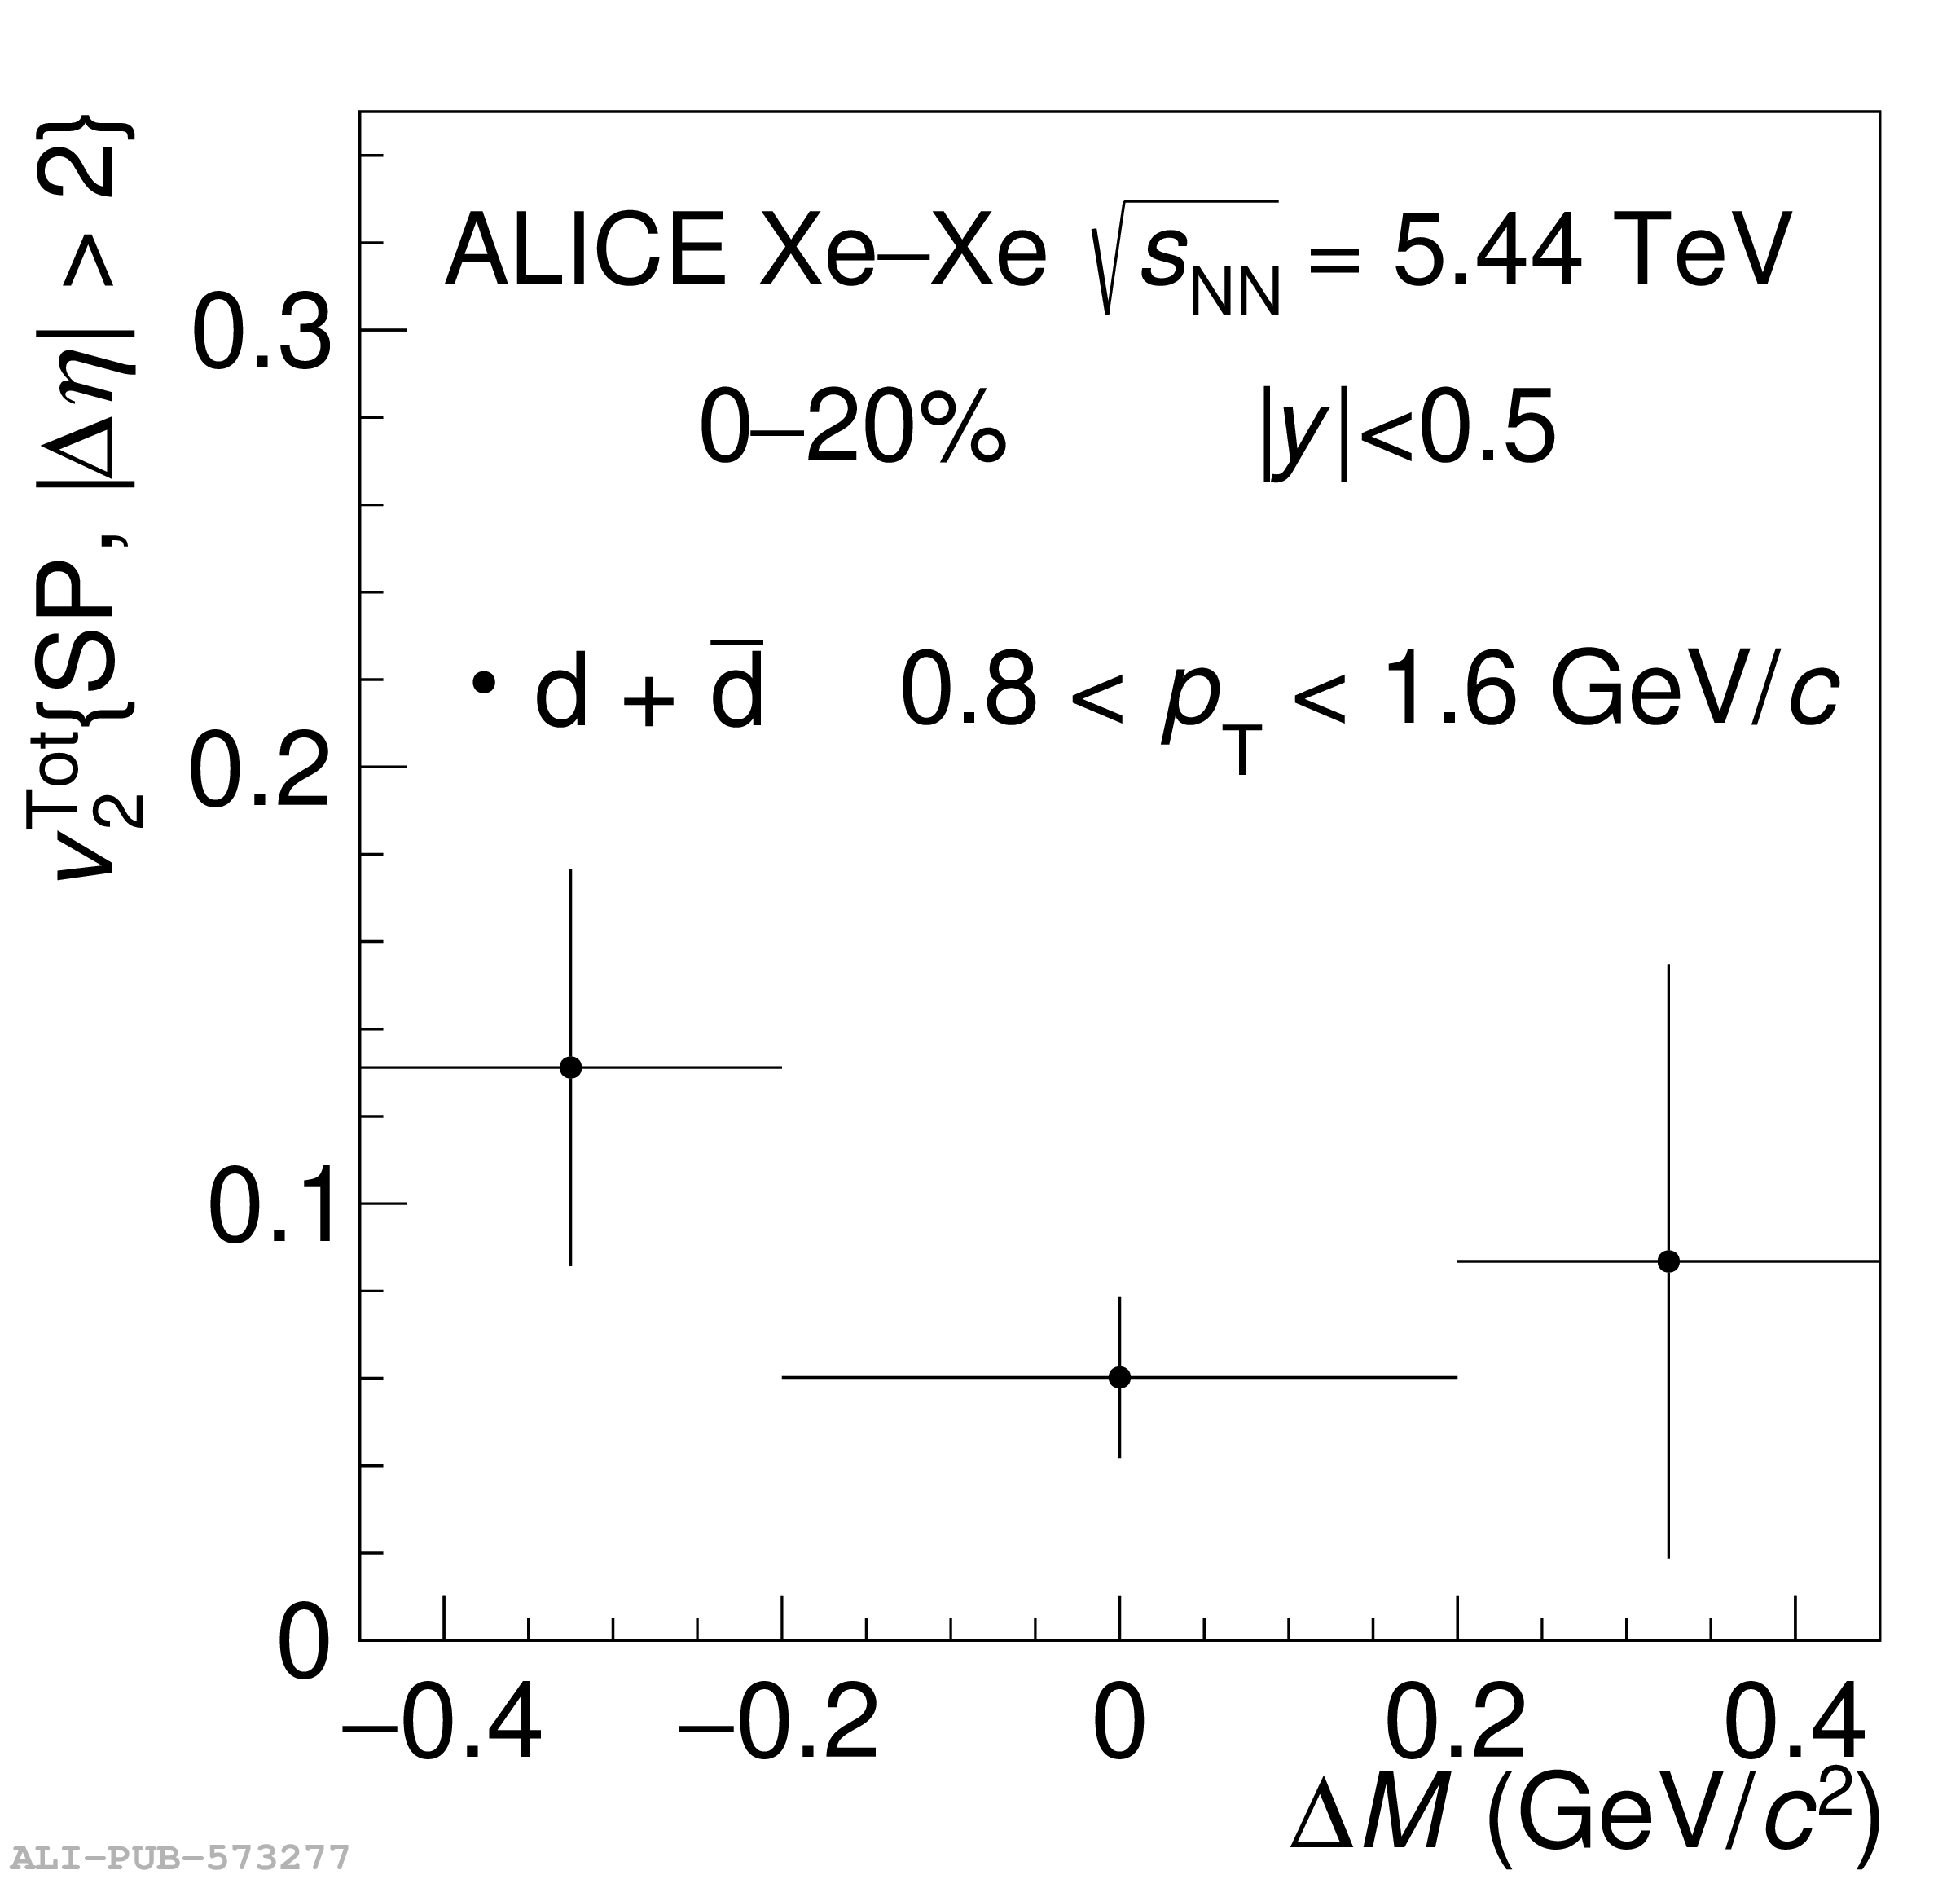 |
Figure 3
Transverse-momentum differential yields of the average of deuterons and antideuterons in different centrality classes (left panel), and of the average of $^3\mathrm{He}$ and $^3\overline{\mathrm{He}}$ (right panel) in the centrality class (0$-$90$\%$). Dotted lines show the Blast-Wave individual fit to the $p_{\rm T}$ spectra. Statistical and systematic uncertainties are shown as vertical bars and boxes, respectively. | 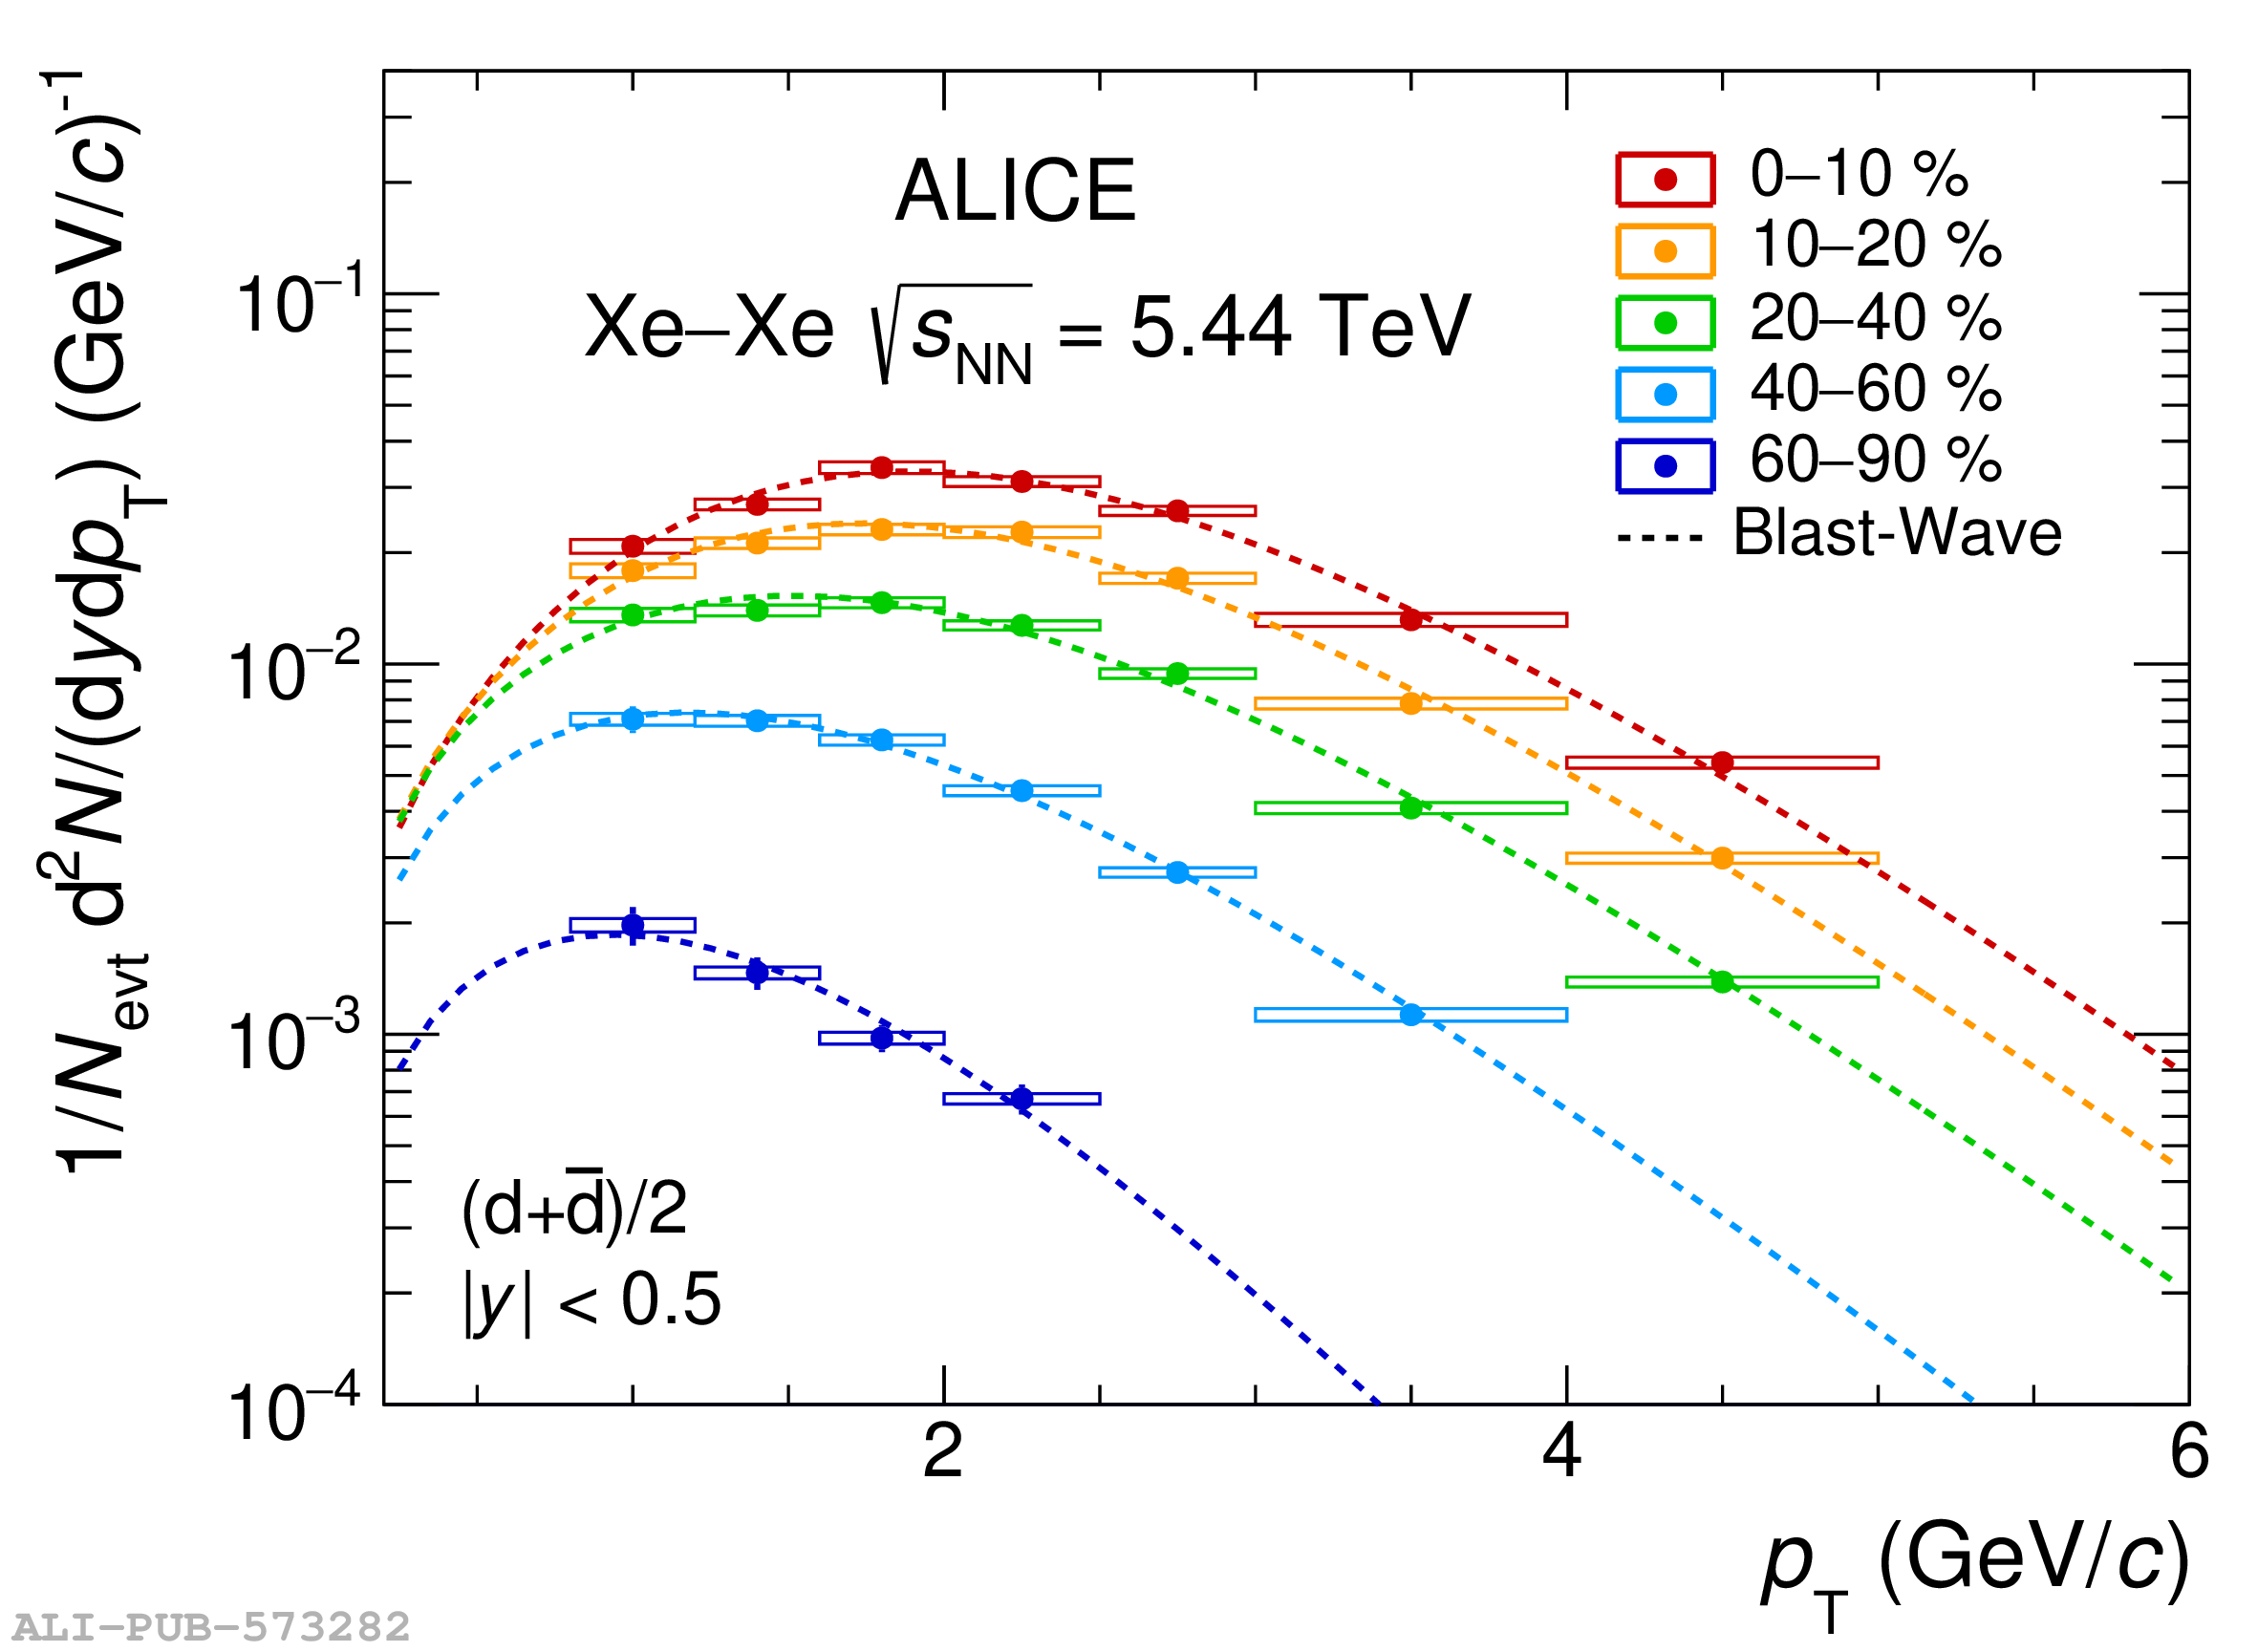  |
Figure 4
Deuteron-to-proton (top panel) and $^3$He-to-proton (bottom panel) yield ratios as a function of the average charged-particle multiplicity density. All yields are measured at midrapidity, i.e., $\left|y\right|< $ 0.5 for pp, Xe$-$Xe and Pb$-$Pb collisions, and $-1< \left|y\right|< 0$ for p$-$Pb collisions. Statistical uncertainties are shown as vertical lines, whereas systematic ones are shown as boxes. The coalescence predictions are shown as bands, whose width represents the model uncertainty. The black and green lines correspond to the expectations of two different hypotheses of the CSM. | 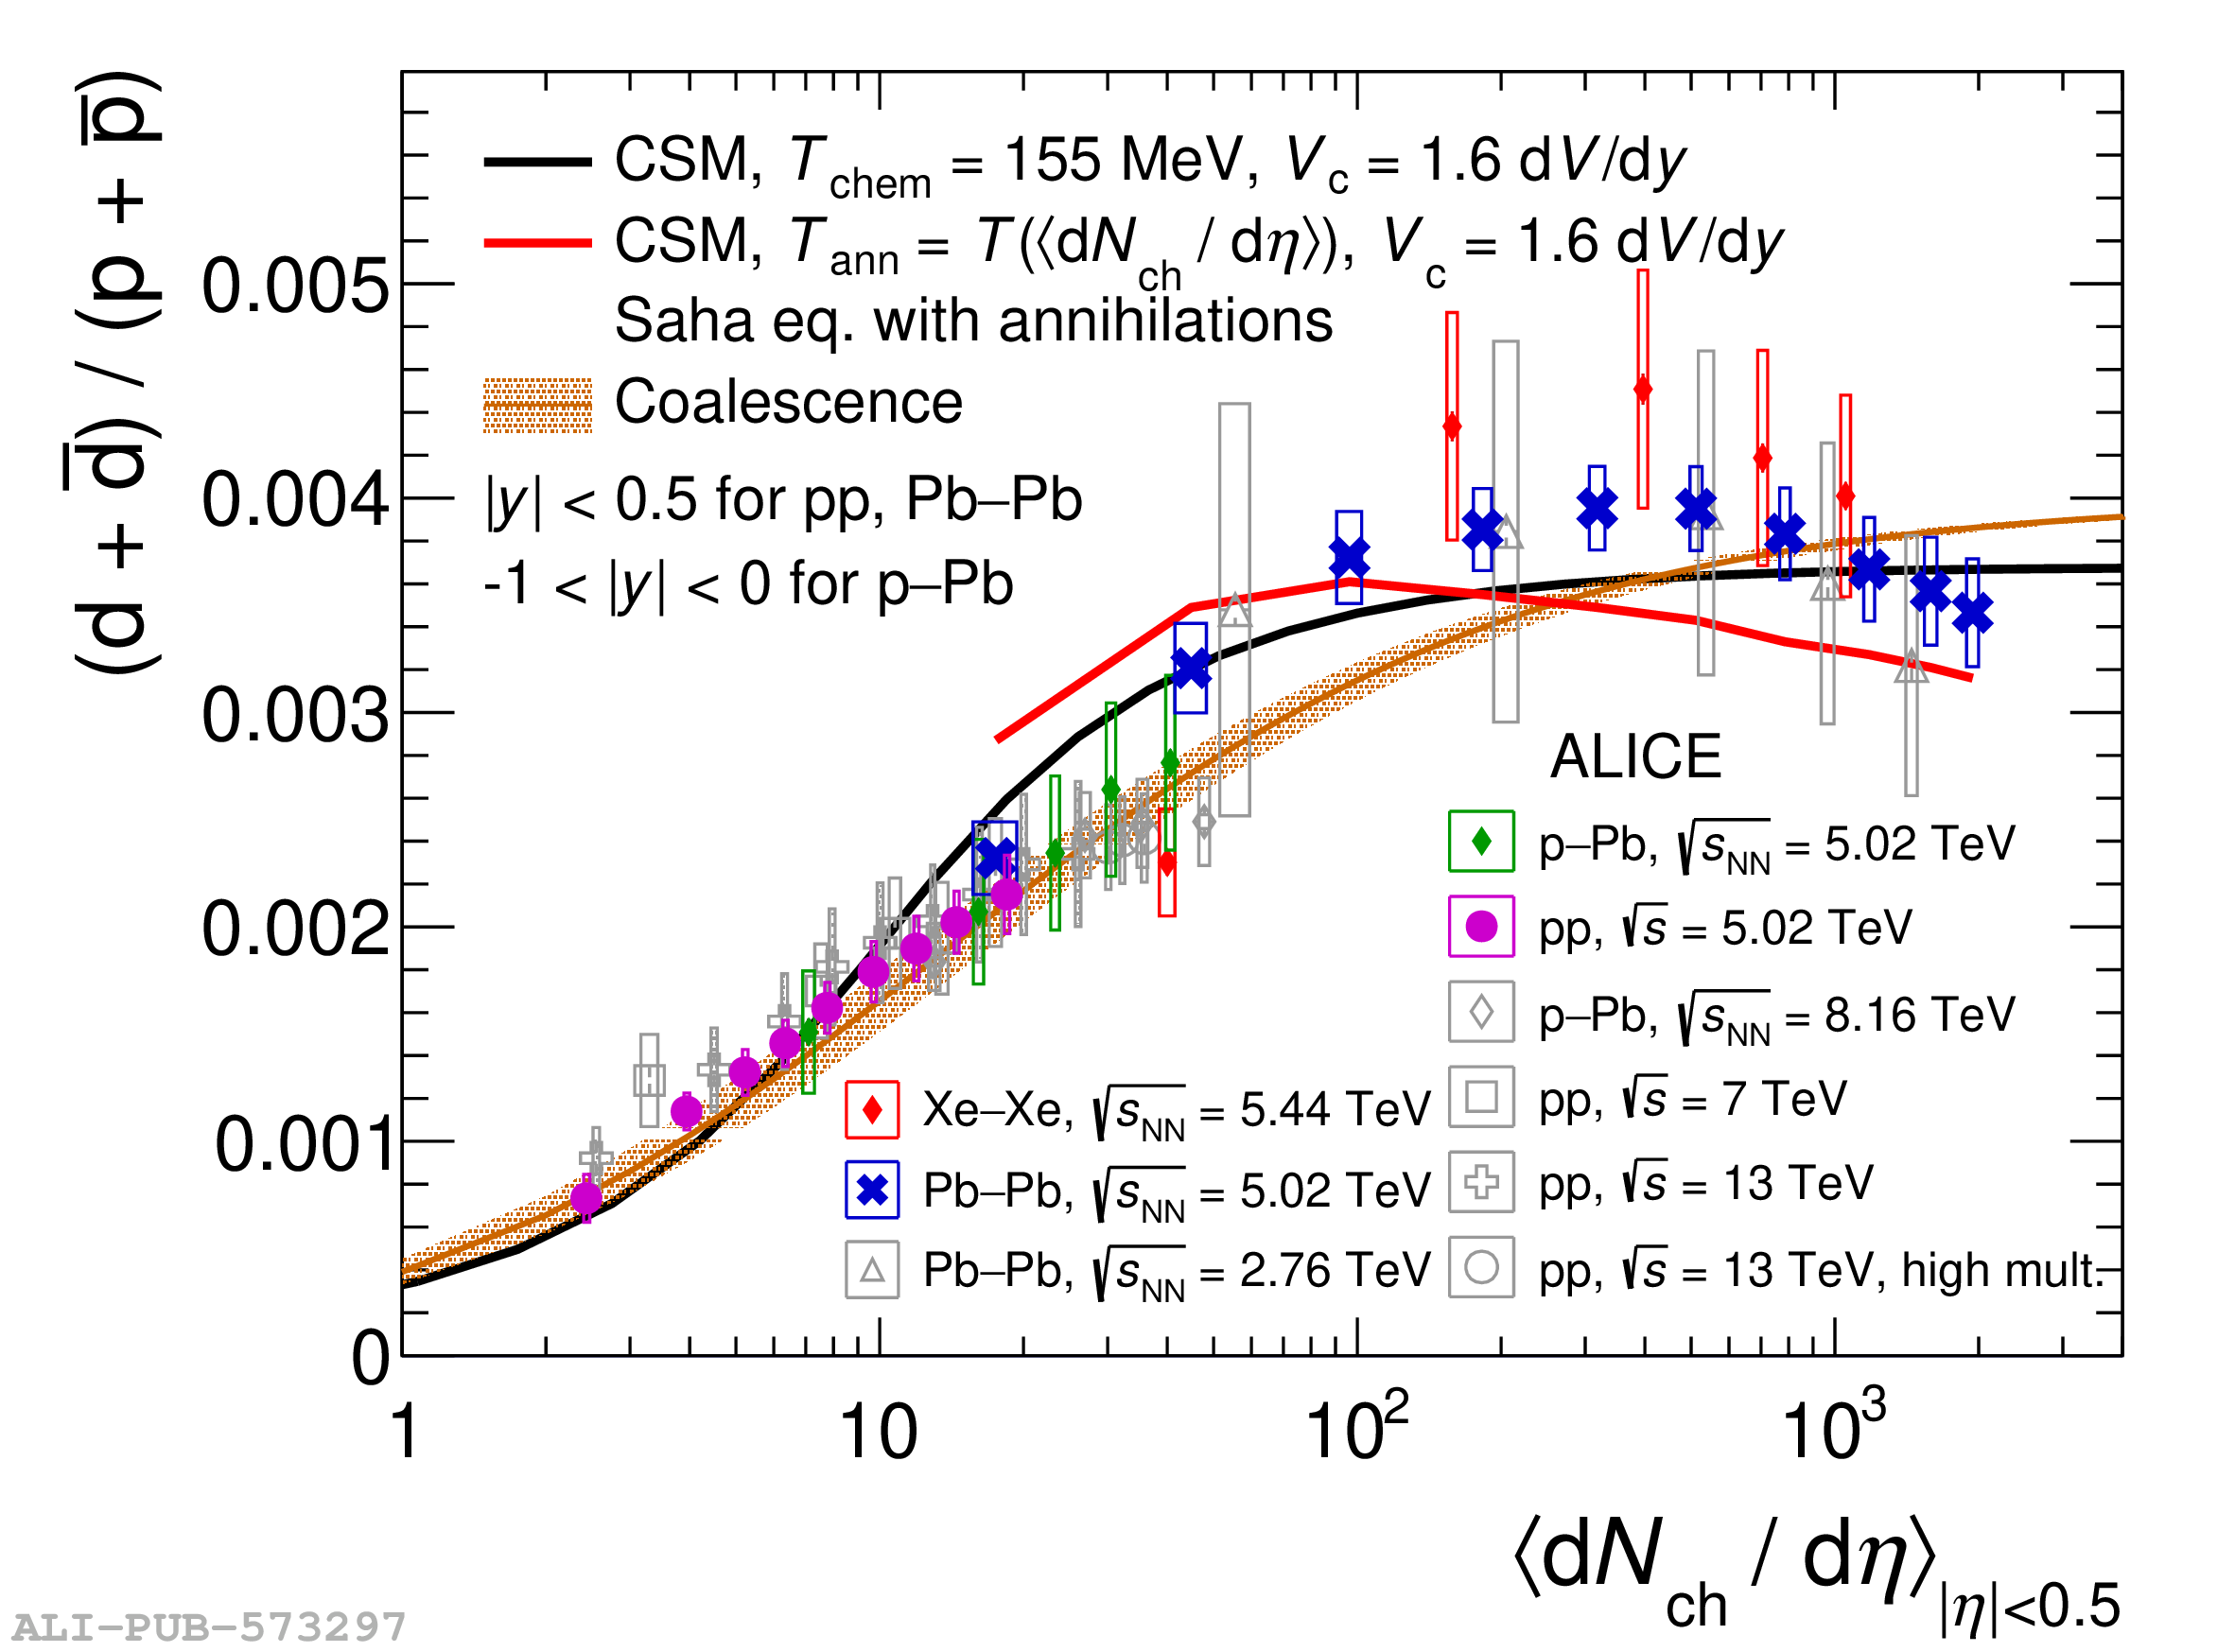  |
Figure 5
Deuteron-to-pion (top panel), and $^3$He-to-pion (bottom panel) yield ratios as a function of the charged-particle multiplicity density. All yields are measured at midrapidity, i.e., $\left|y\right|< $ 0.5 for pp, Xe$-$Xe and Pb$-$Pb collisions, and $-1< \left|y\right|< 0$ for p$-$Pb collisions. Lines represent statistical uncertainties, whereas boxes show systematic ones. The solid lines correspond to the expectations of two implementations of the CSM, see text for details. | 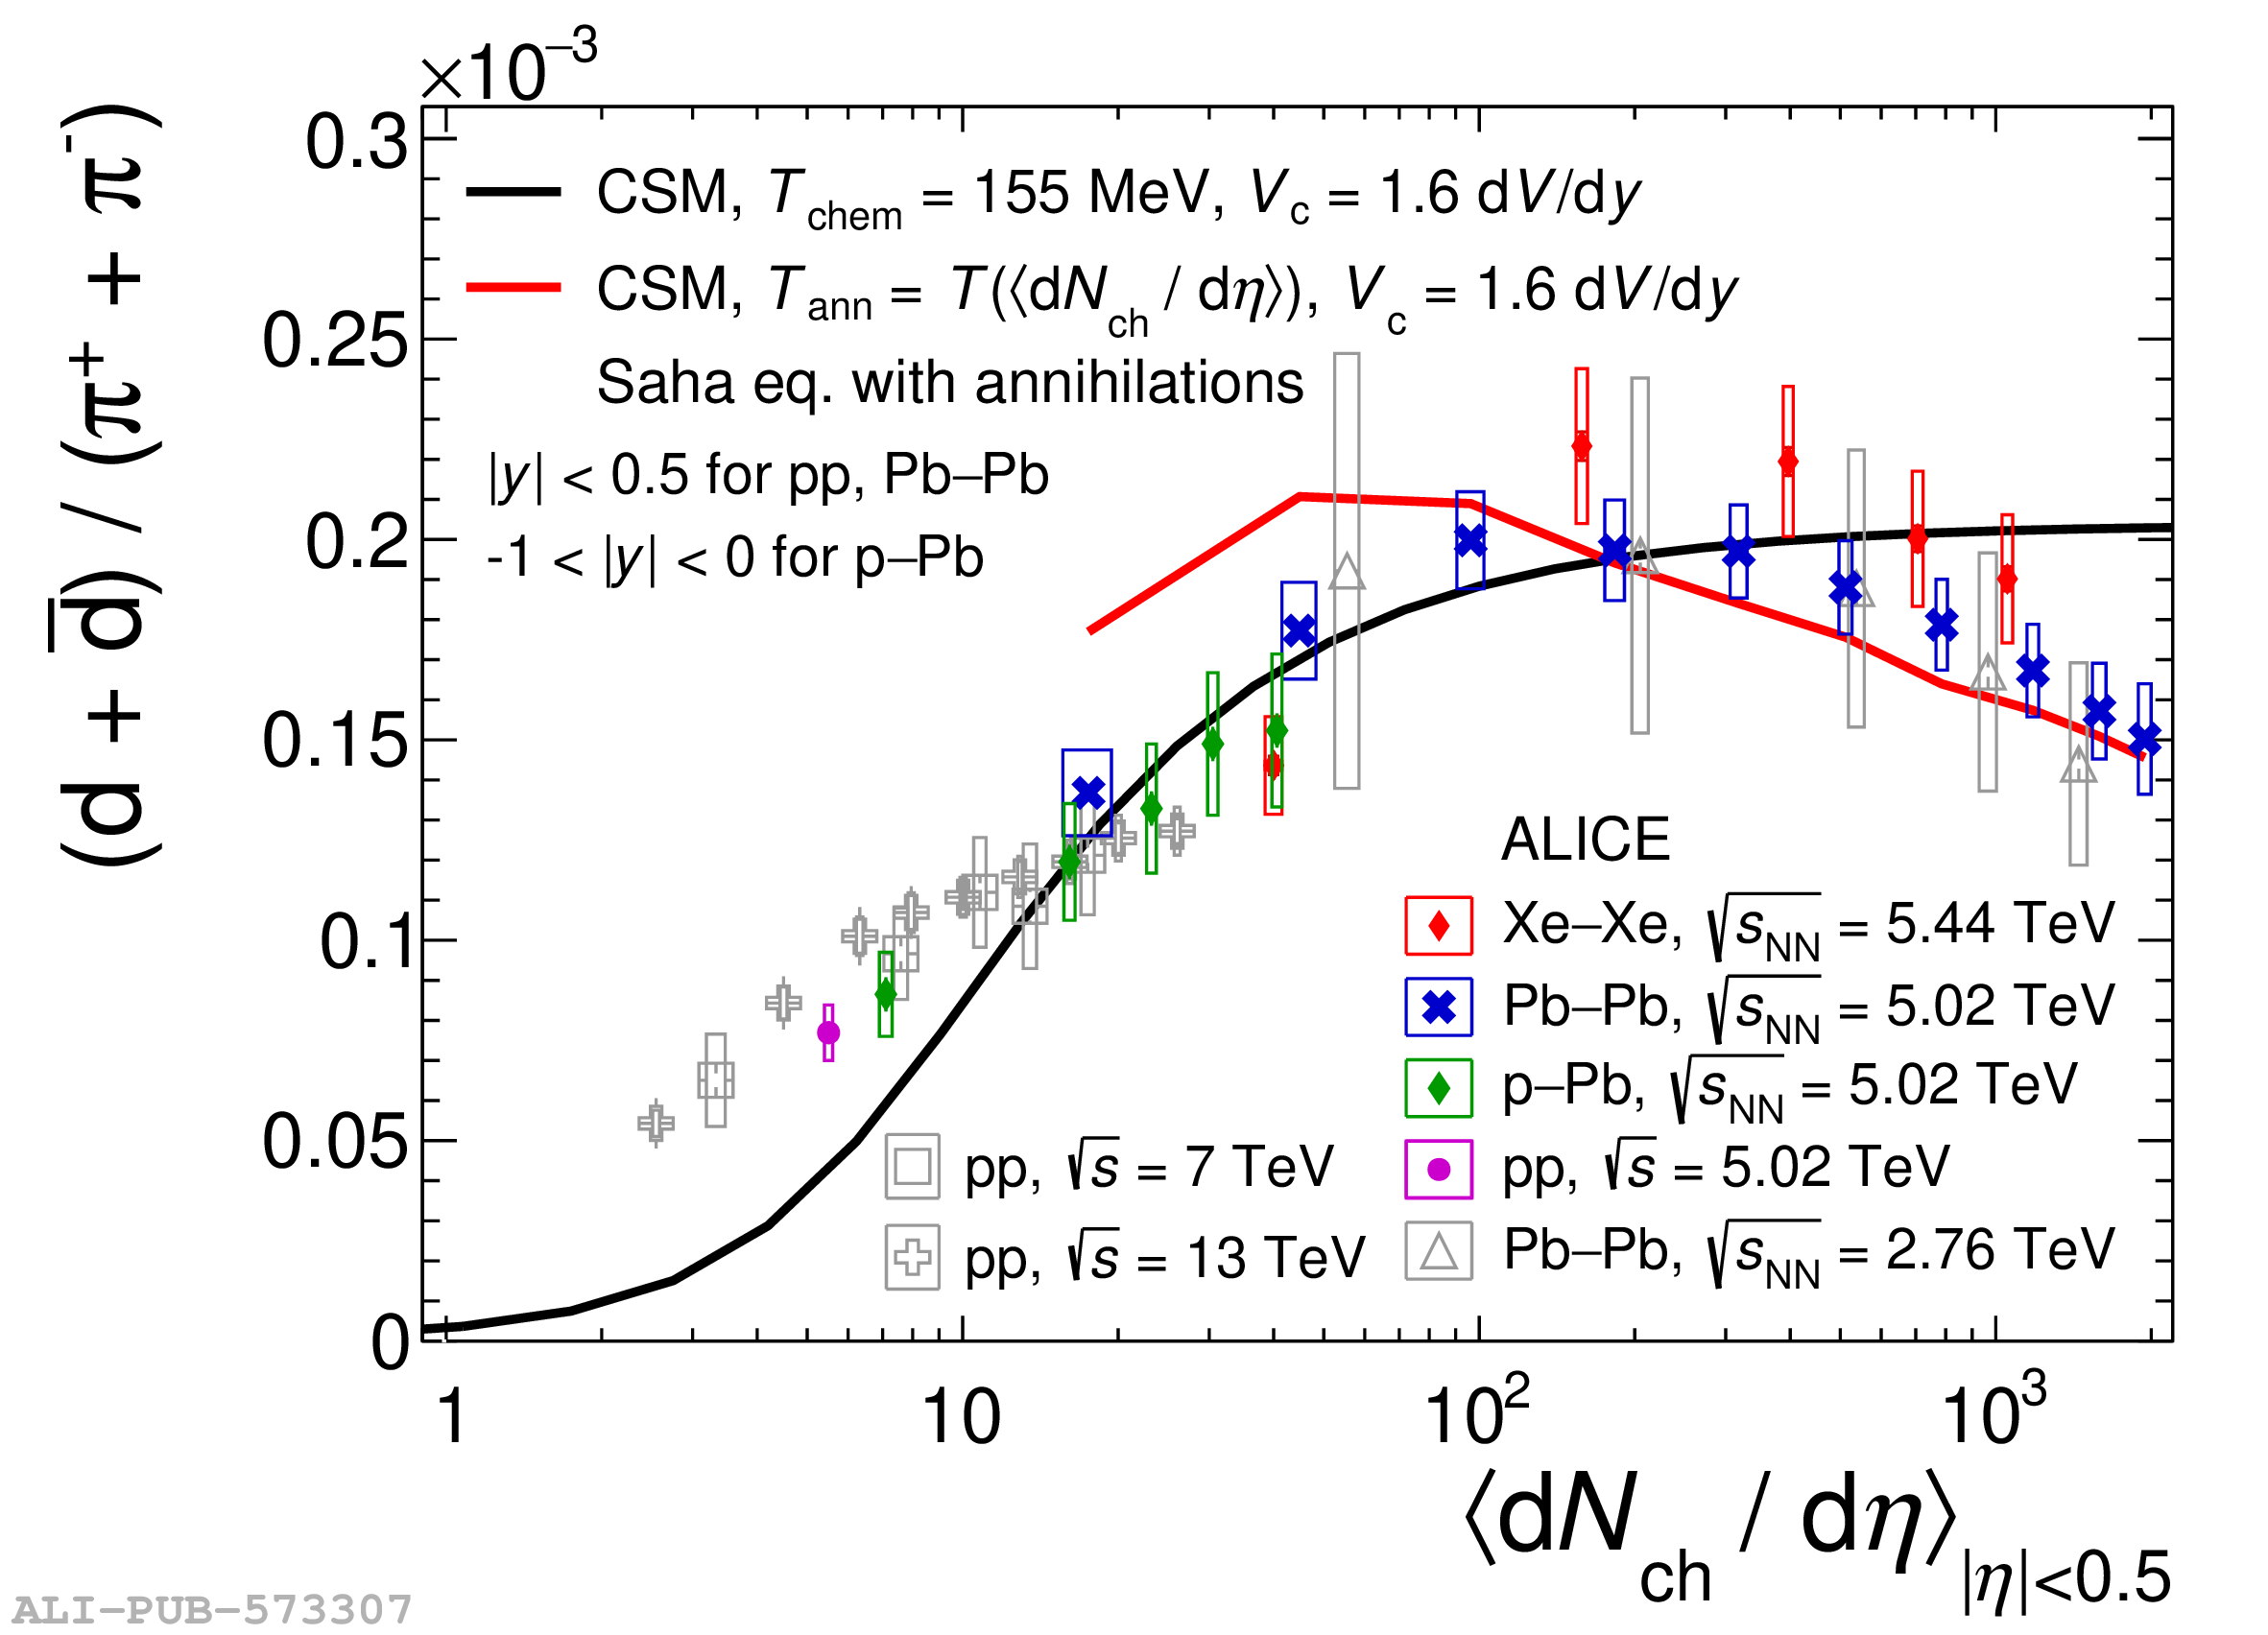  |


Figure 7
(Anti)deuteron $v_2$ measured at $|y| < 0.5$ in the centrality classes 0$-$20$\%$ (left) and 20$-$40$\%$ (right) in comparison with the Blast-Wave predictions obtained from simultaneous fits of the $p_{\rm T}$ spectra and $v_2$ of pions, kaons, and protons. Statistical and systematic uncertainties are represented by bars and boxes, respectively. |  |
Figure 8
(Anti)deuteron $v_2$ measured in the centrality classes 0$-$20$\%$ (left) and 20$-$40$\%$ (right) in comparison with the coalescence predictions based on the mass-number scaling. Statistical and systematic uncertainties are shown as bars and boxes, respectively. The flow of deuterons is measured at midrapidity, i.e., $\left|y\right|< $ 0.5. |  |
Figure 9
Thermal fit to the measured hadron yields in Xe$-$Xe collisions at $\sqrt{s_{\rm NN}}$ = 5.44 TeV, performed with two different implementations of the statistical hadronization model, namely the Thermal-FIST and the GSI-Heidelberg model . The yields shown for each given species are the average of the particle and antiparticle yields. In the bottom panel, the ratios of data to the model calculations are shown. |  |