Projections of the coherent J/$\psi$ data points in (a) $\cos\theta$ and (b) $\varphi$, for events in the $-4 < y < -2.5$ rapidity interval. The curves are obtained by setting the lambda parameters in Eq. 2 to the results of the fit to the distribution shown in Fig. 2. The uncertainties on the data points are statistical. | 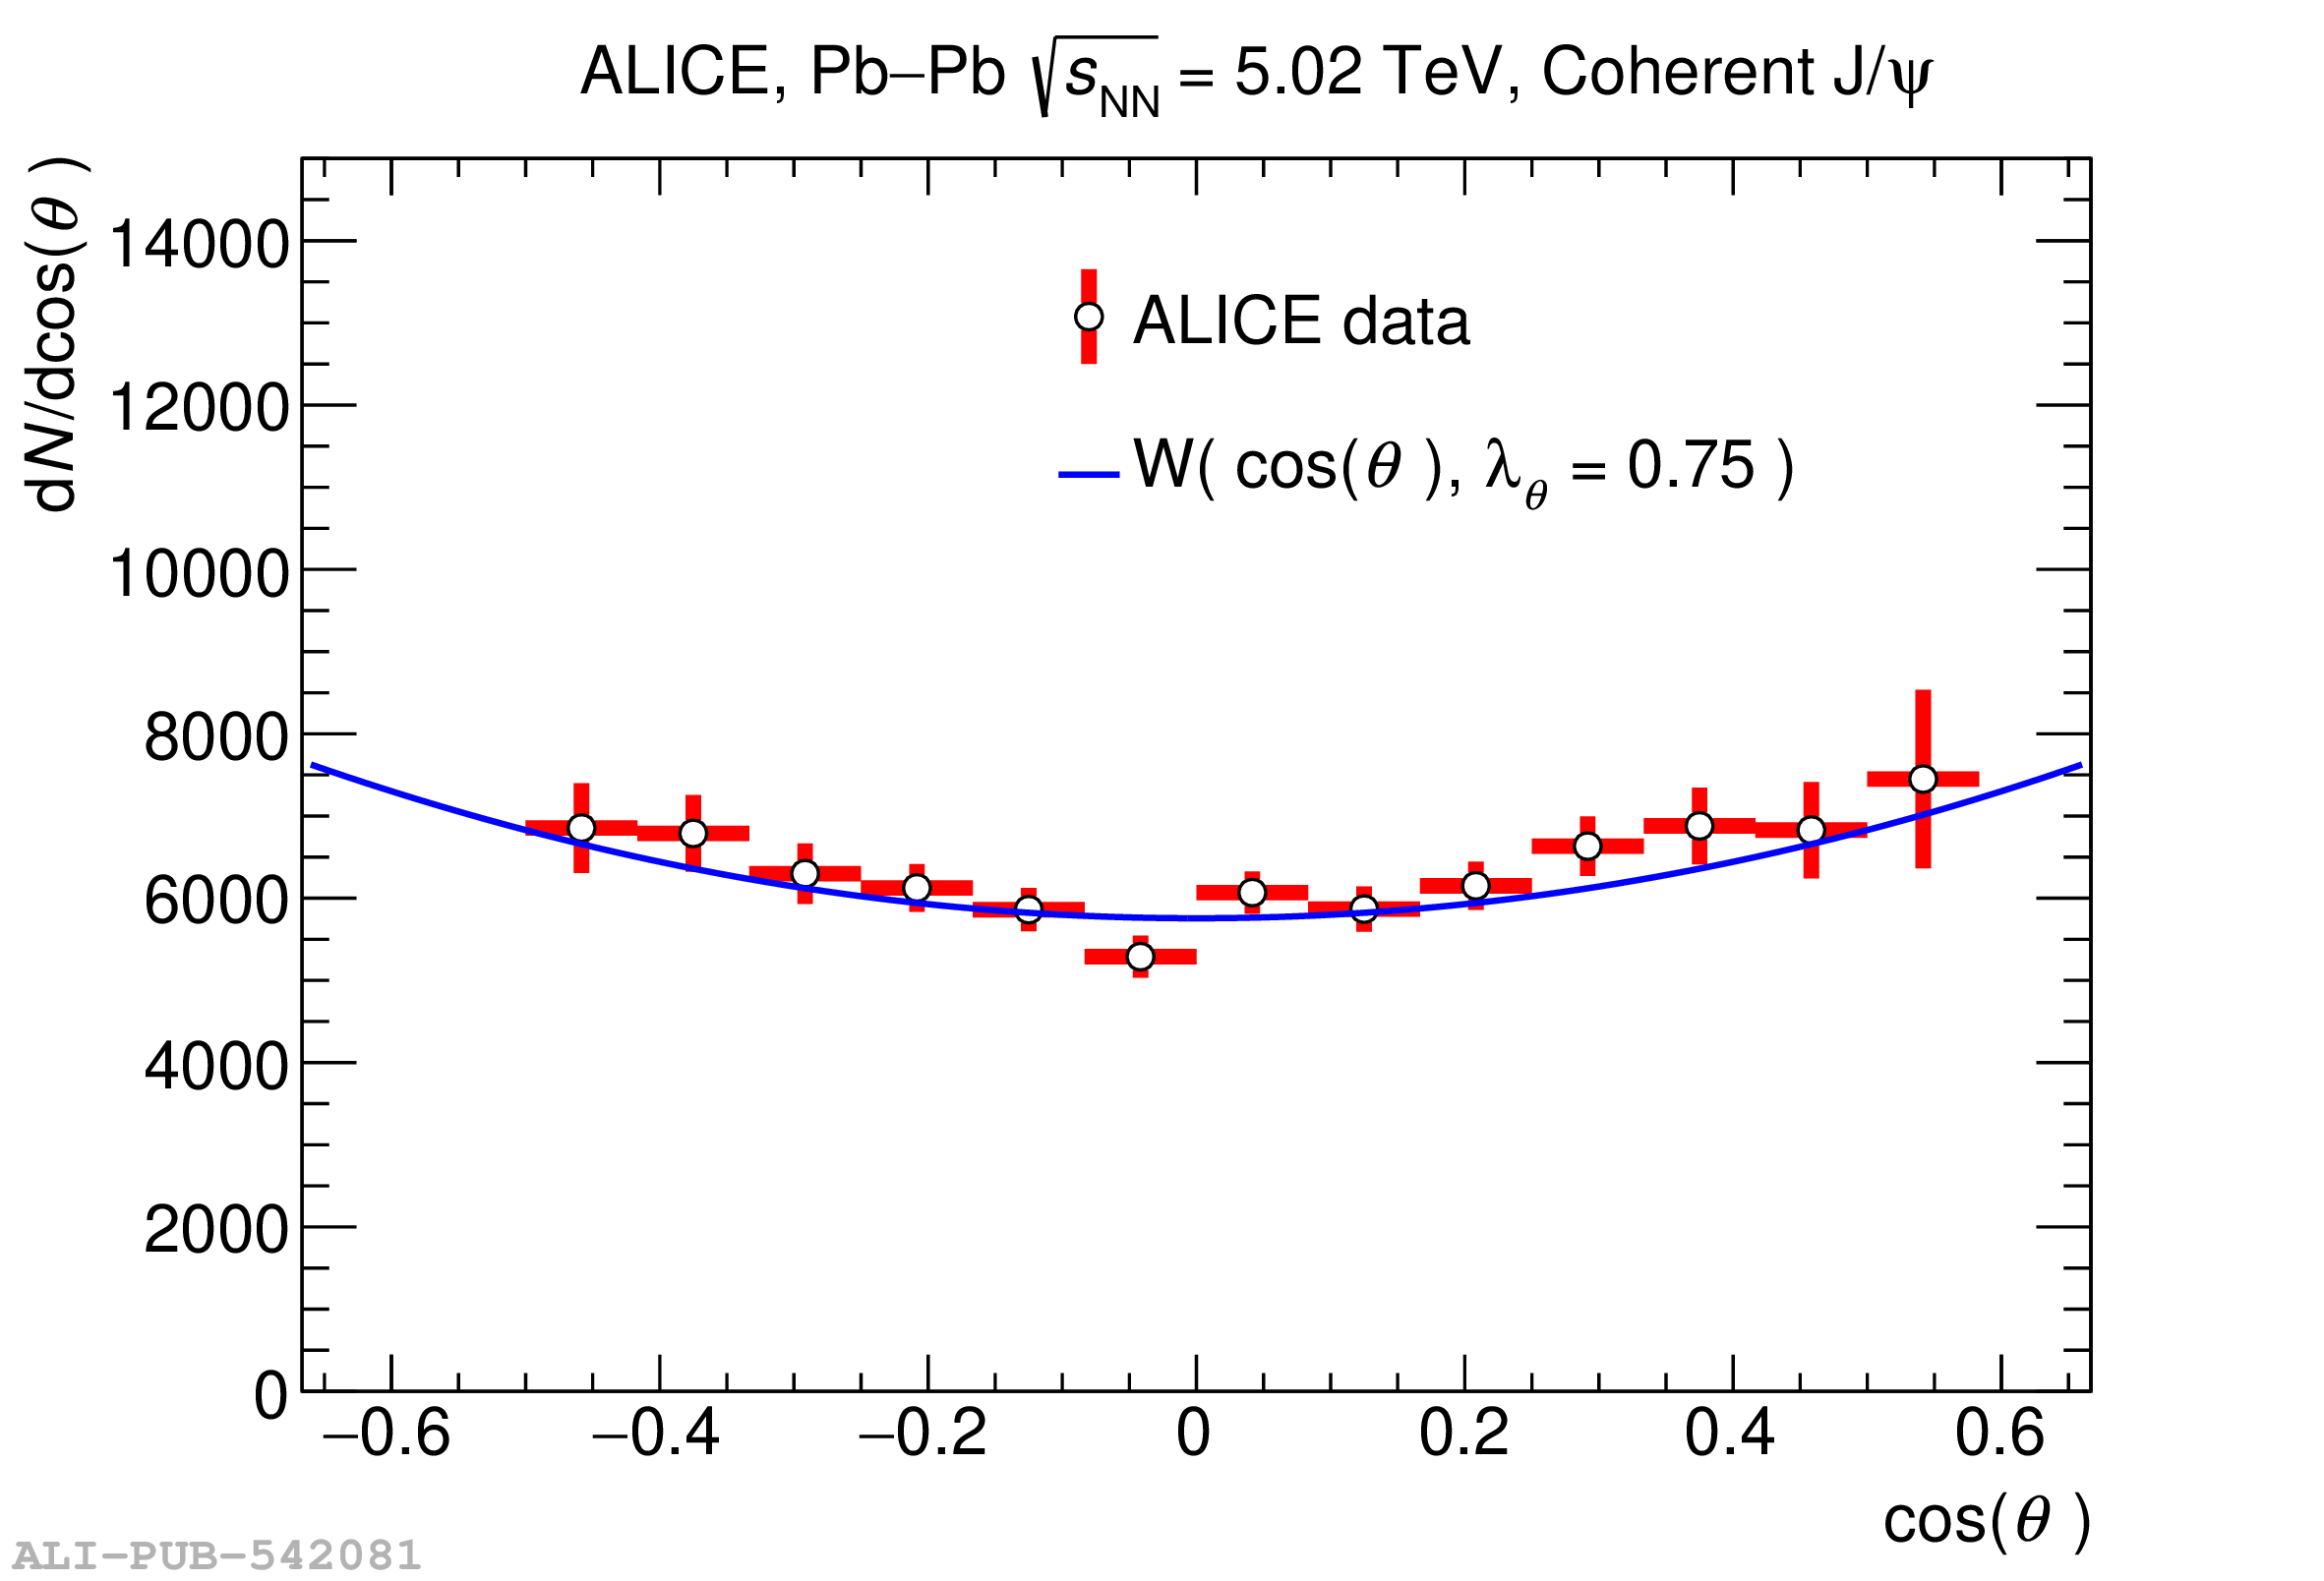 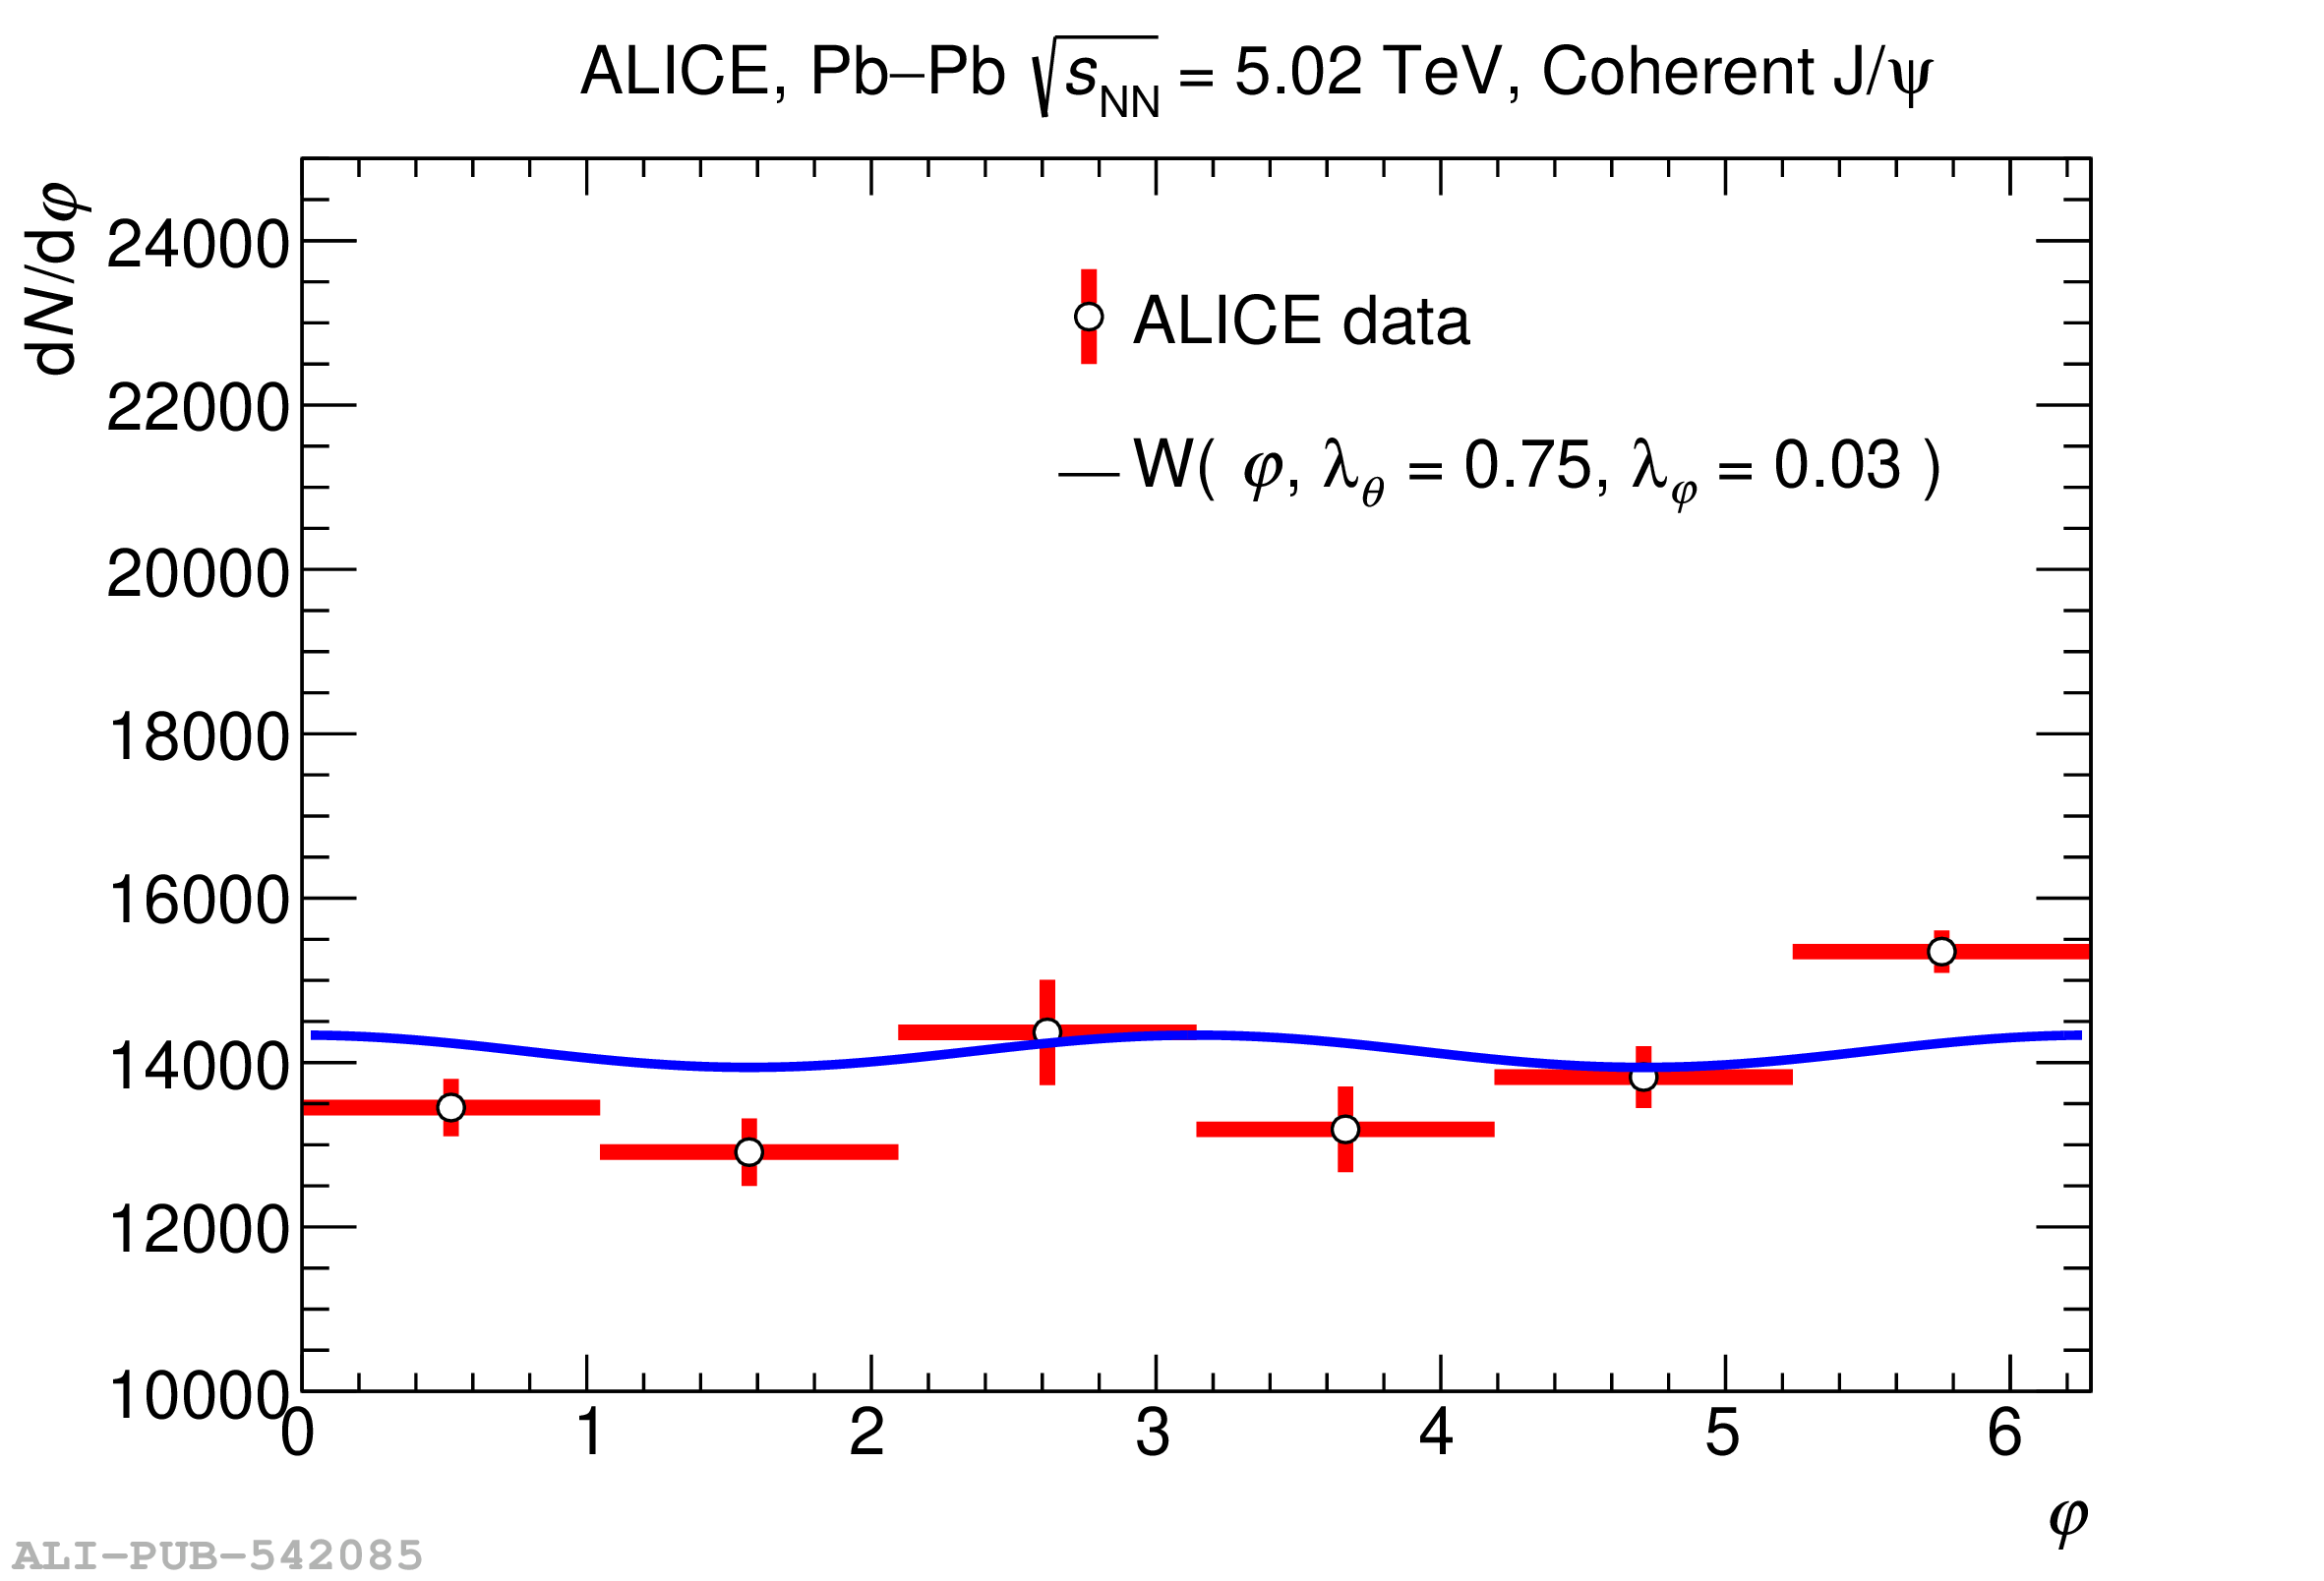 |