Top panels: fully corrected \PbPb $\Delta R^{\rm WTA-Standard}/R$ (left), and $\Delta R^{\rm WTA-SD}/R$ with $(z_{\rm cut}=0.2,\beta=0)$ (right) distributions in the $p_{\rm T}^{\rm ch jet}$ interval $[100,140]$ GeV/$c$. Central and bottom panels: measured Pb$-$Pb$(R=0.4)/$Pb$-$Pb$(R=0.2)$ ratio in black, as well as predictions from a selection of jet quenching models. |  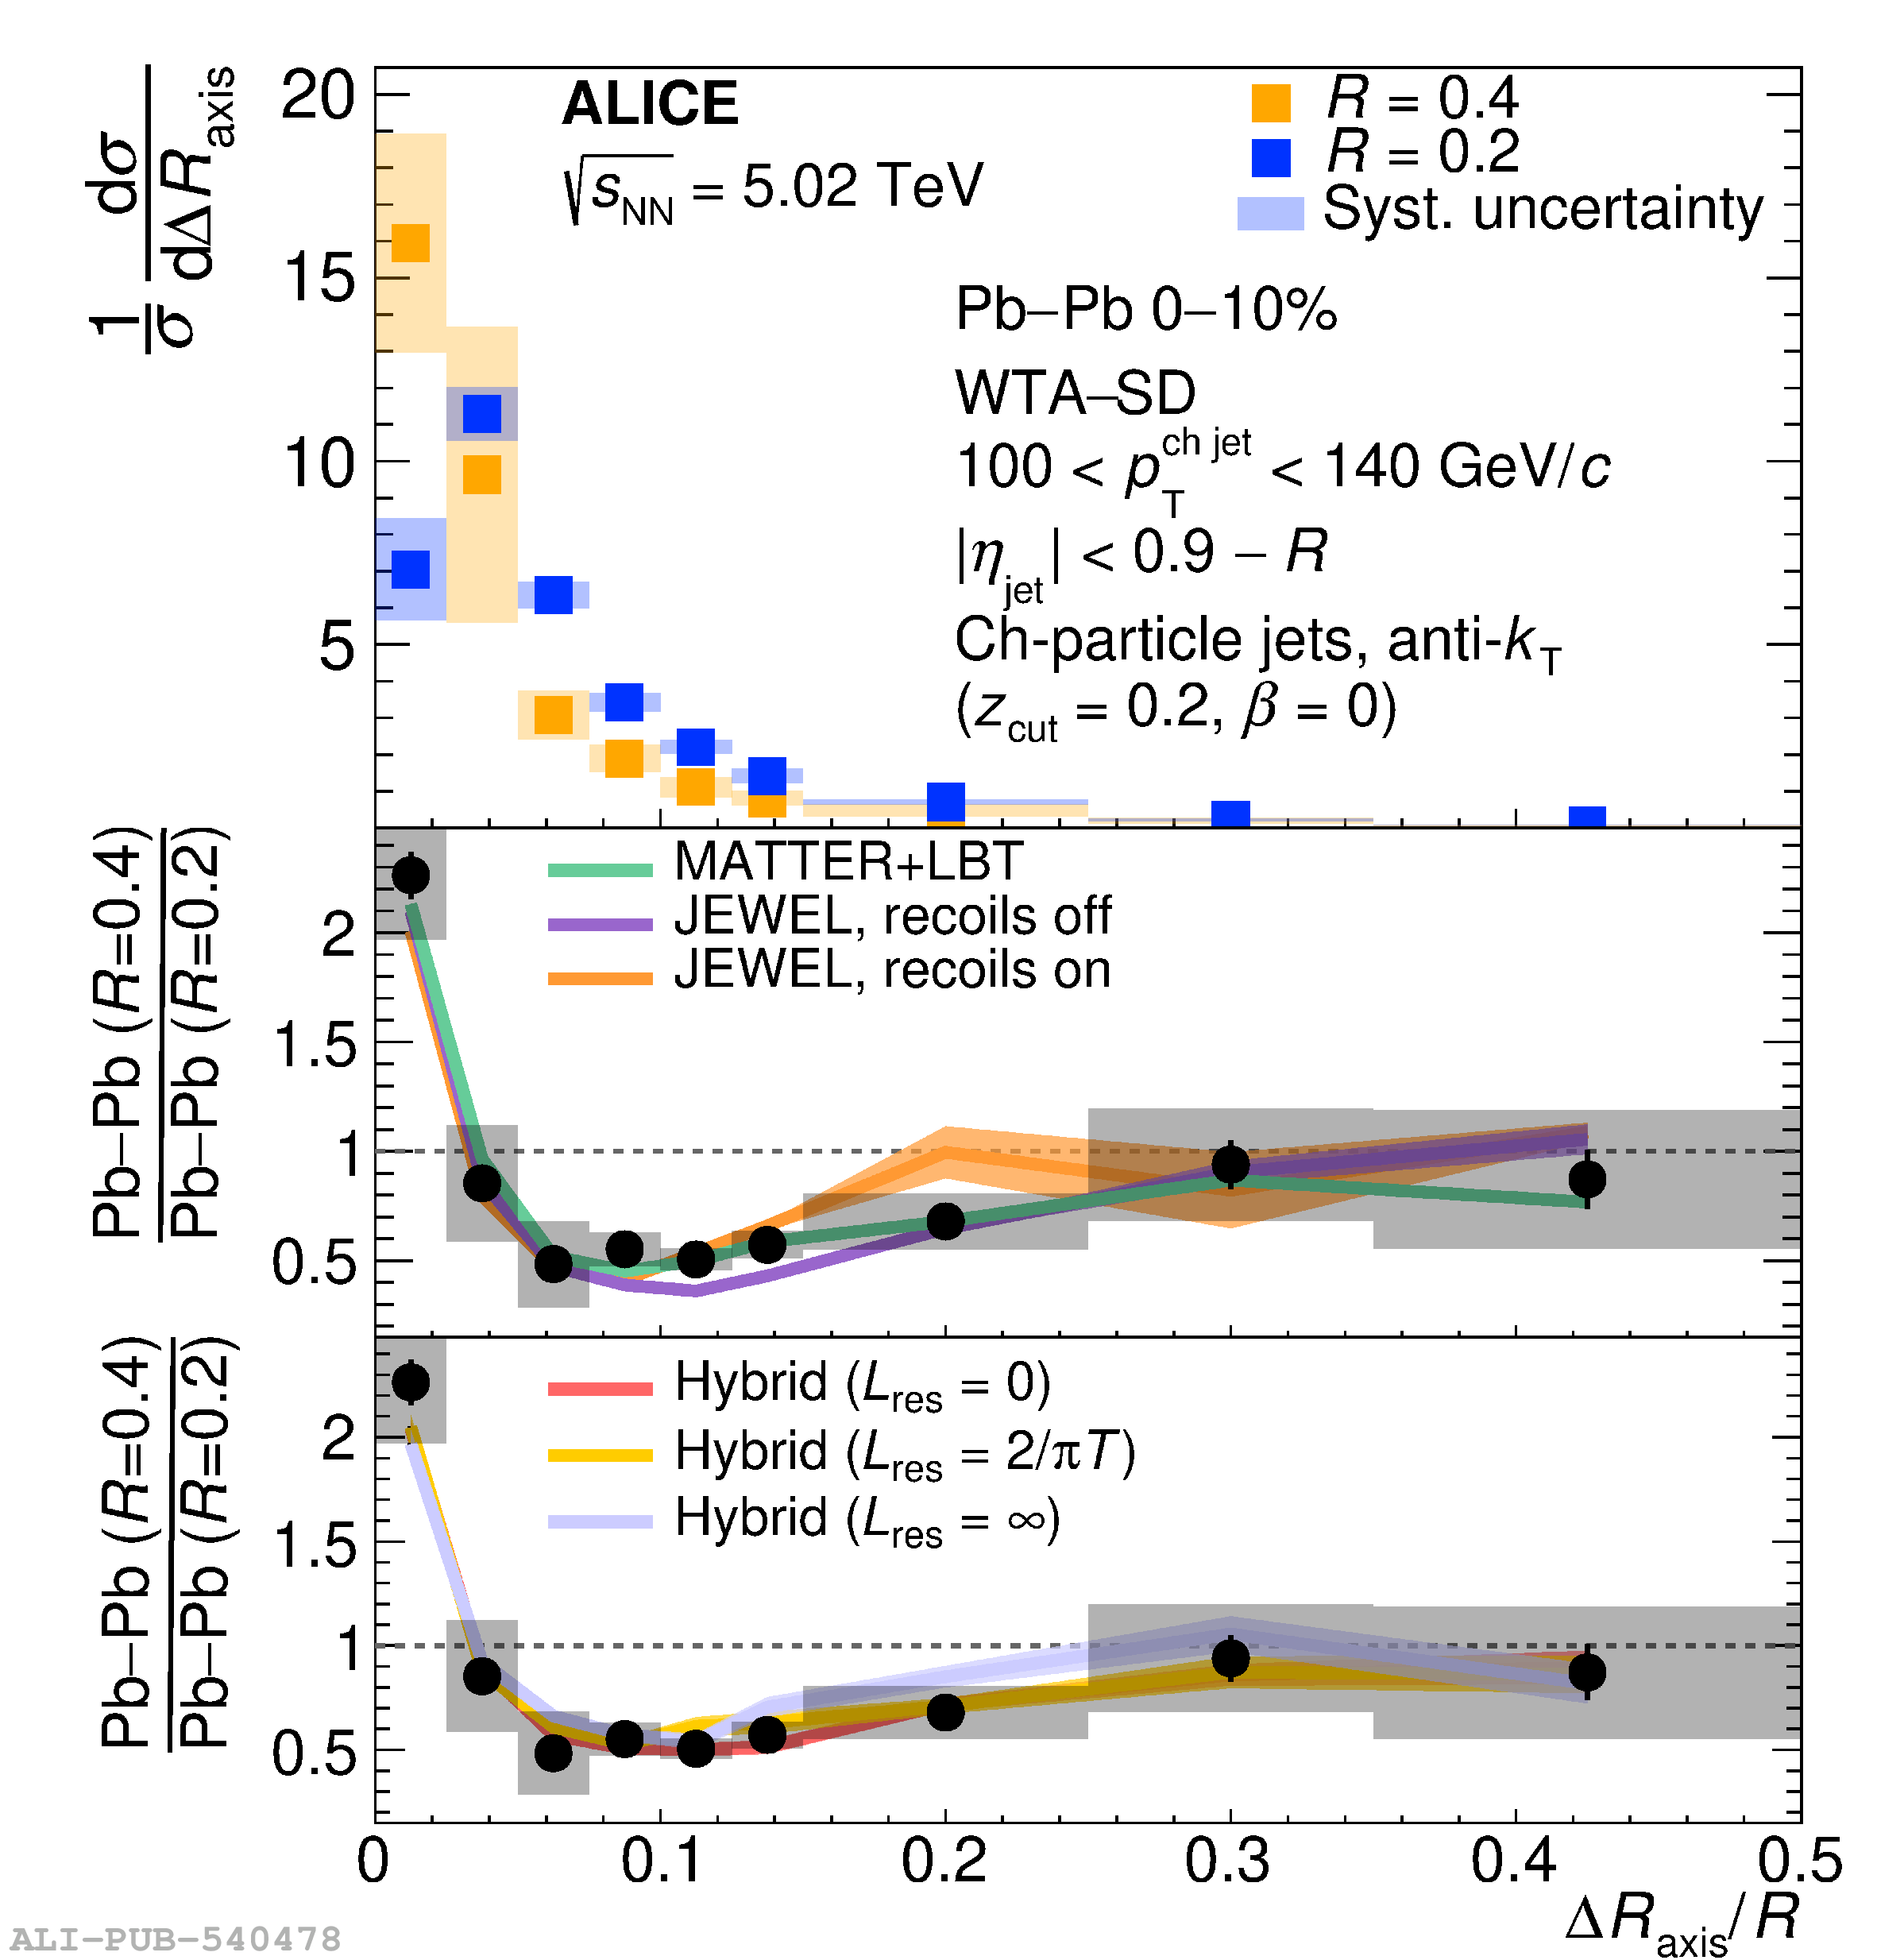 |