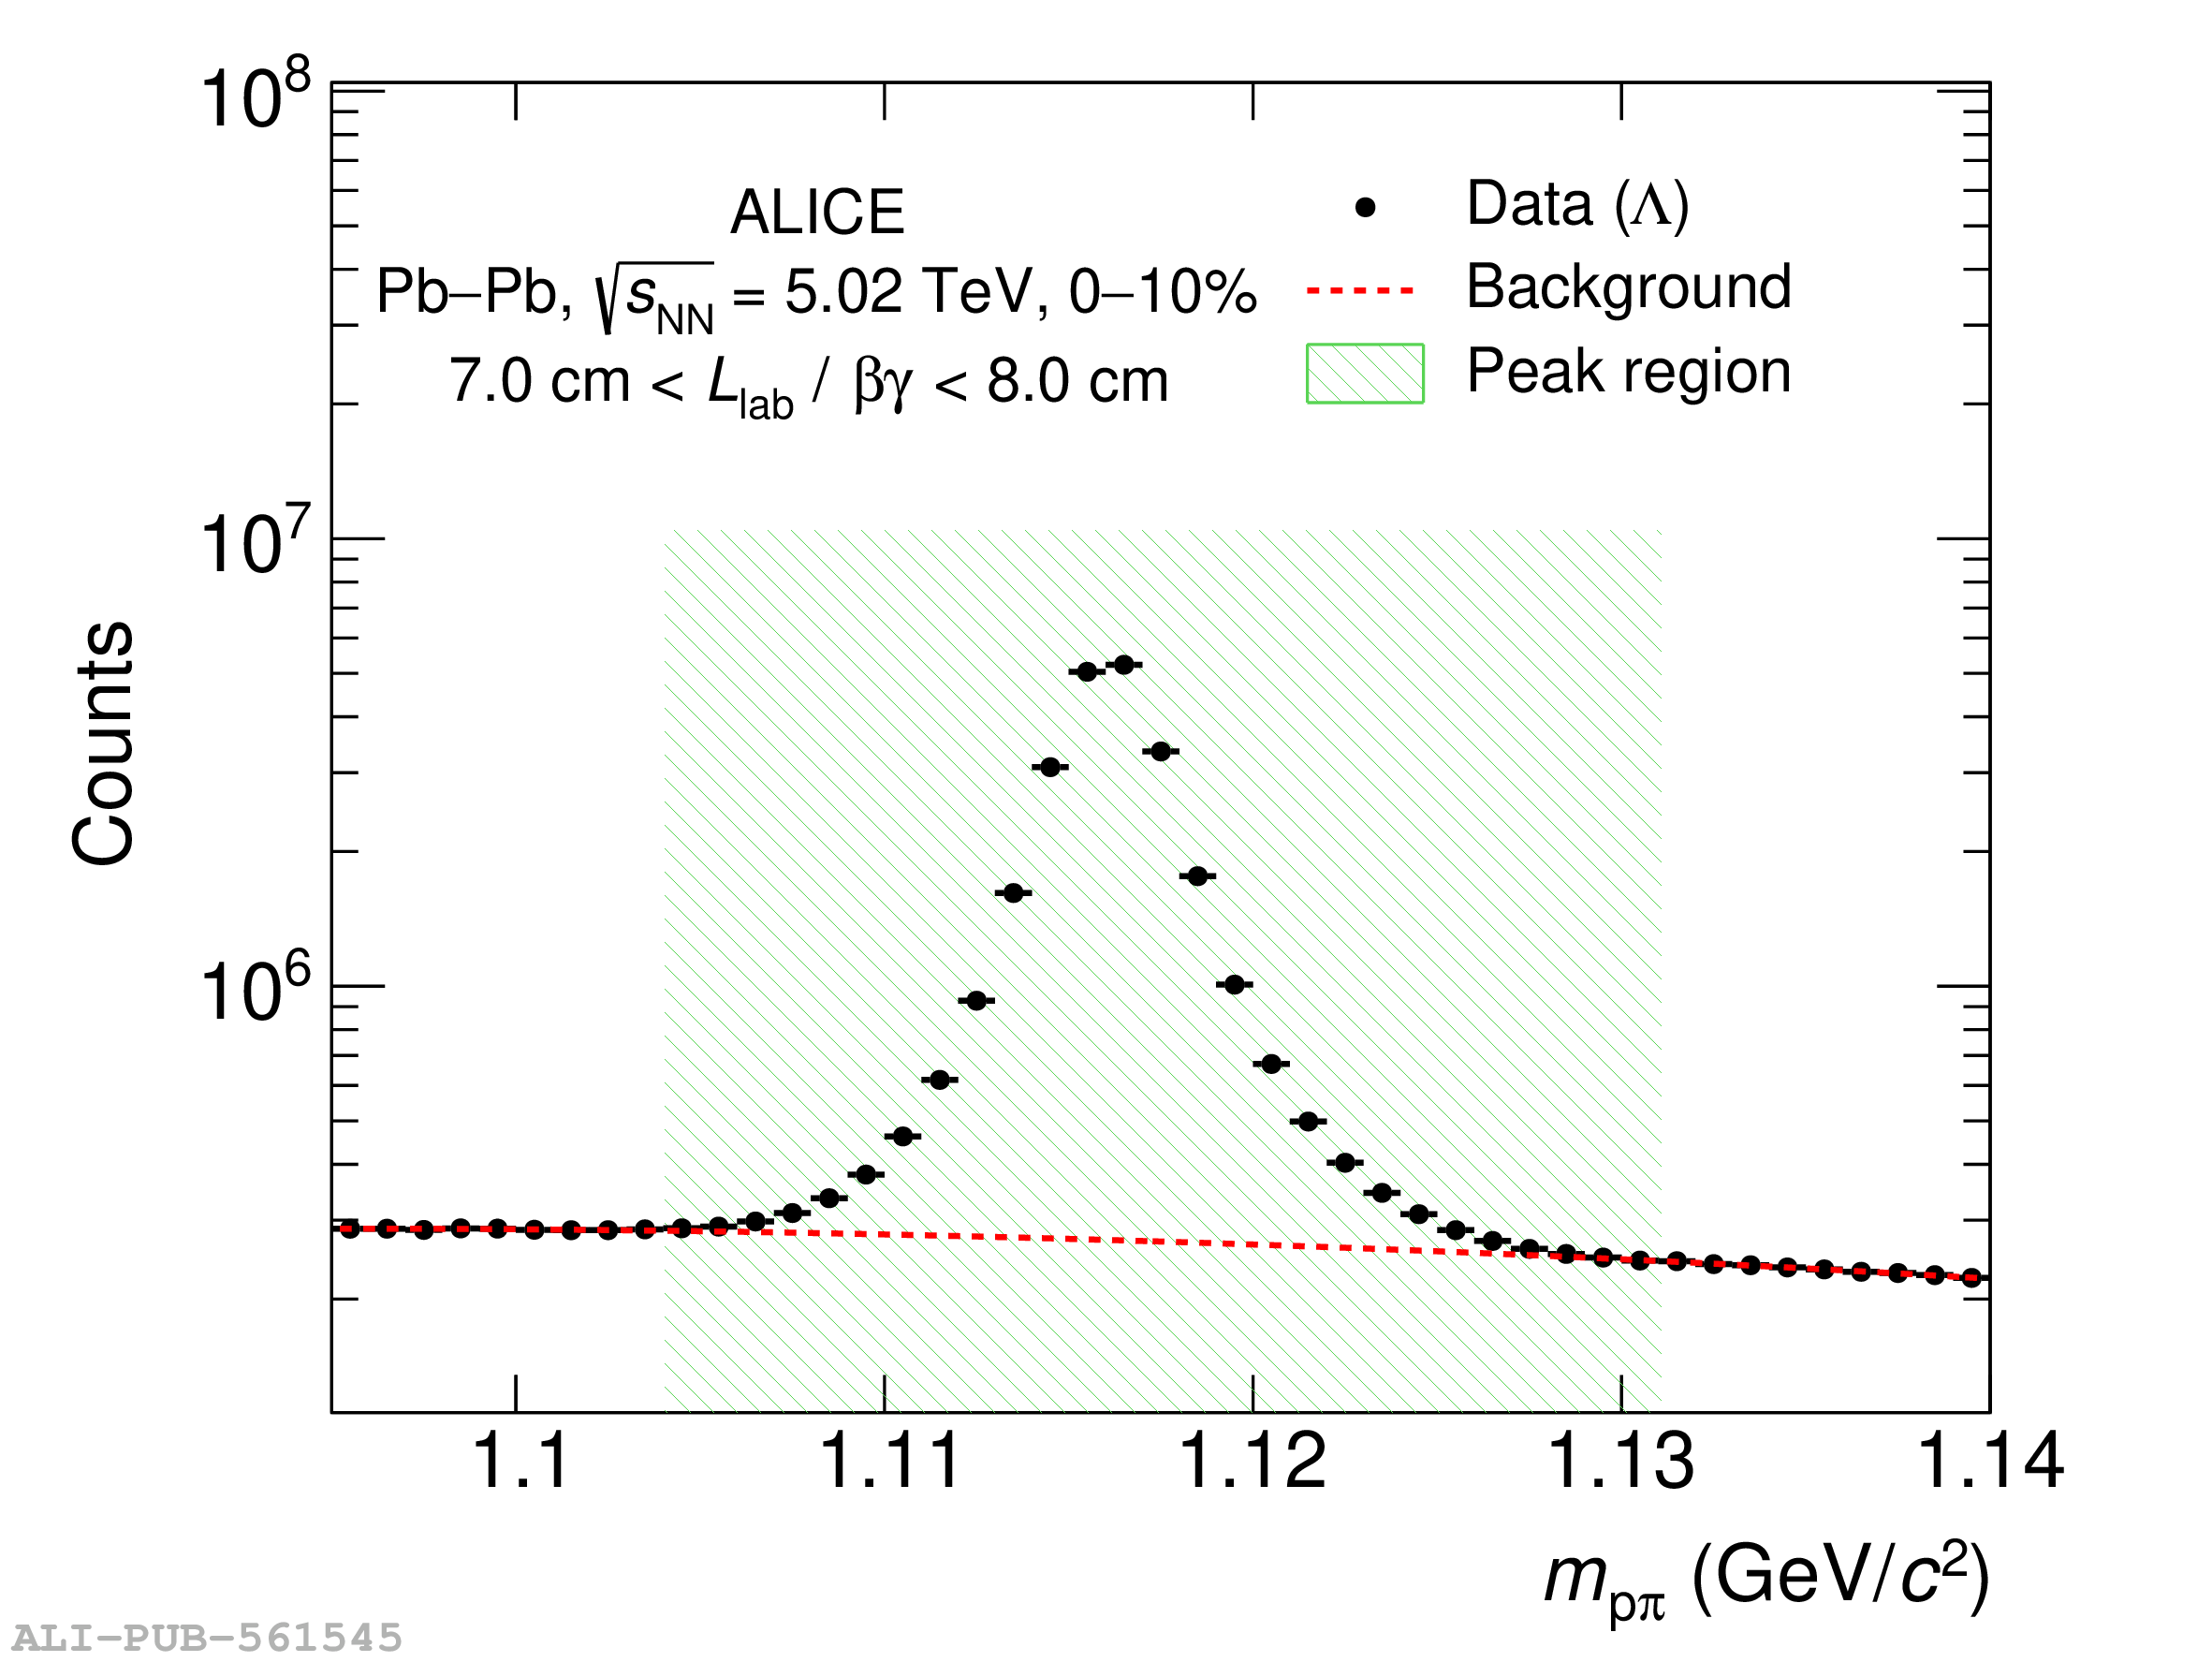
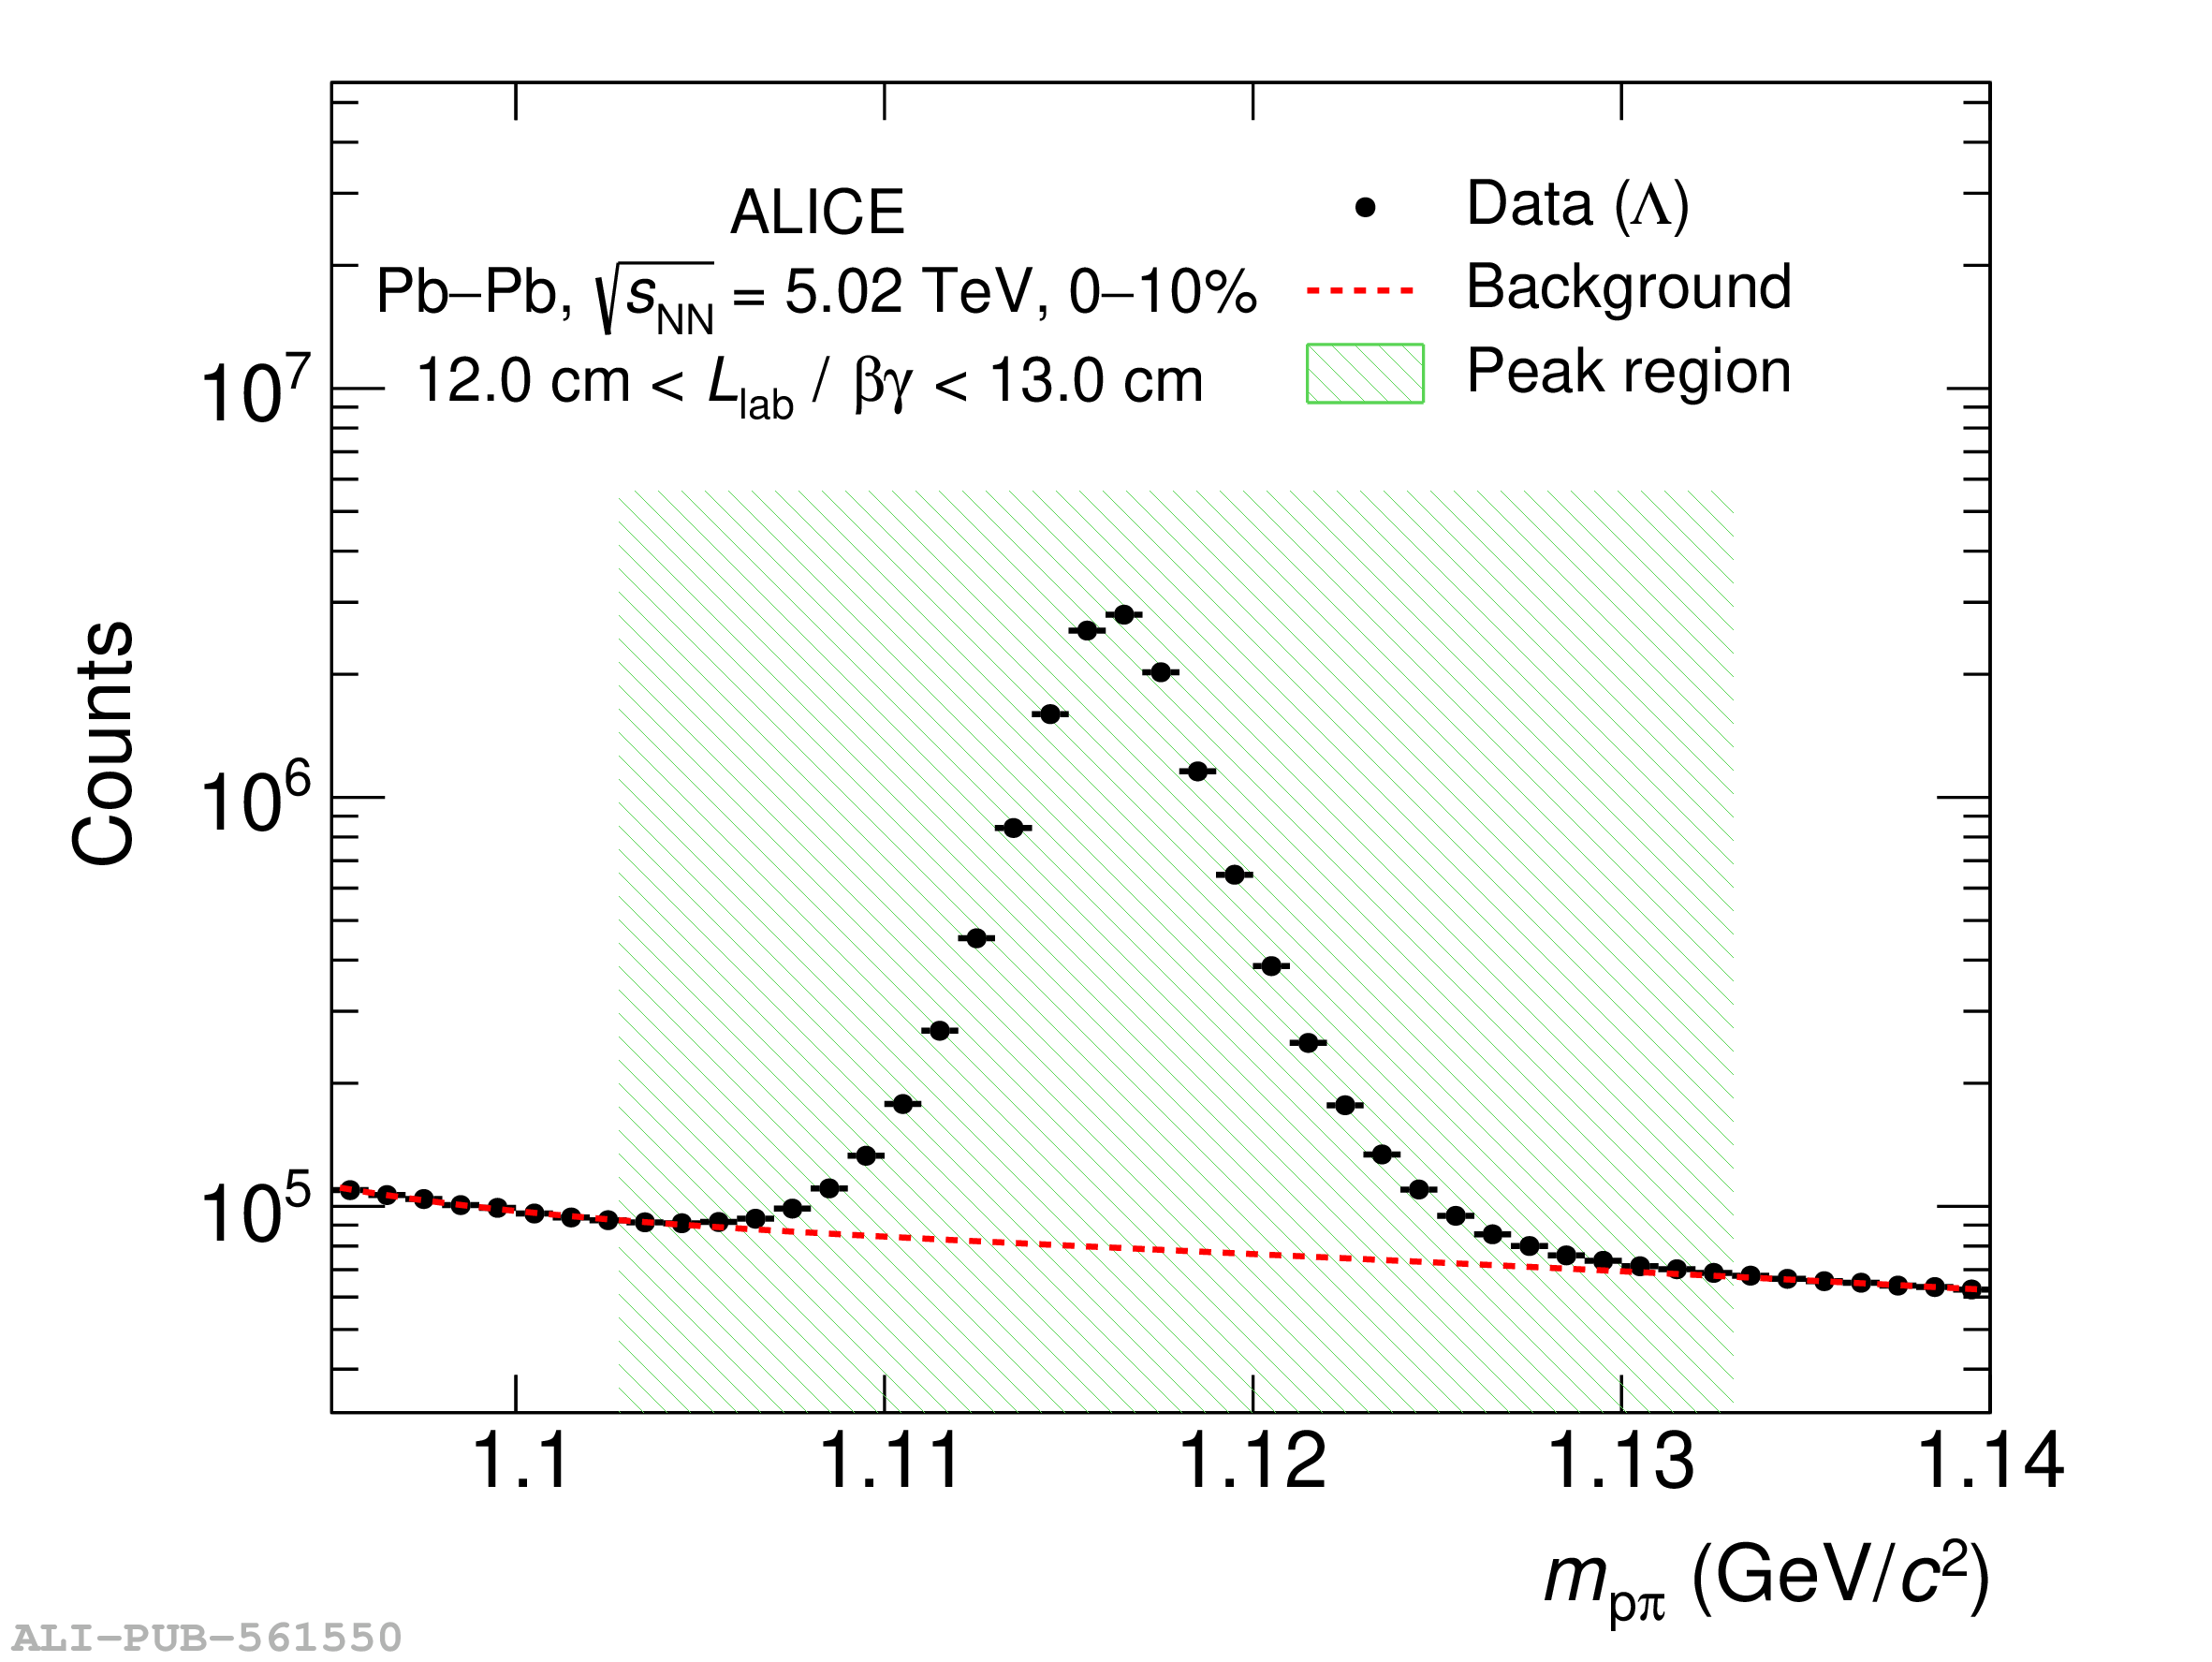
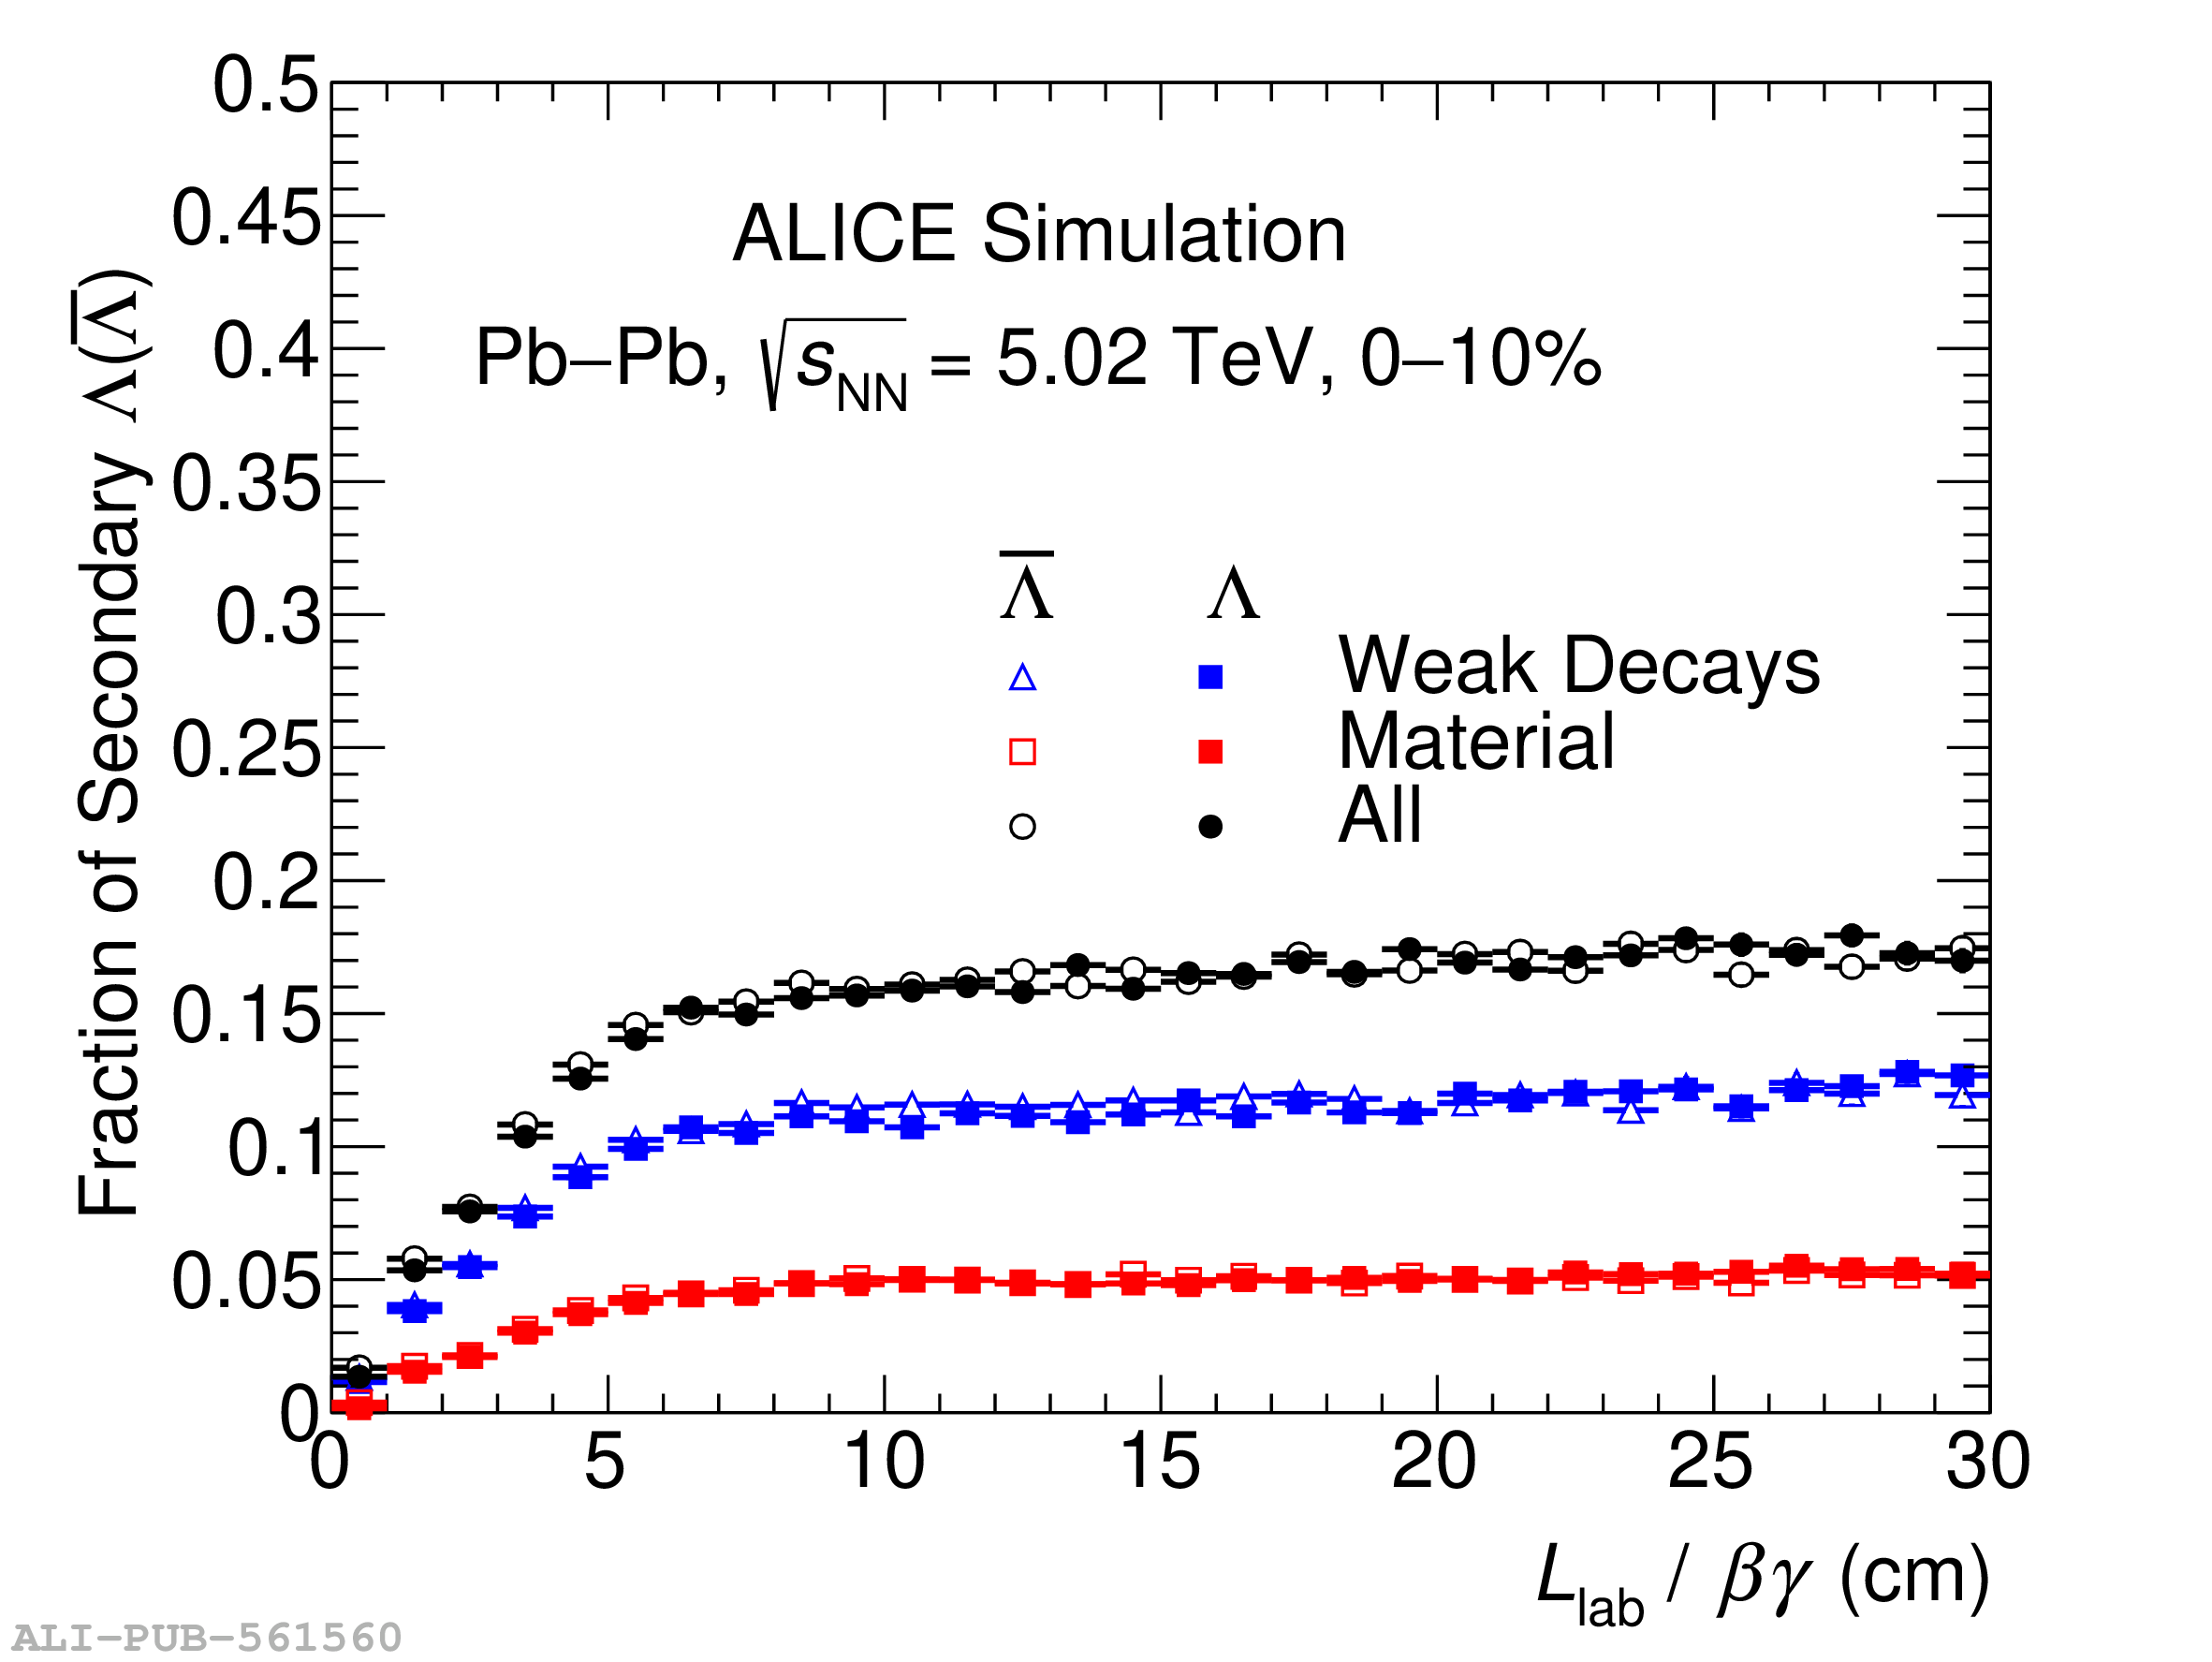
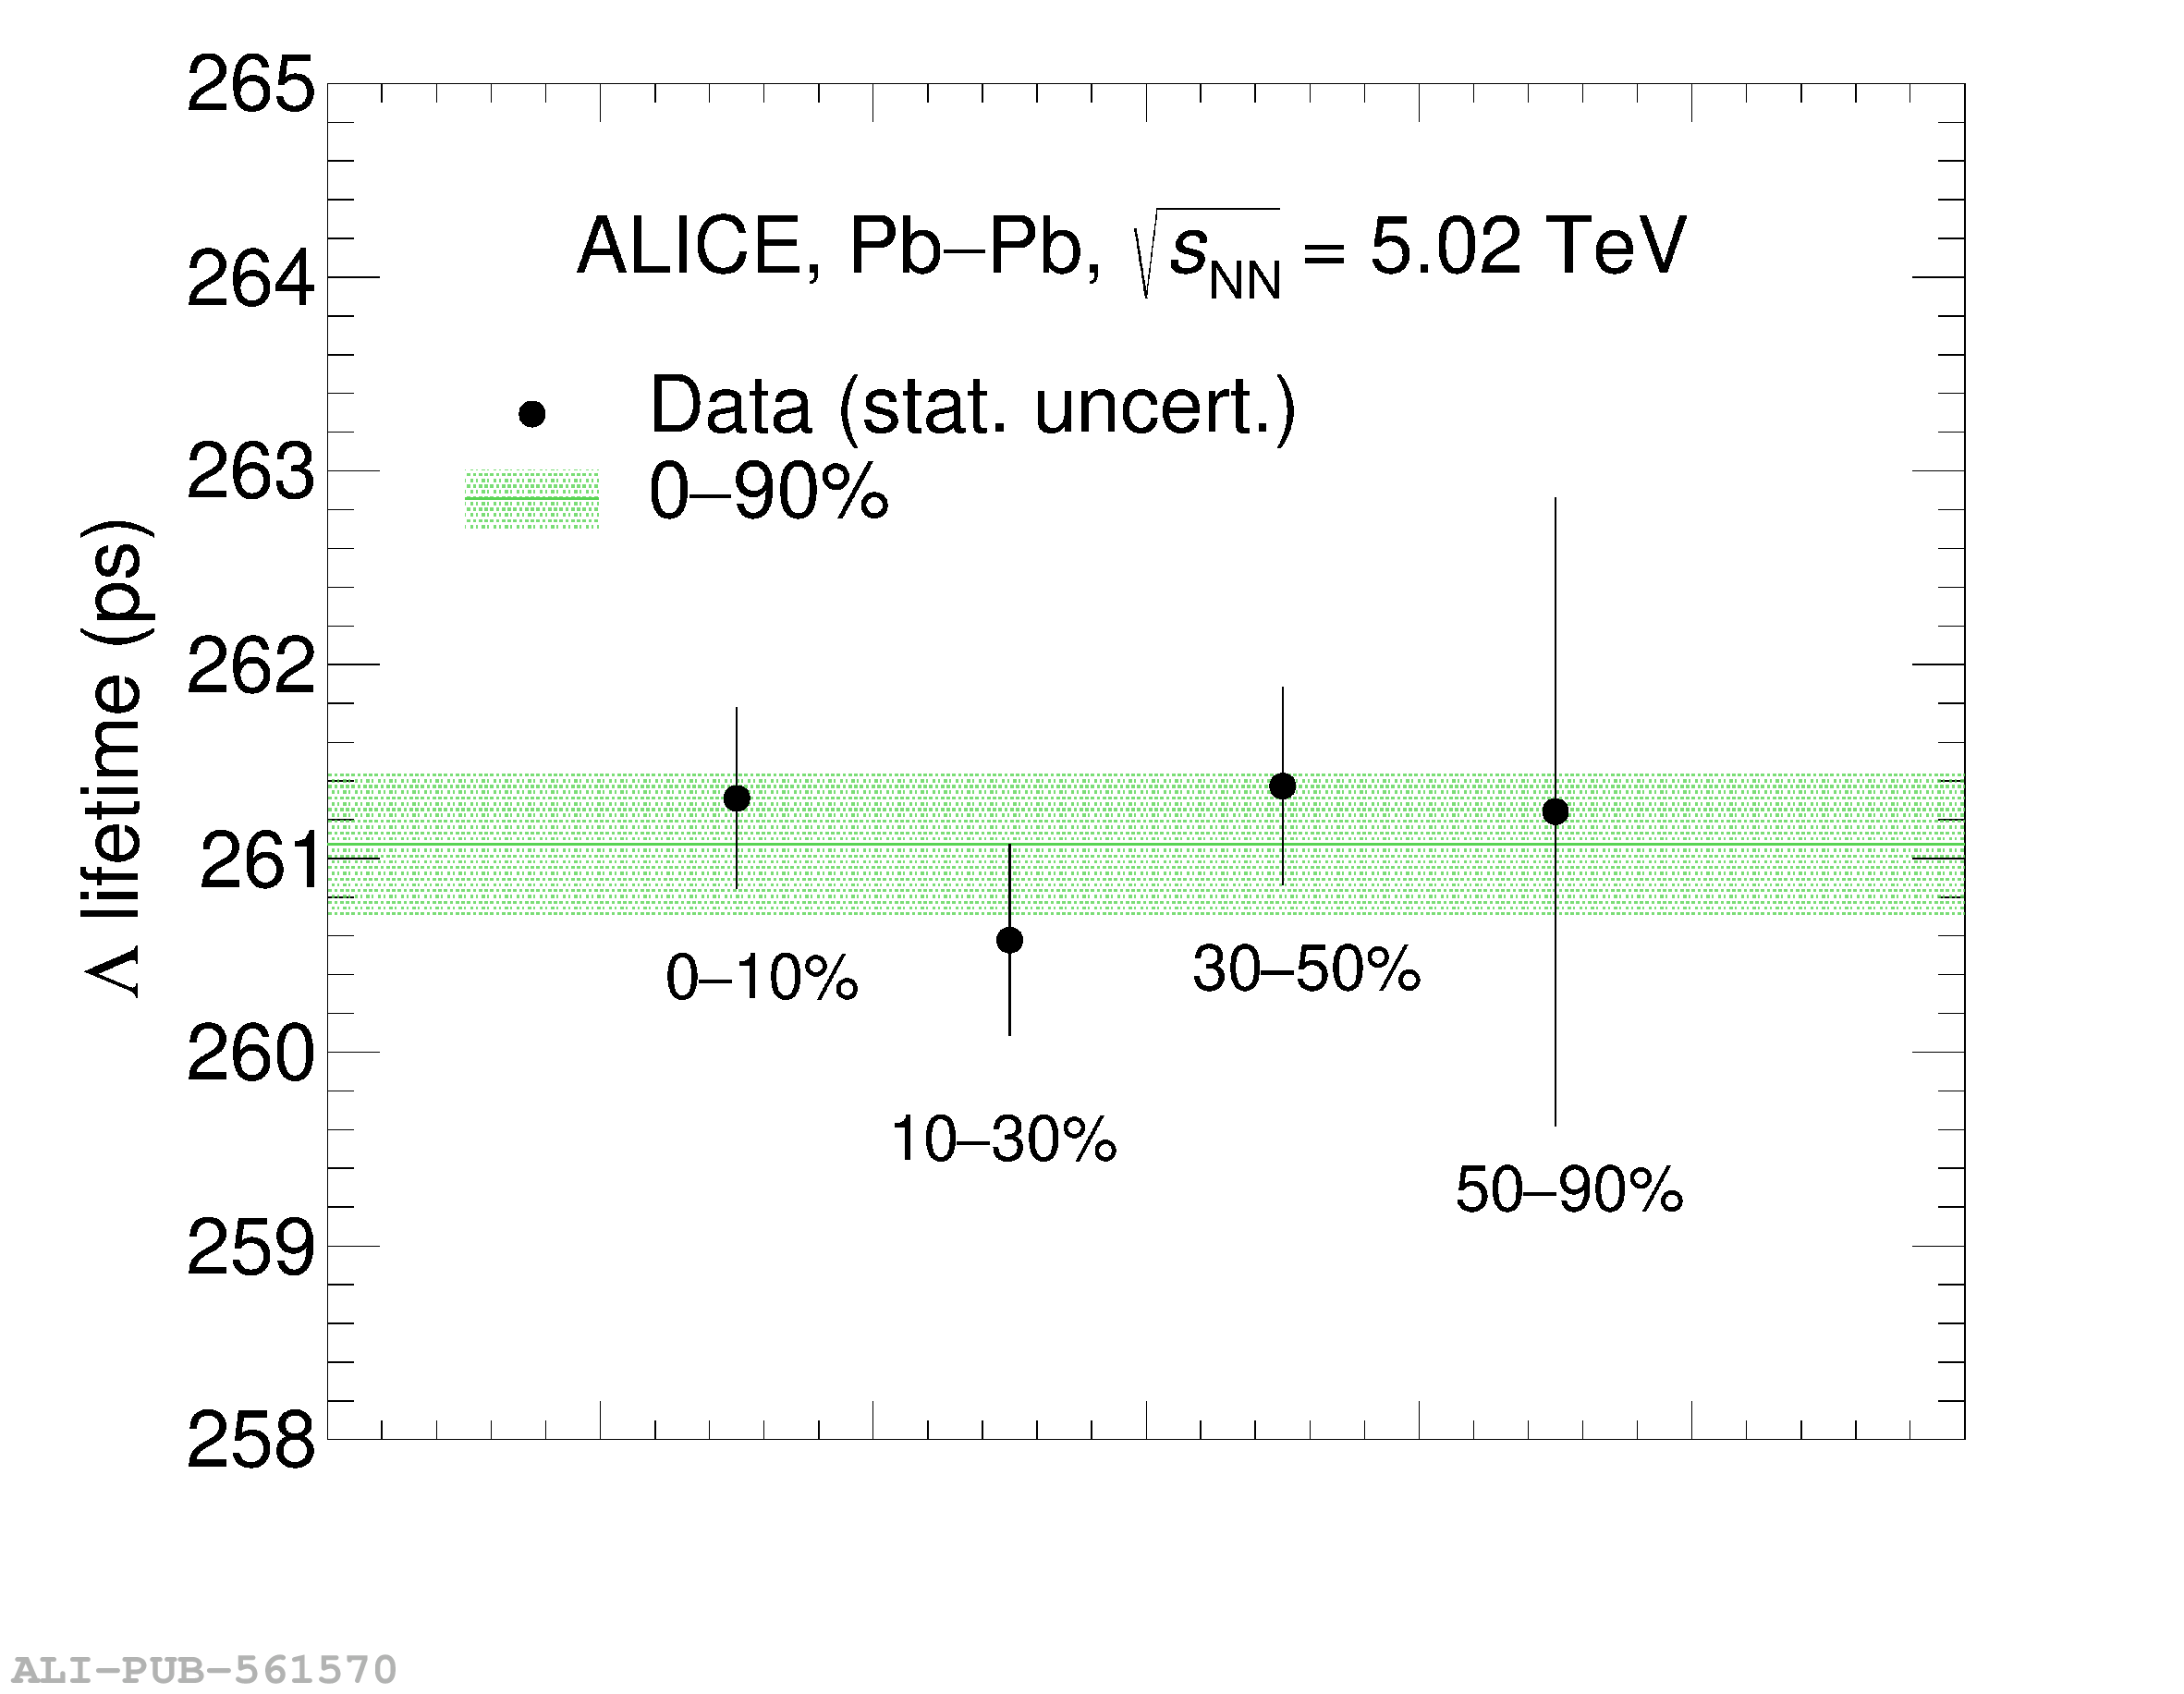
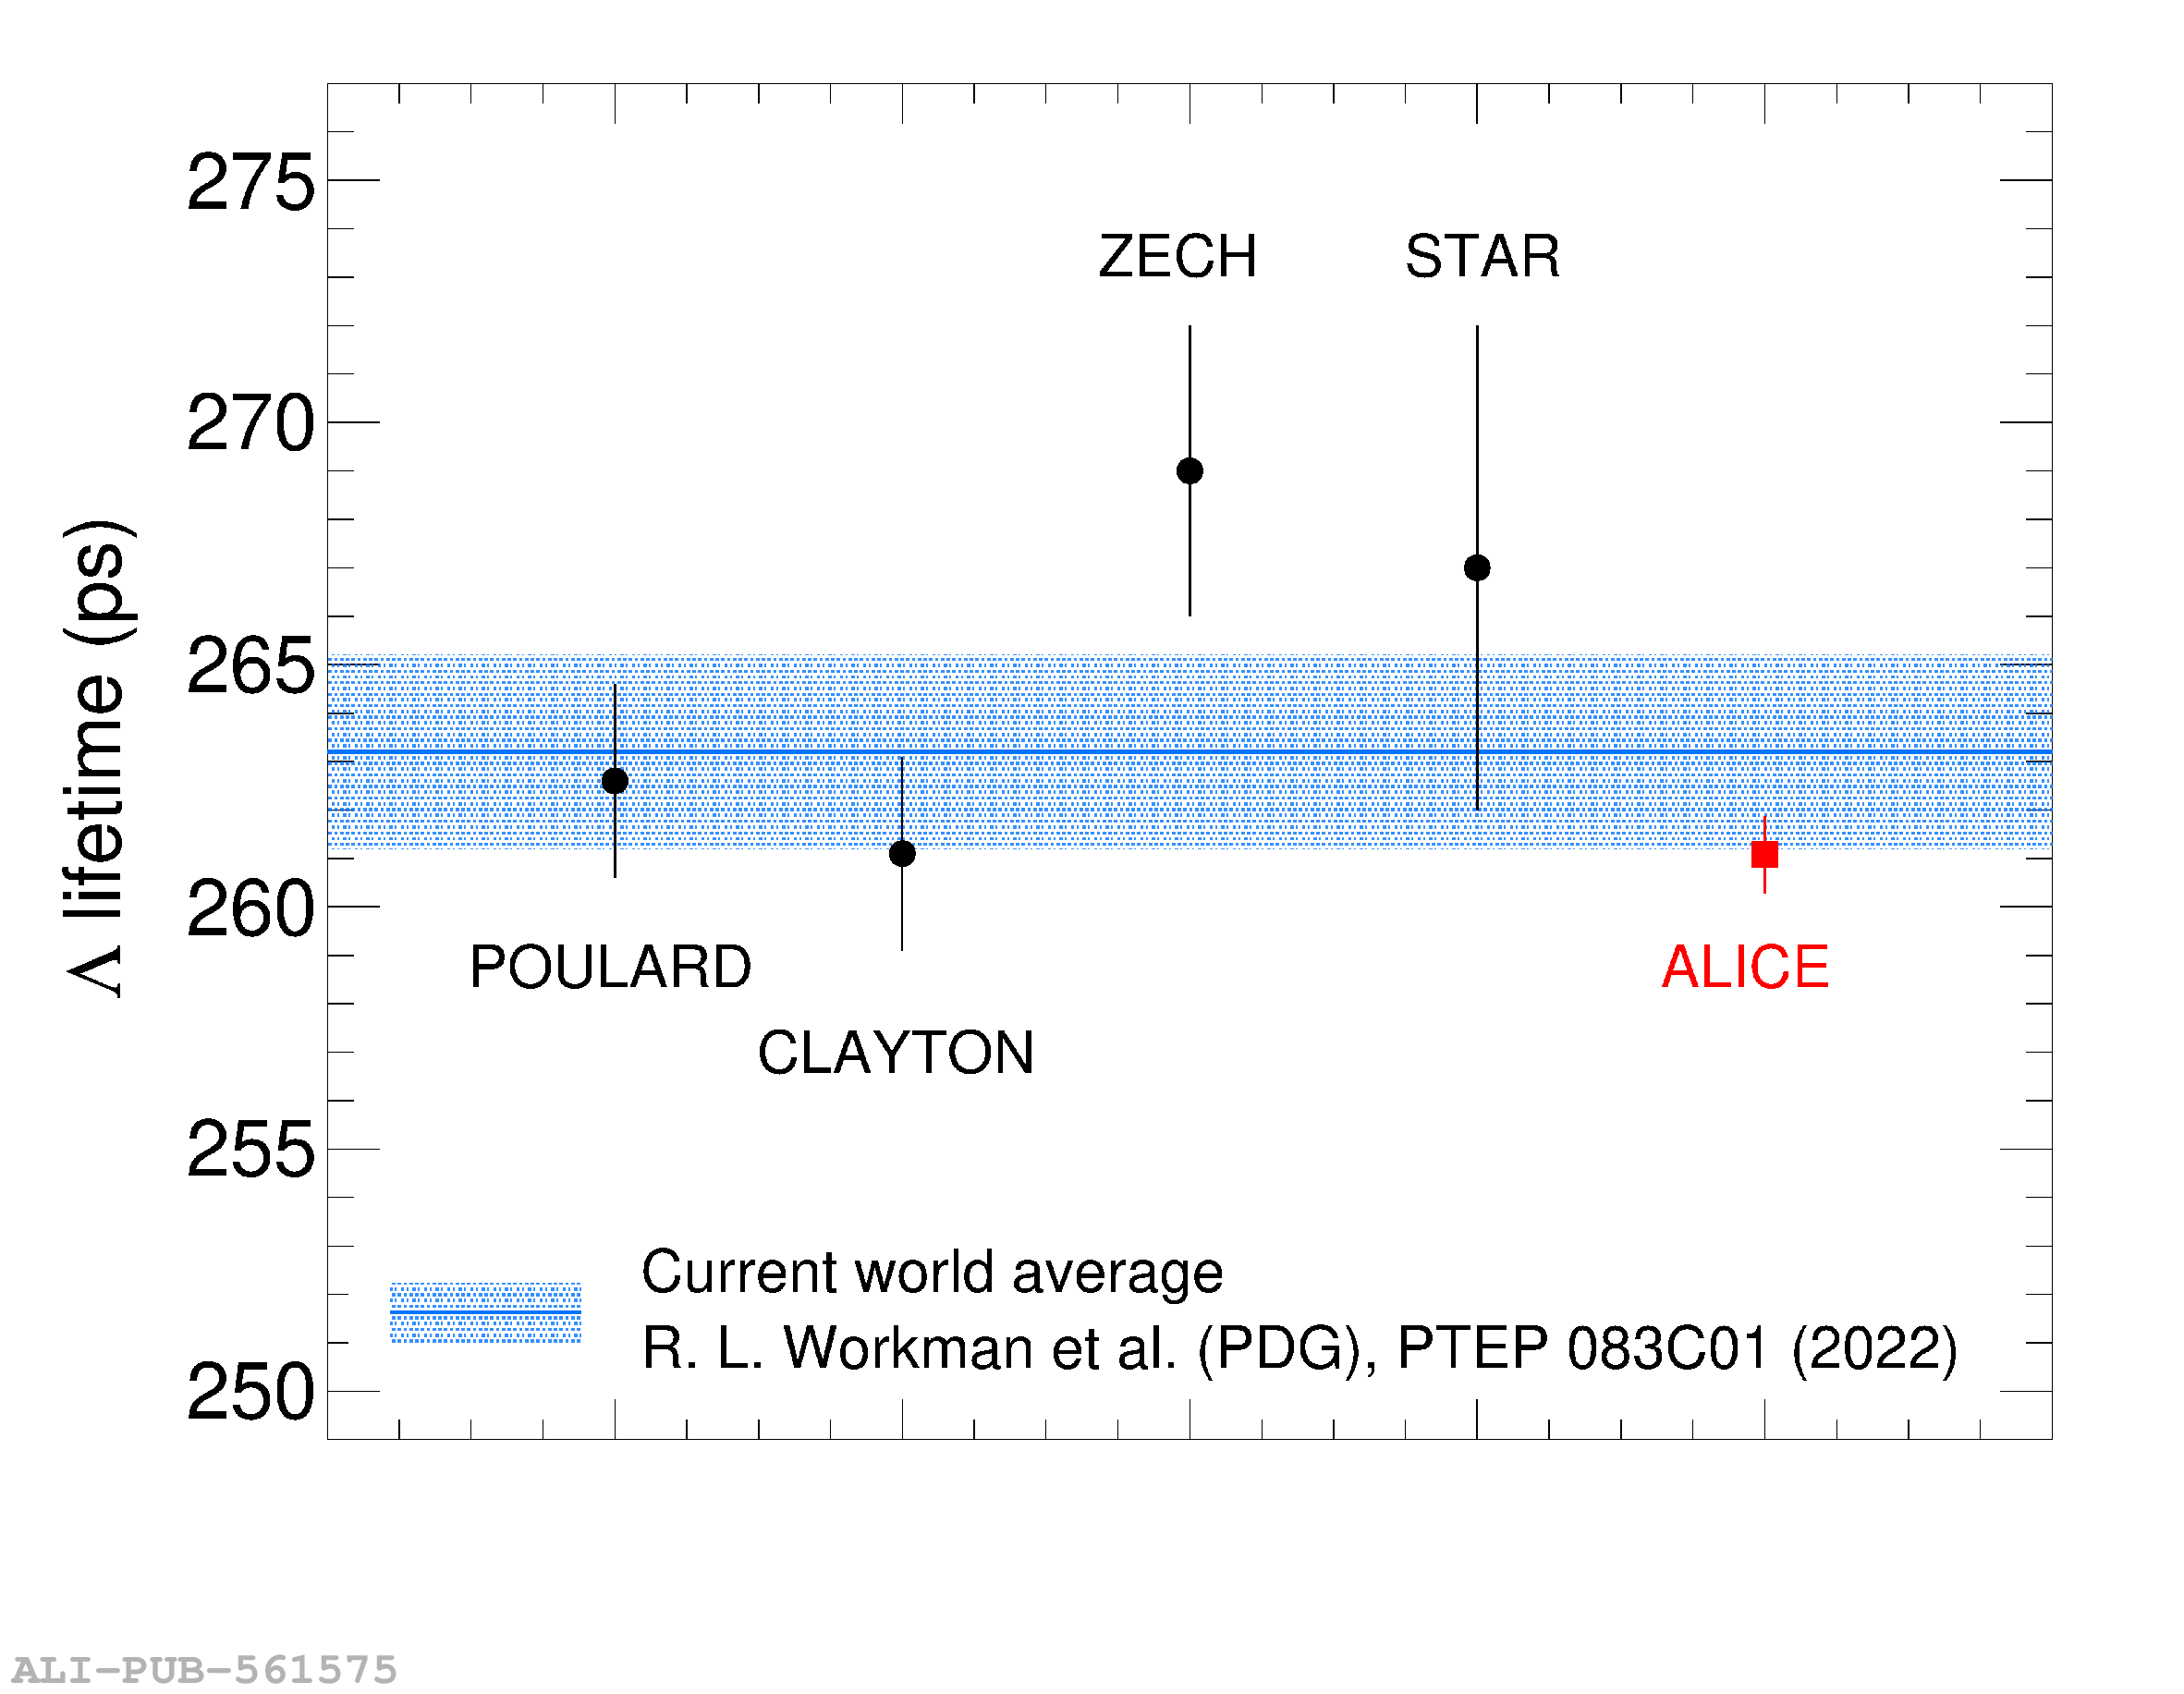
A new, more precise measurement of the $\Lambda$ hyperon lifetime is performed using a large data sample of Pb$-$Pb collisions at $\sqrt{s_{\rm NN}} = 5.02$ TeV with ALICE. The $\Lambda$ and $\overline{\Lambda}$ hyperons are reconstructed at midrapidity using their two-body weak decay channel $\Lambda \rightarrow \mathrm{p} + \pi^{-}$ and $\overline{\Lambda} \rightarrow \overline{\mathrm{p}} + \pi^{+}$. The measured value of the $\Lambda$ lifetime is $\tau_{\Lambda} = [261.07 \pm 0.37 \ ( \rm stat.) \pm 0.72 \ (\rm syst.) ]\ \rm ps$. The relative difference between the lifetime of $\Lambda$ and $\overline{\Lambda}$, which represents an important test of CPT invariance in the strangeness sector, is also measured. The obtained value $(\tau_{\Lambda}-\tau_{\overline{\Lambda}})/\tau_{\Lambda} = 0.0013 \pm 0.0028 \ (\mathrm{stat.}) \pm 0.0021 \ (\mathrm{syst.})$ is consistent with zero within the uncertainties. Both measurements of the $\Lambda$ hyperon lifetime and of the relative difference between $\tau_{\Lambda}$ and $\tau_{\overline{\Lambda}}$ are in agreement with the corresponding world averages of the Particle Data Group and about a factor of three more precise.
Phys. Rev. D 108 (2023) 032009
HEP Data
e-Print: arXiv:2303.00606 | PDF | inSPIRE
CERN-EP-2023-020
Figure group