The ALICE Collaboration reports a differential measurement of inclusive jet suppression using pp and Pb$-$Pb collision data at a center-of-mass energy per nucleon-nucleon collision $\sqrt{s_{\rm NN}} = 5.02$ TeV. Charged-particle jets are reconstructed using the anti-$k_{\rm T}$ algorithm with resolution parameters $R =$ 0.2, 0.3, 0.4, 0.5, and 0.6 in pp collisions and $R =$ 0.2, 0.4, 0.6 in central (0$-$10%), semi-central (30$-$50%), and peripheral (60$-$80%) Pb$-$Pb collisions. A novel approach based on machine learning is employed to mitigate the influence of jet background. This enables measurements of inclusive jet suppression in new regions of phase space, including down to the lowest jet $p_{\rm T} \geq 40$ GeV/$c$ at $R = 0.6$ in central Pb$-$Pb collisions. This is an important step for discriminating different models of jet quenching in the quark-gluon plasma. The transverse momentum spectra, nuclear modification factors, derived cross section, and nuclear modification factor ratios for different jet resolution parameters of charged-particle jets are presented and compared to model predictions. A mild dependence of the nuclear modification factor ratios on collision centrality and resolution parameter is observed. The results are compared to a variety of jet-quenching models with varying levels of agreement.
Phys. Lett. B 849 (2024) 138412
HEP Data
e-Print: arXiv:2303.00592 | PDF | inSPIRE
CERN-EP-2023-027
Figure group
Figure 1
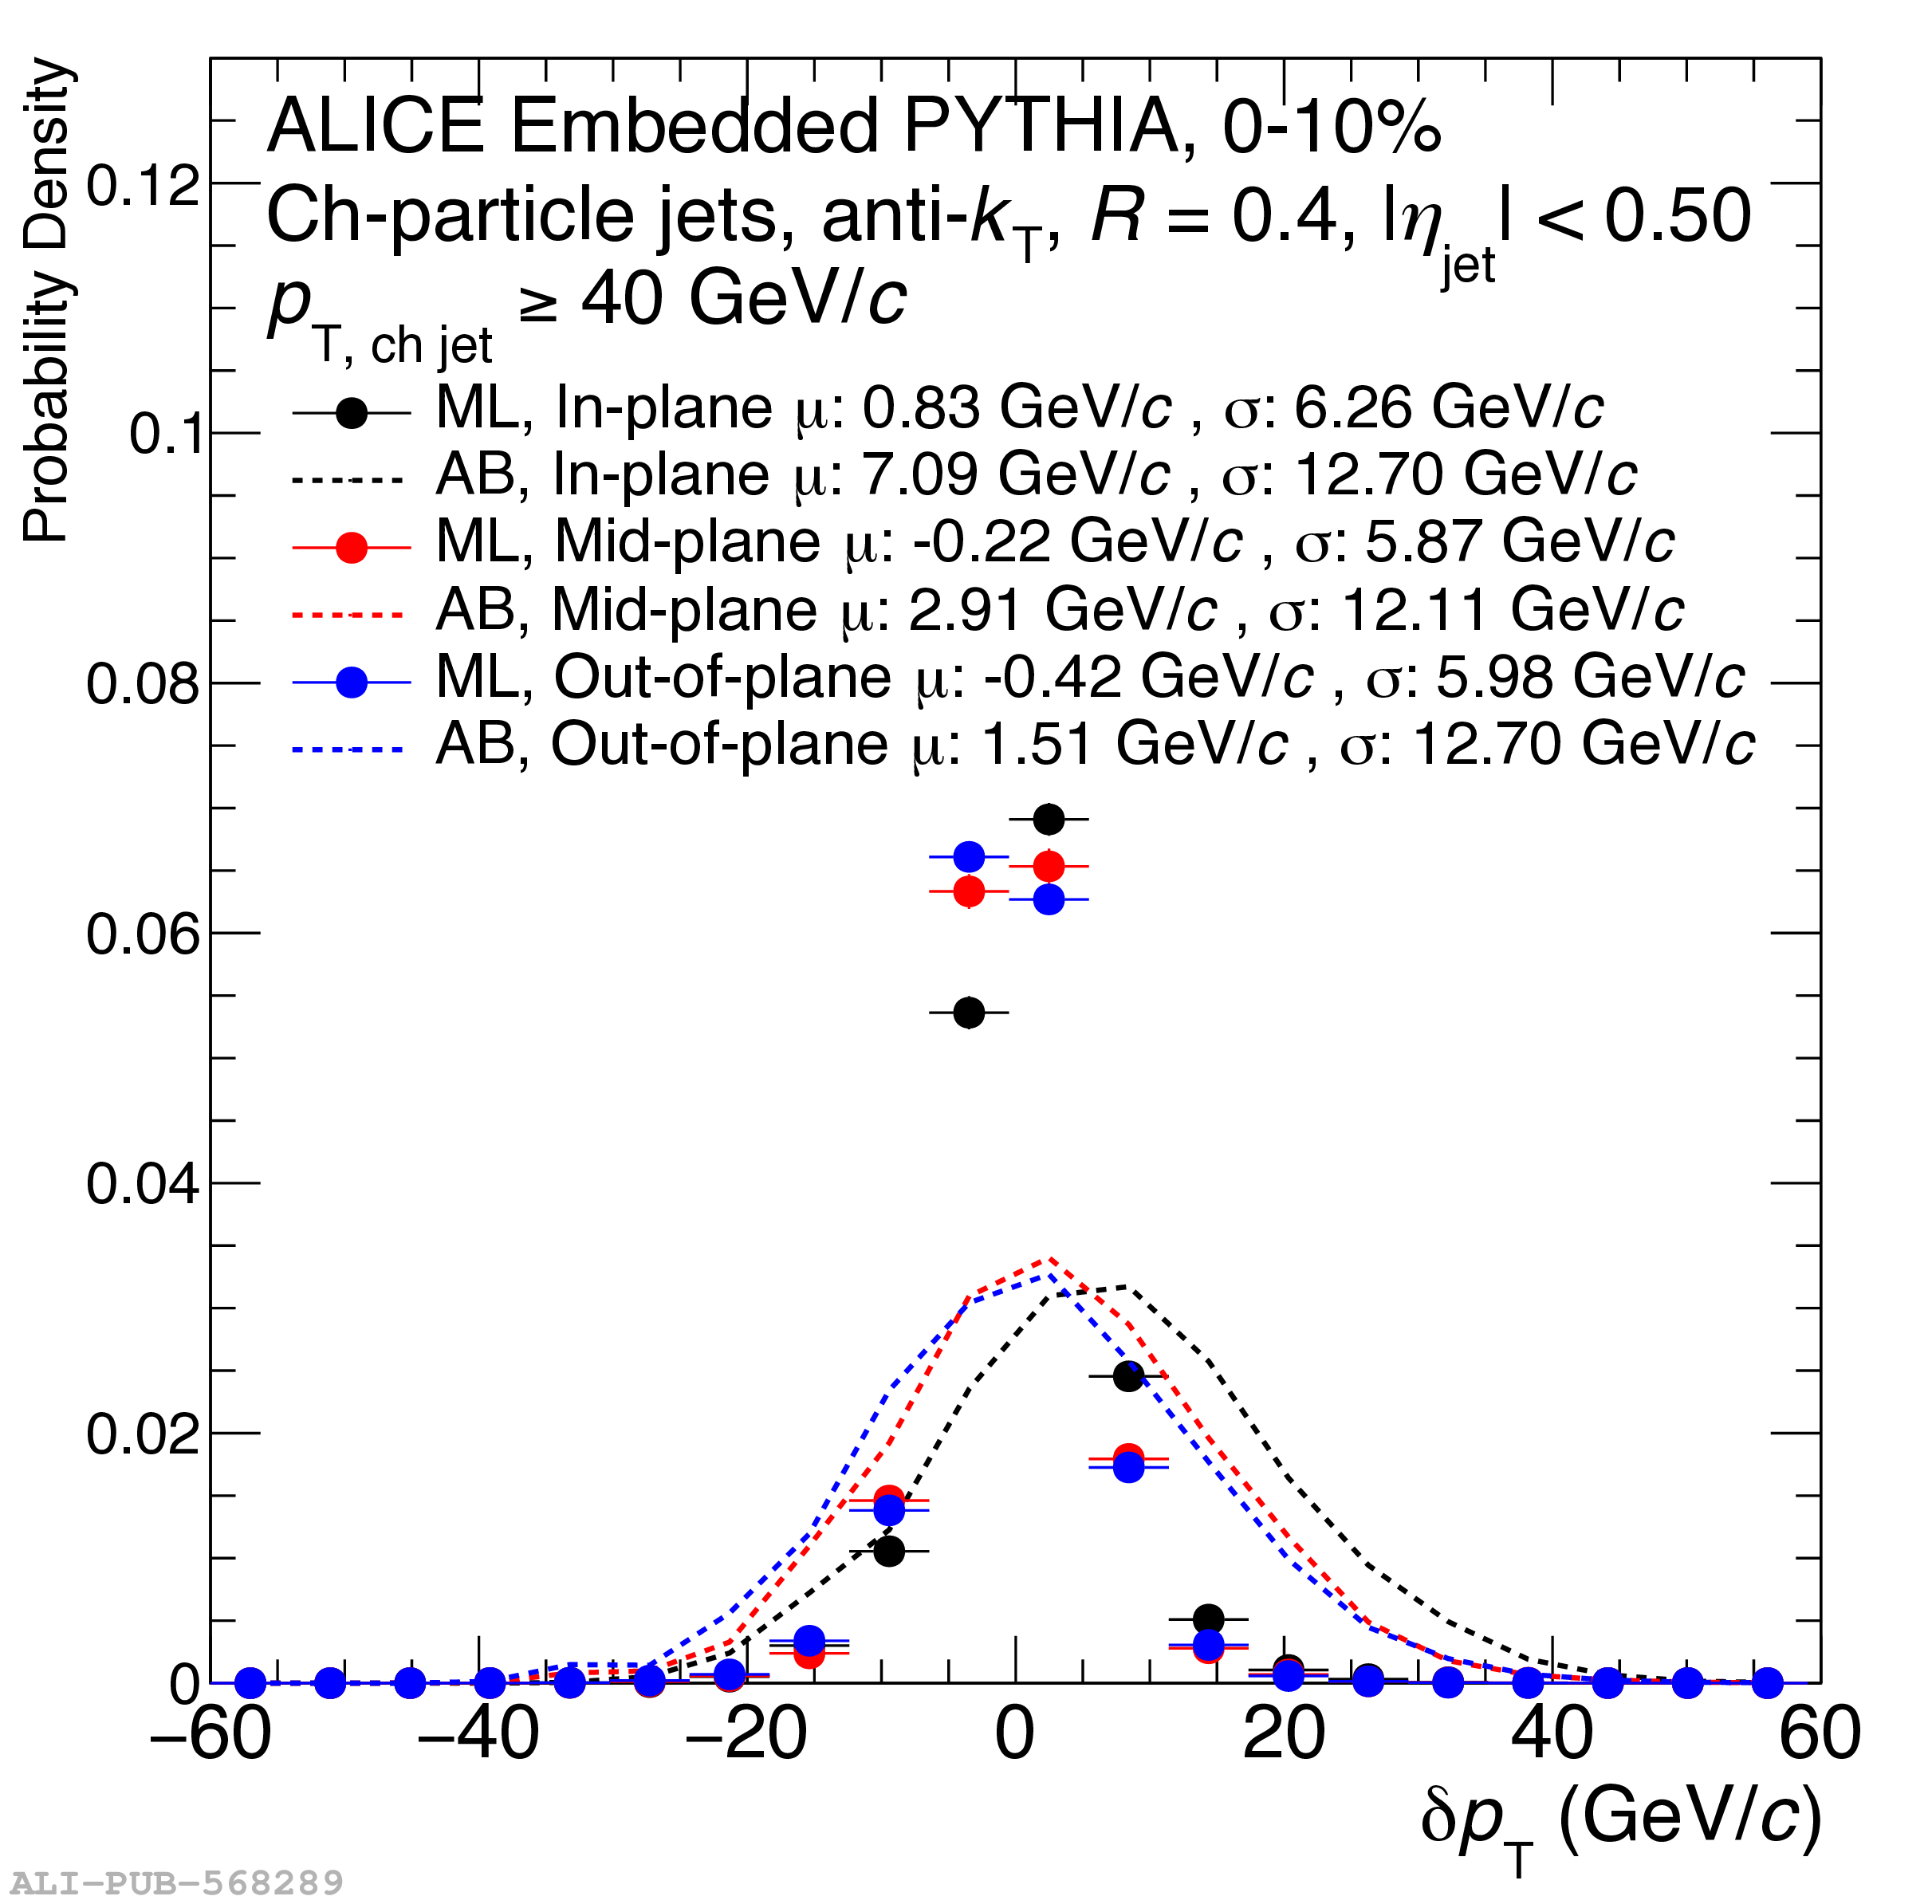
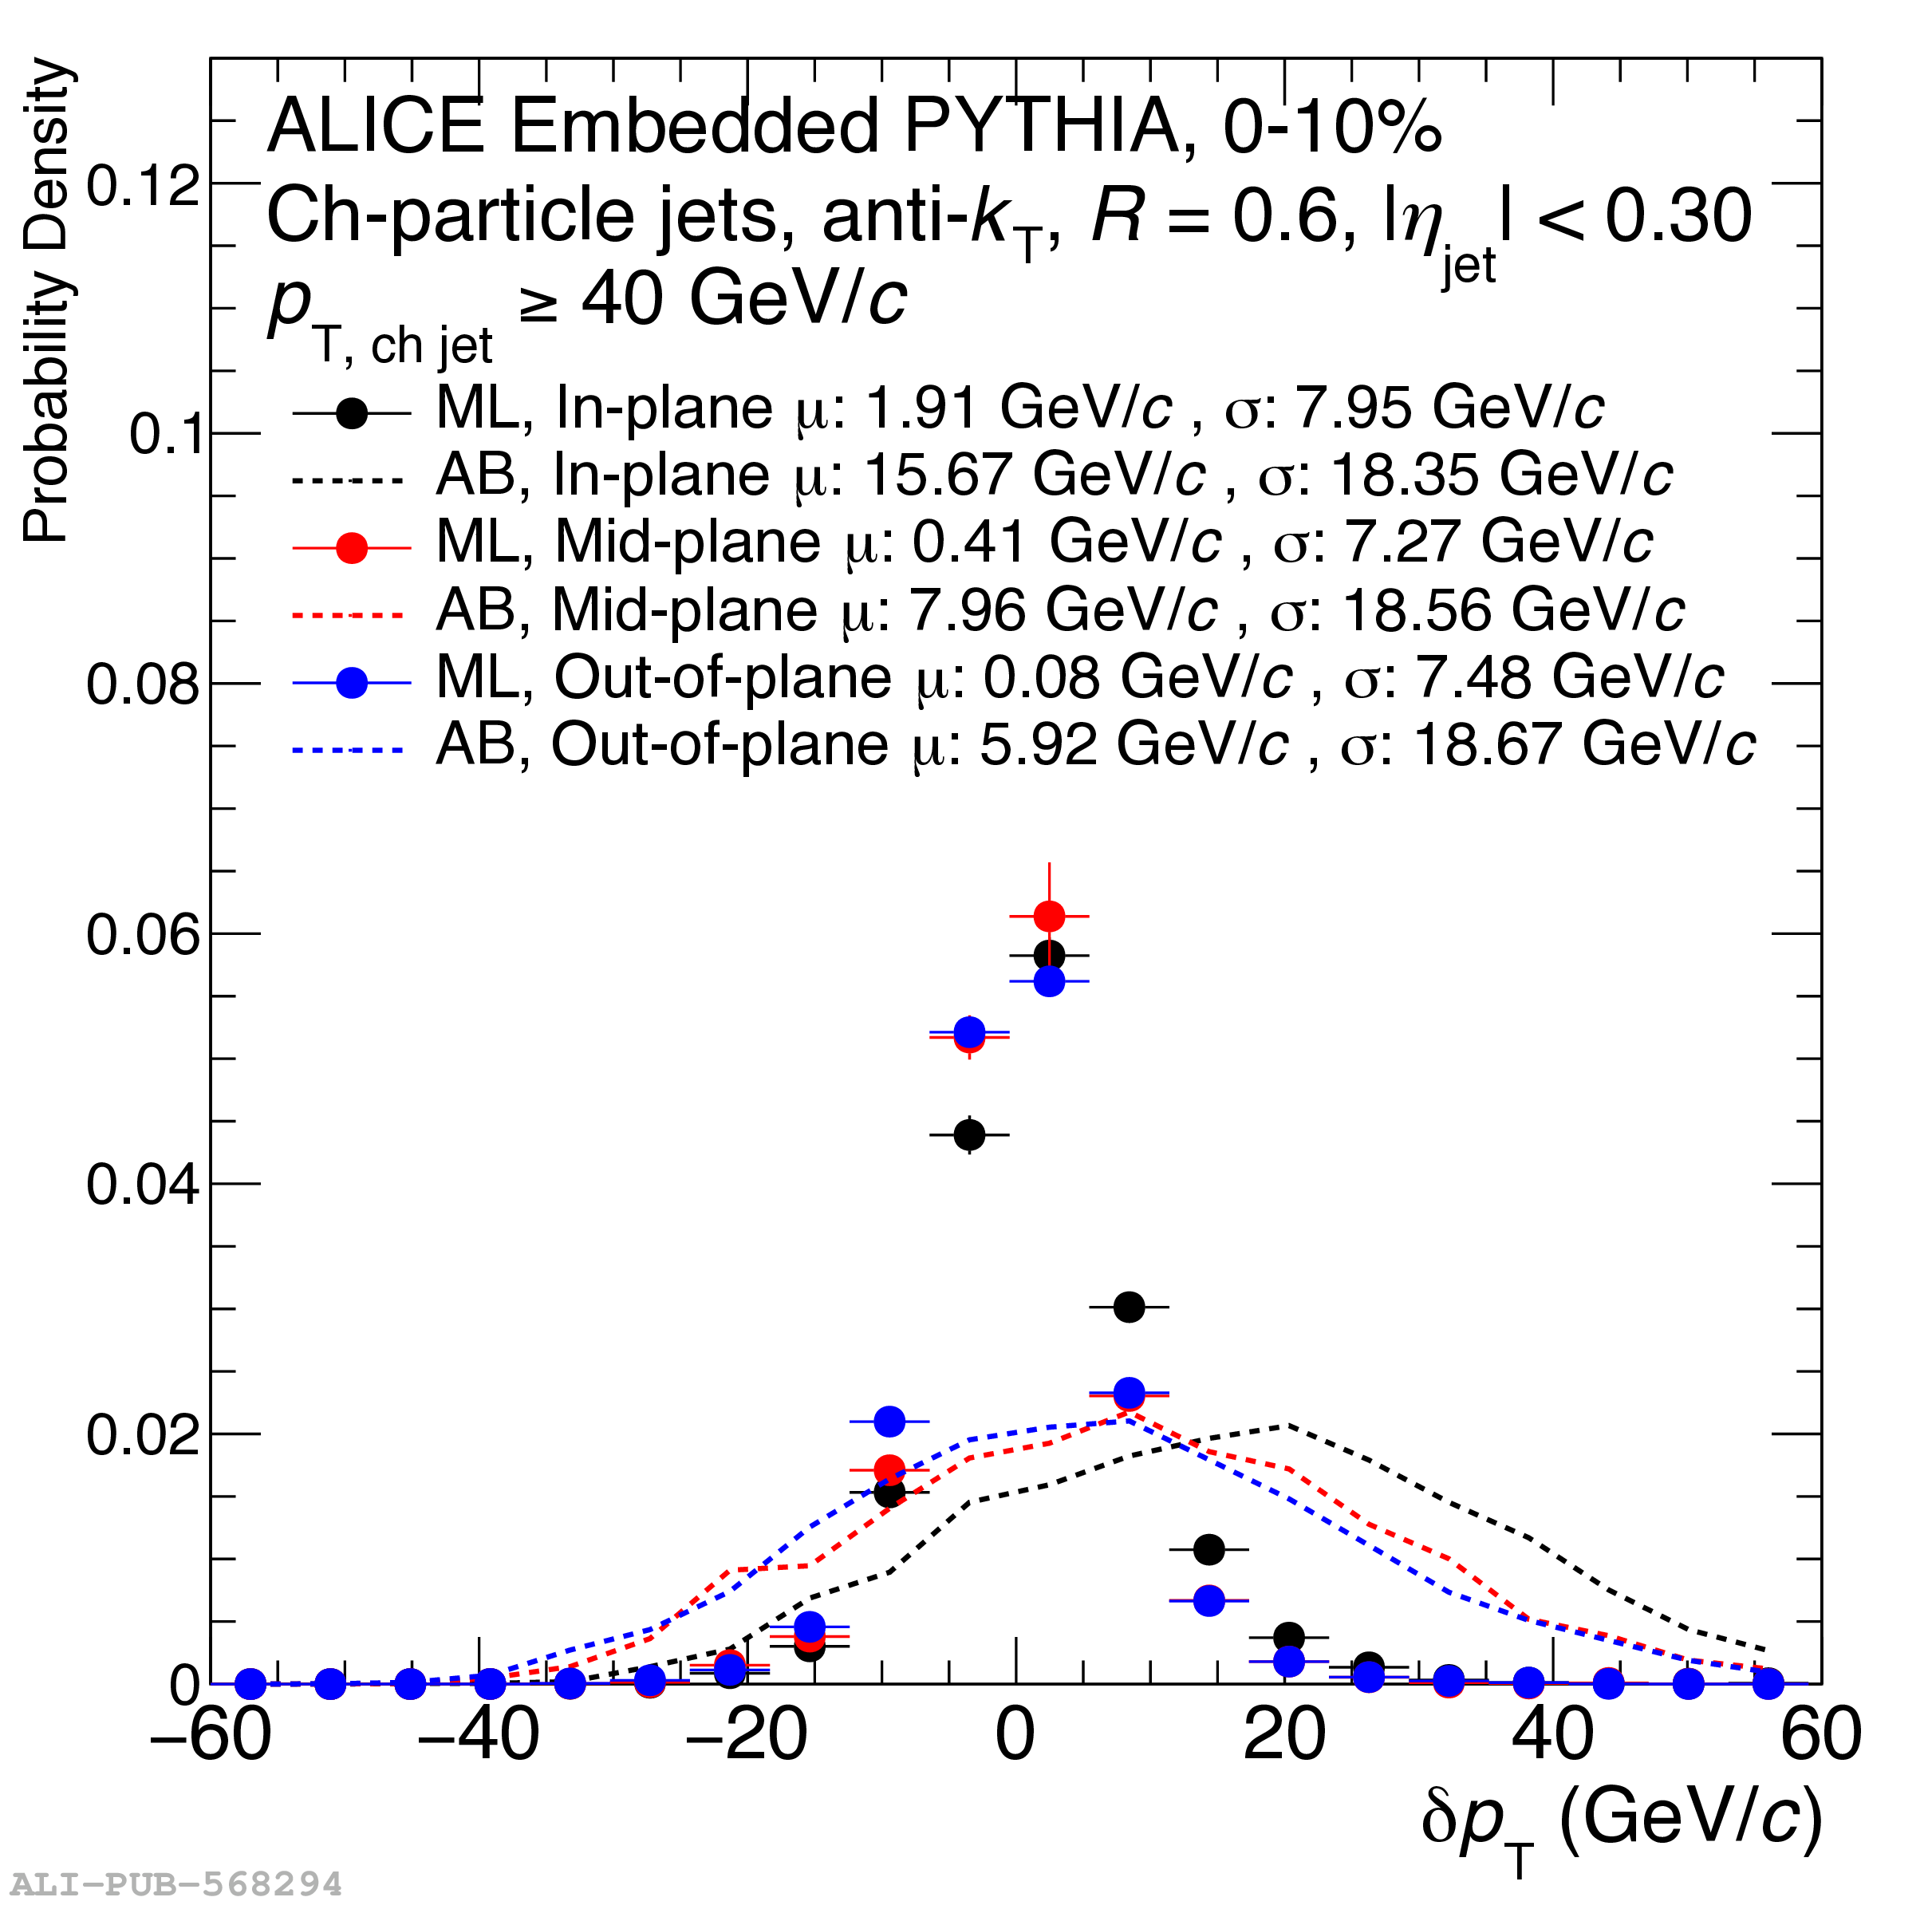
Residual $\pT$-distributions of embedded jet probes of known transverse momentum into \PbPb\ collision data. Left: Comparison of the distributions for the area-based and ML-based background estimators. Note the lines connecting the points do not represent a fit and are only present to guide the eye. Right: Radius dependence of the width of the distributions where the error bars come from the uncertainty in calculating the width. | 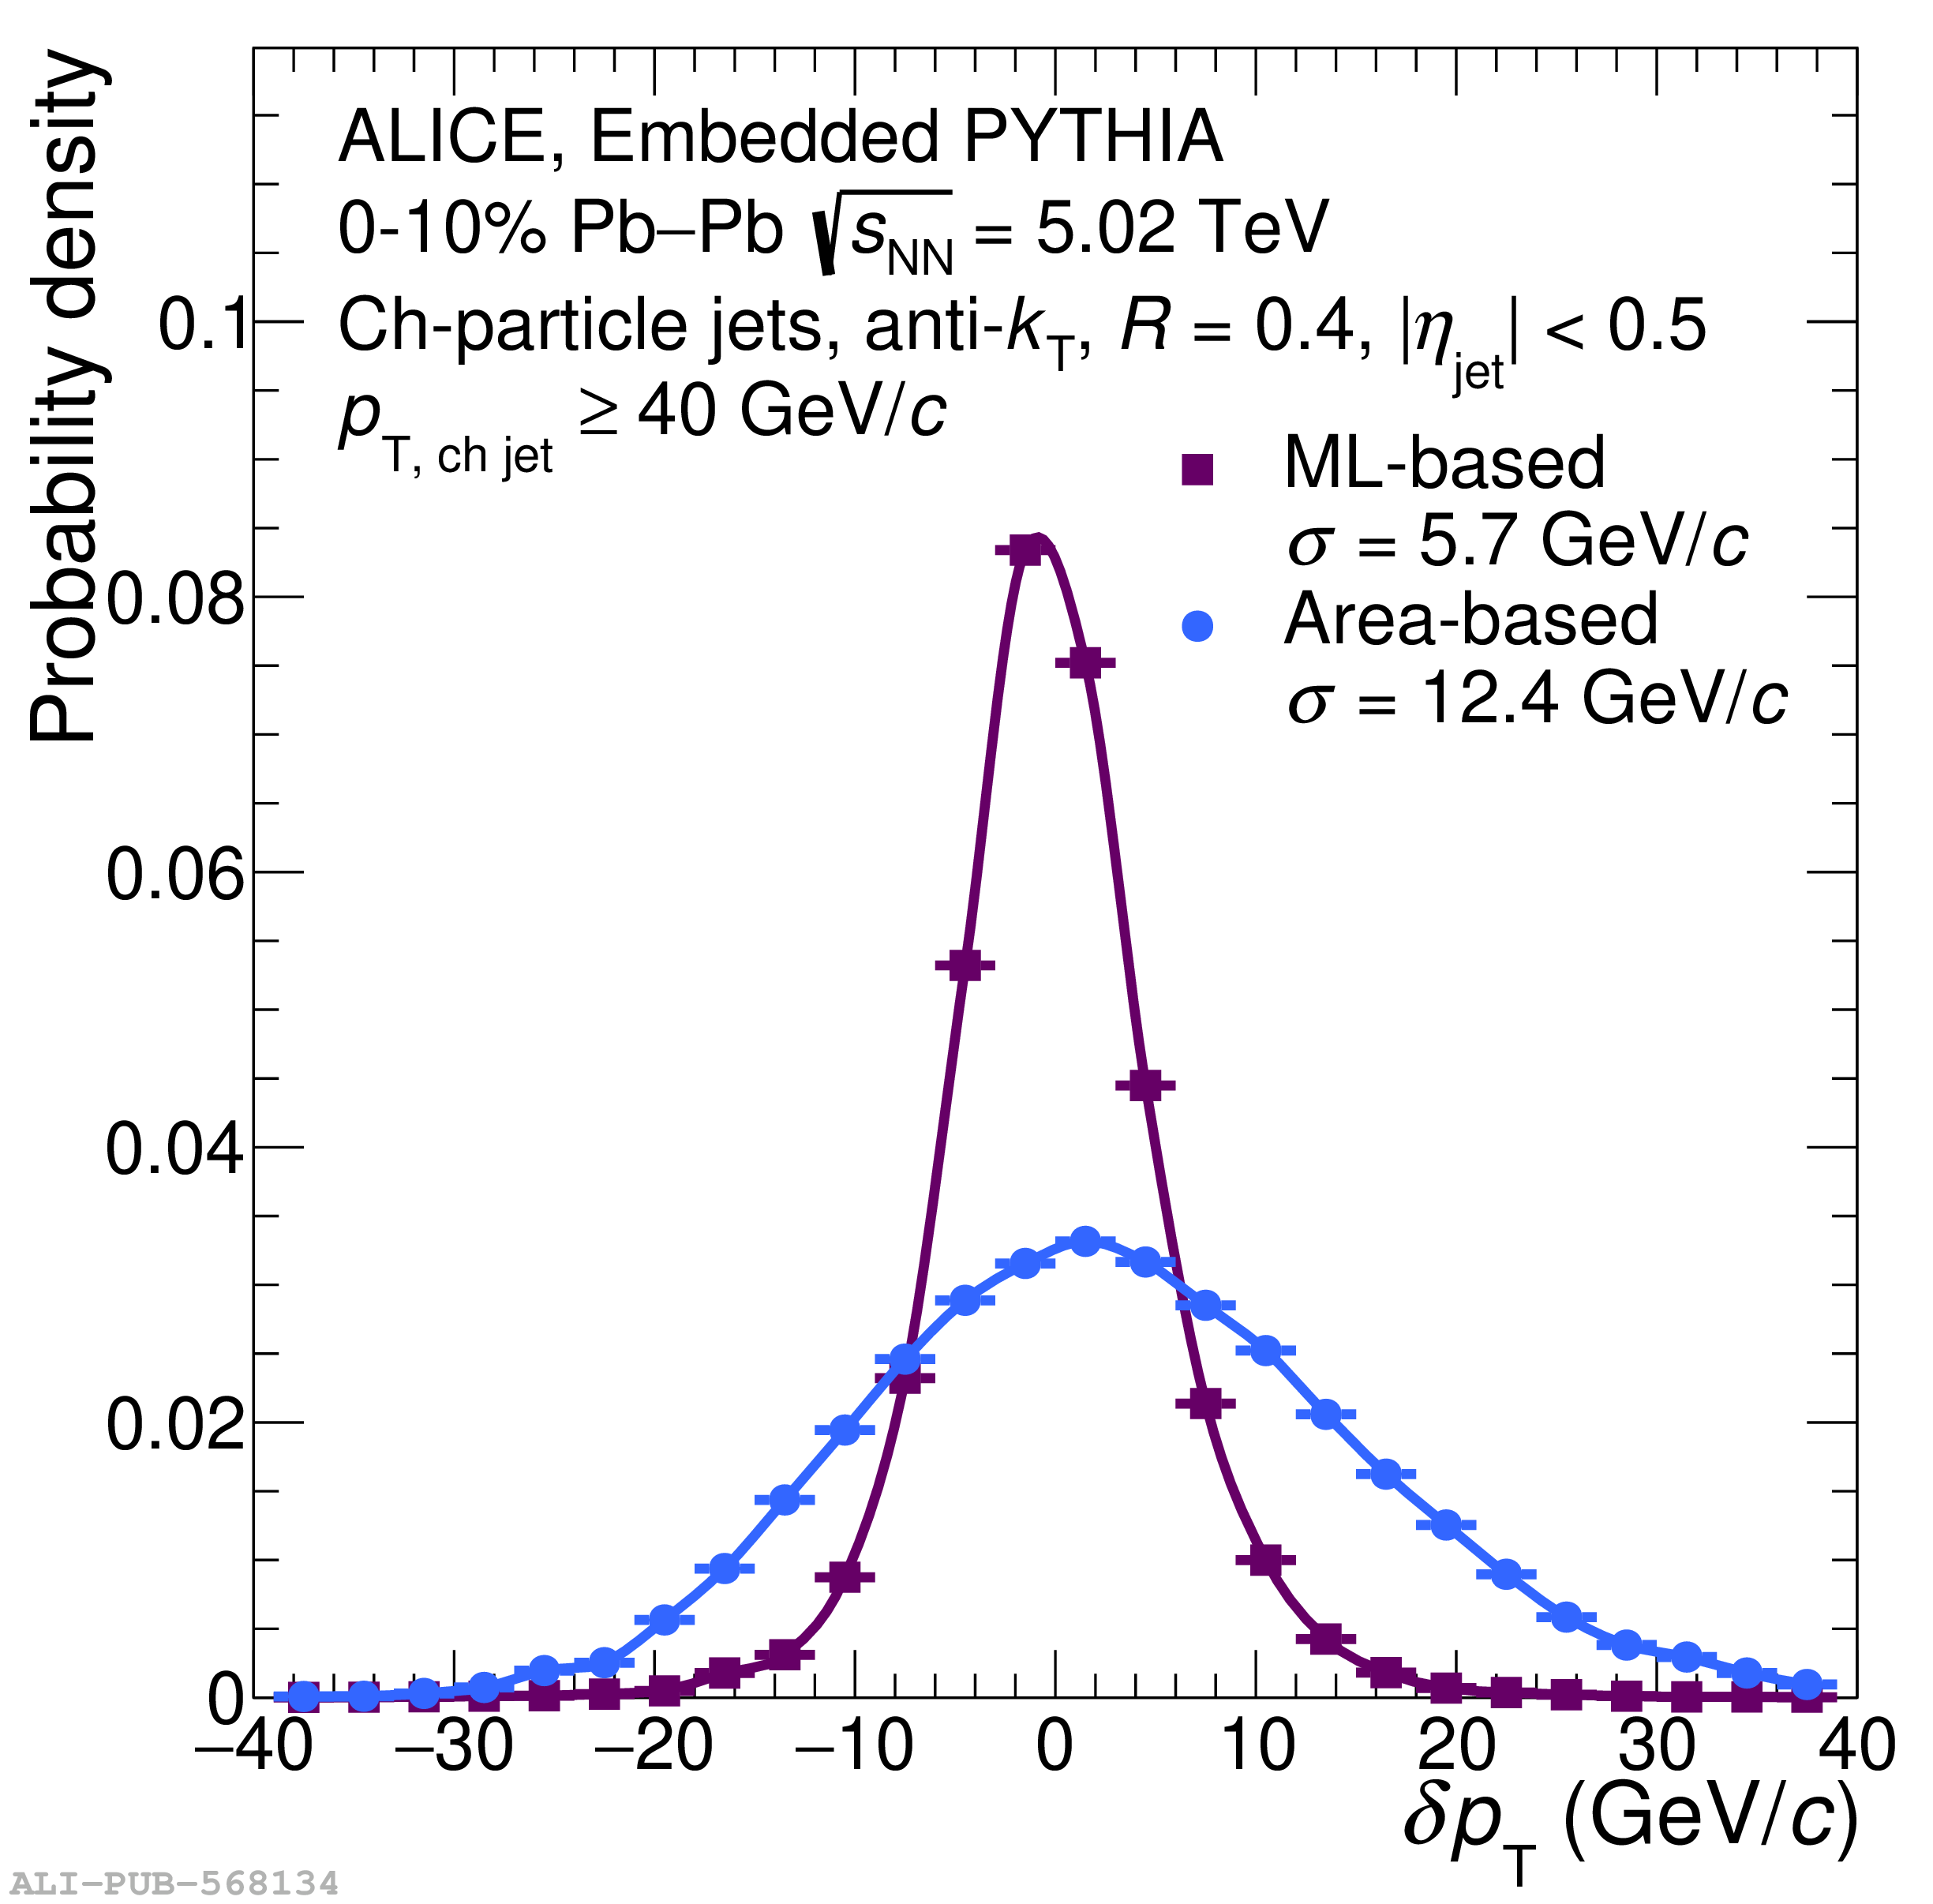 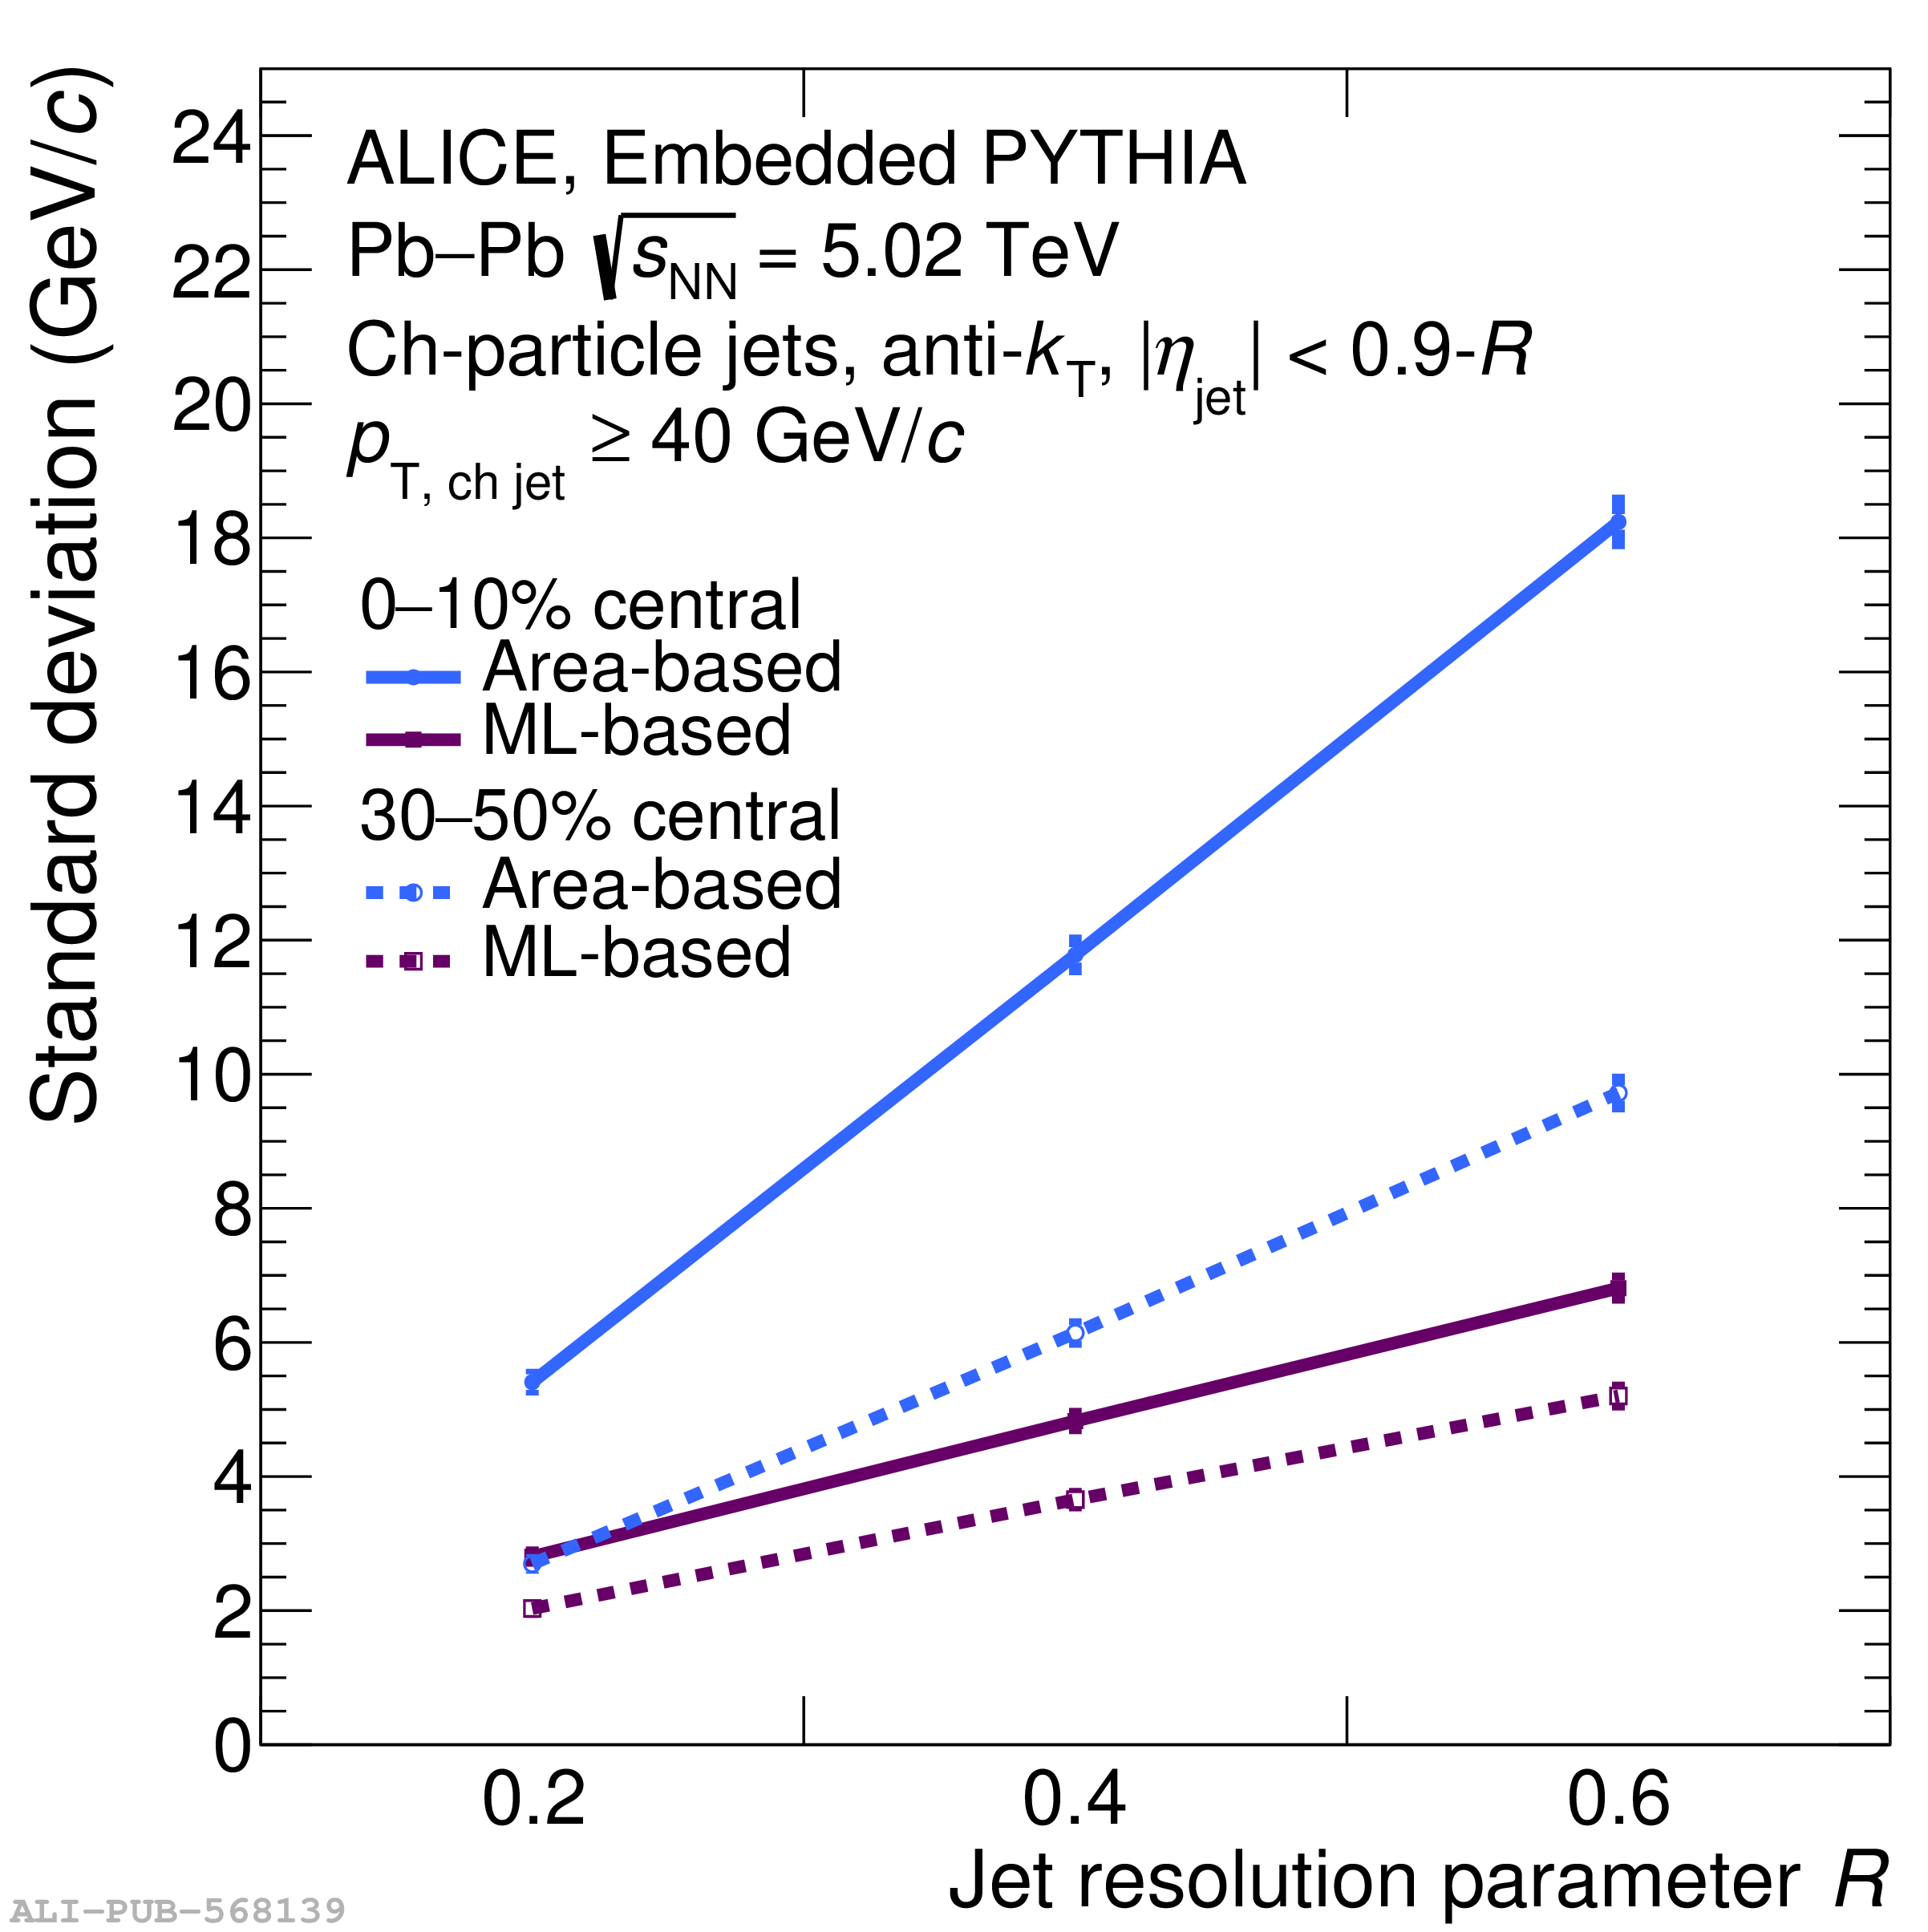 |
Figure 2
Left: Comparison of toy model modifications for $R = 0.4$ jets using the $R_{\rm mod}$ as defined in Eq. 3. Right: The ratio of the modified to unmodified fragmentation functions at low jet $p_{\rm T}$ ($ 40 < p_{\rm T, true} < 100 \text{ GeV}/c$, lower right panel) and high jet $p_{\rm T}$ ($ 100 < p_{\rm T, true} < 200 \text{ GeV}/c$, upper right panel) for 0--10\% central Pb-Pb collisions. In the fractional collinear and fractional large angle case, $f_{\rm loss} = 25\%$ and $p_{\rm loss} = 100\%$. In the medium response case, $f_{\rm loss} = 10\%$ and $p_{\rm loss} = 50\%$ The ratio of the fragmentation functions measured in Pb--Pb and pp collisions are shown for jets with $R=0.4$ and $\pt>100$ GeV/$c$ (ATLAS), and for jets with $R=0.3$ and $p_{\rm T} > 30$ GeV/$c$ recoiling from a photon with $E_{\rm T}>60$ GeV/$c$ (CMS). | 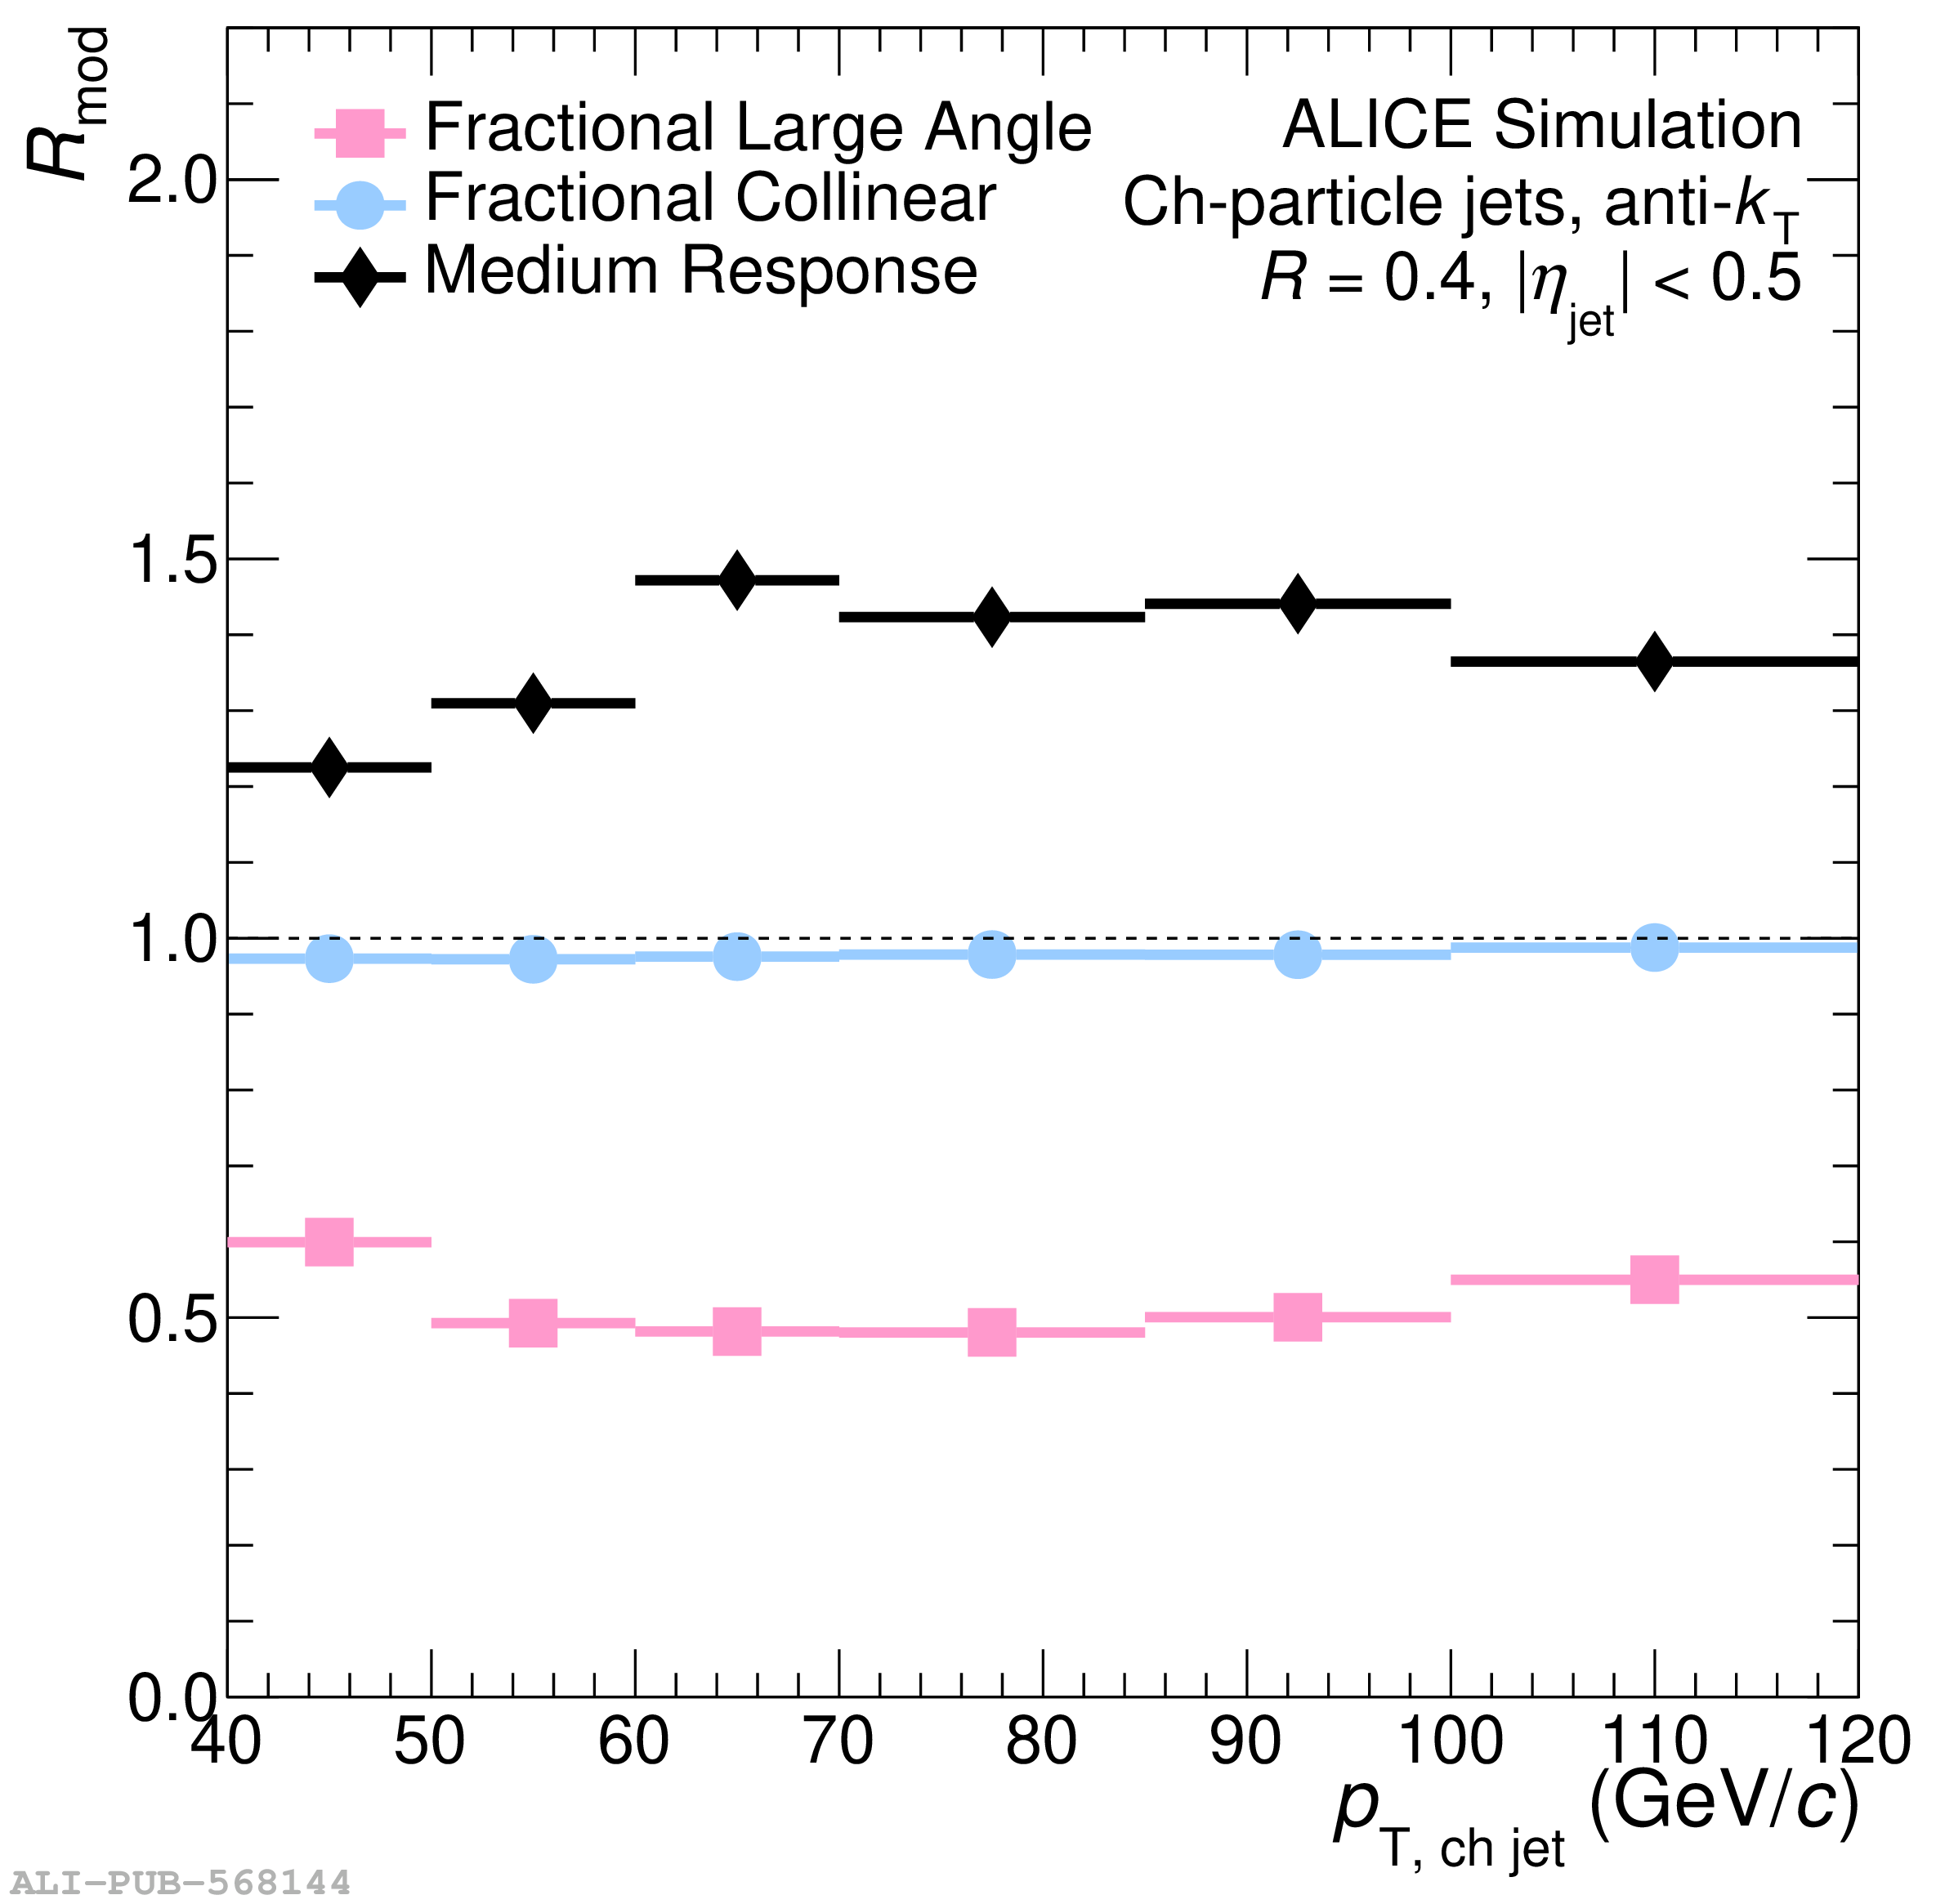 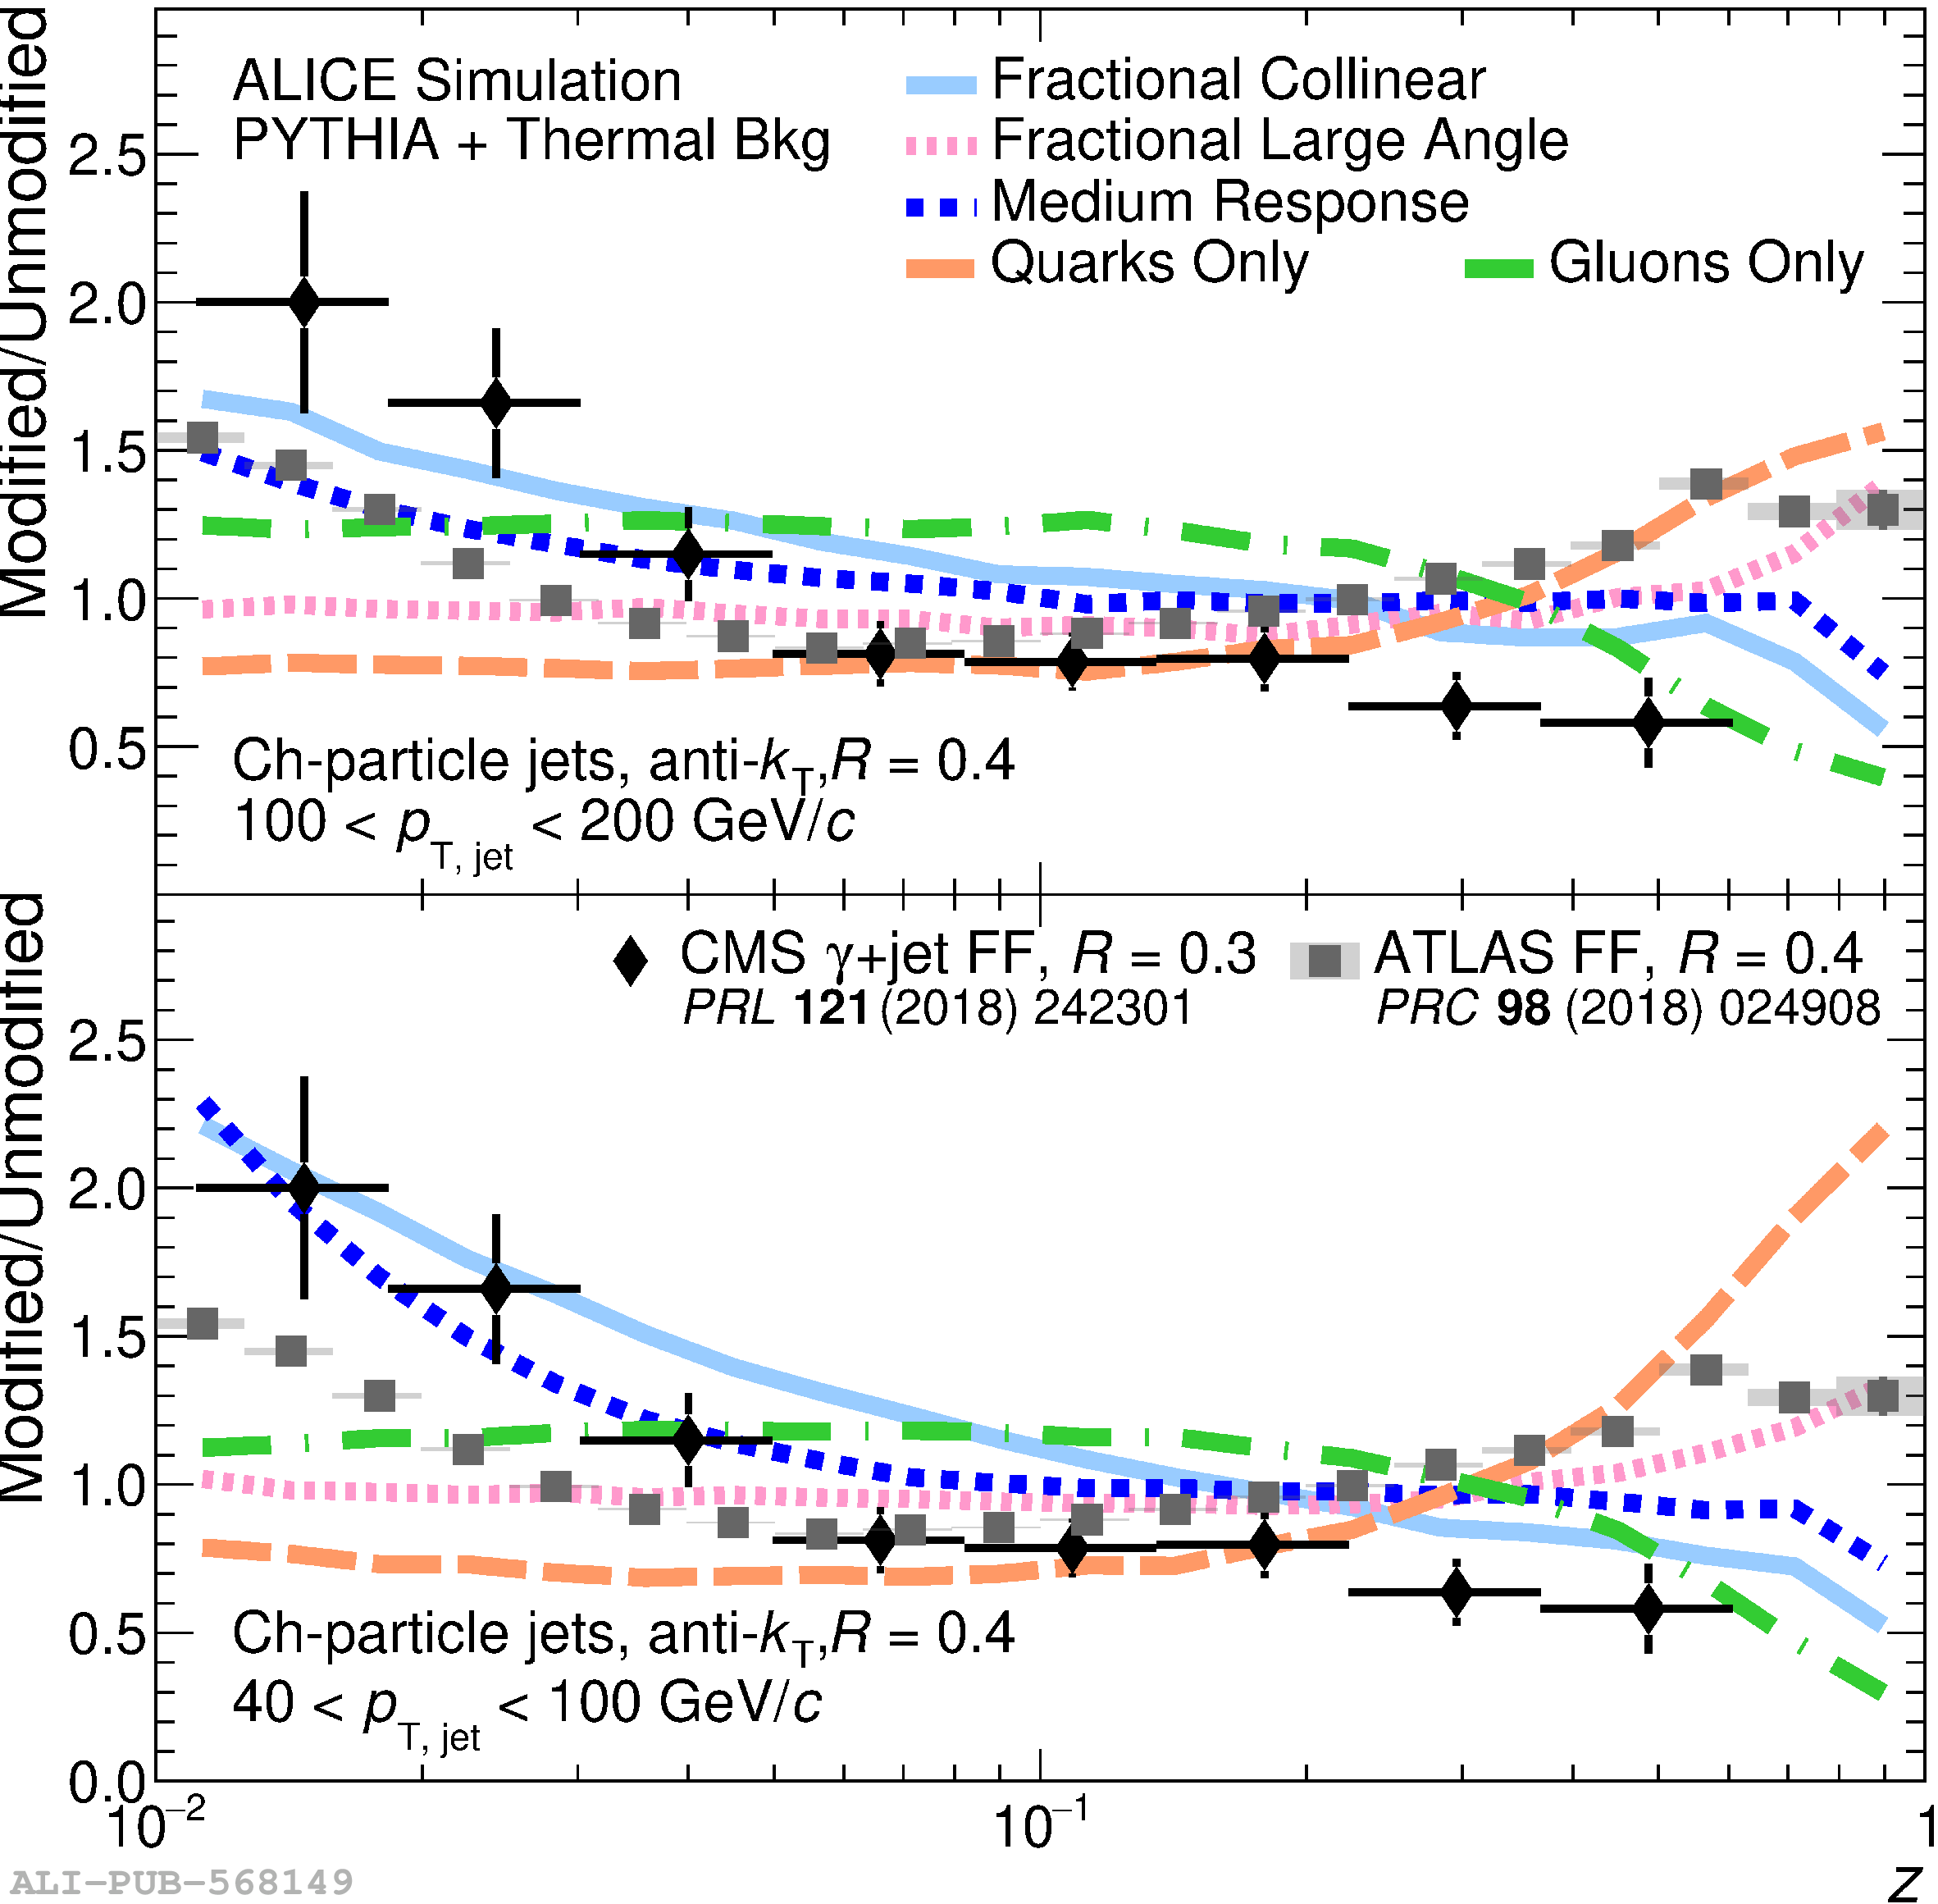 |
Figure 3
The $\pT$-differential inclusive charged-particle jet yield distributions as a function of $\pT$ for different values of $R$ in three centrality classes: Top Left: 0--10\%, top right: 30--50\%, bottom left: 60--80\%. The peripheral spectra were measured using the area-based method for the background correction. All other reported spectra were corrected with the ML-based background estimator. In the bottom right panel, the production cross sections in pp collisions are shown. The vertical bars denote statistical uncertainties and the vertical extent of the boxes denotes systematic uncertainties. Note that the data points are plotted horizontally at the bin center. | 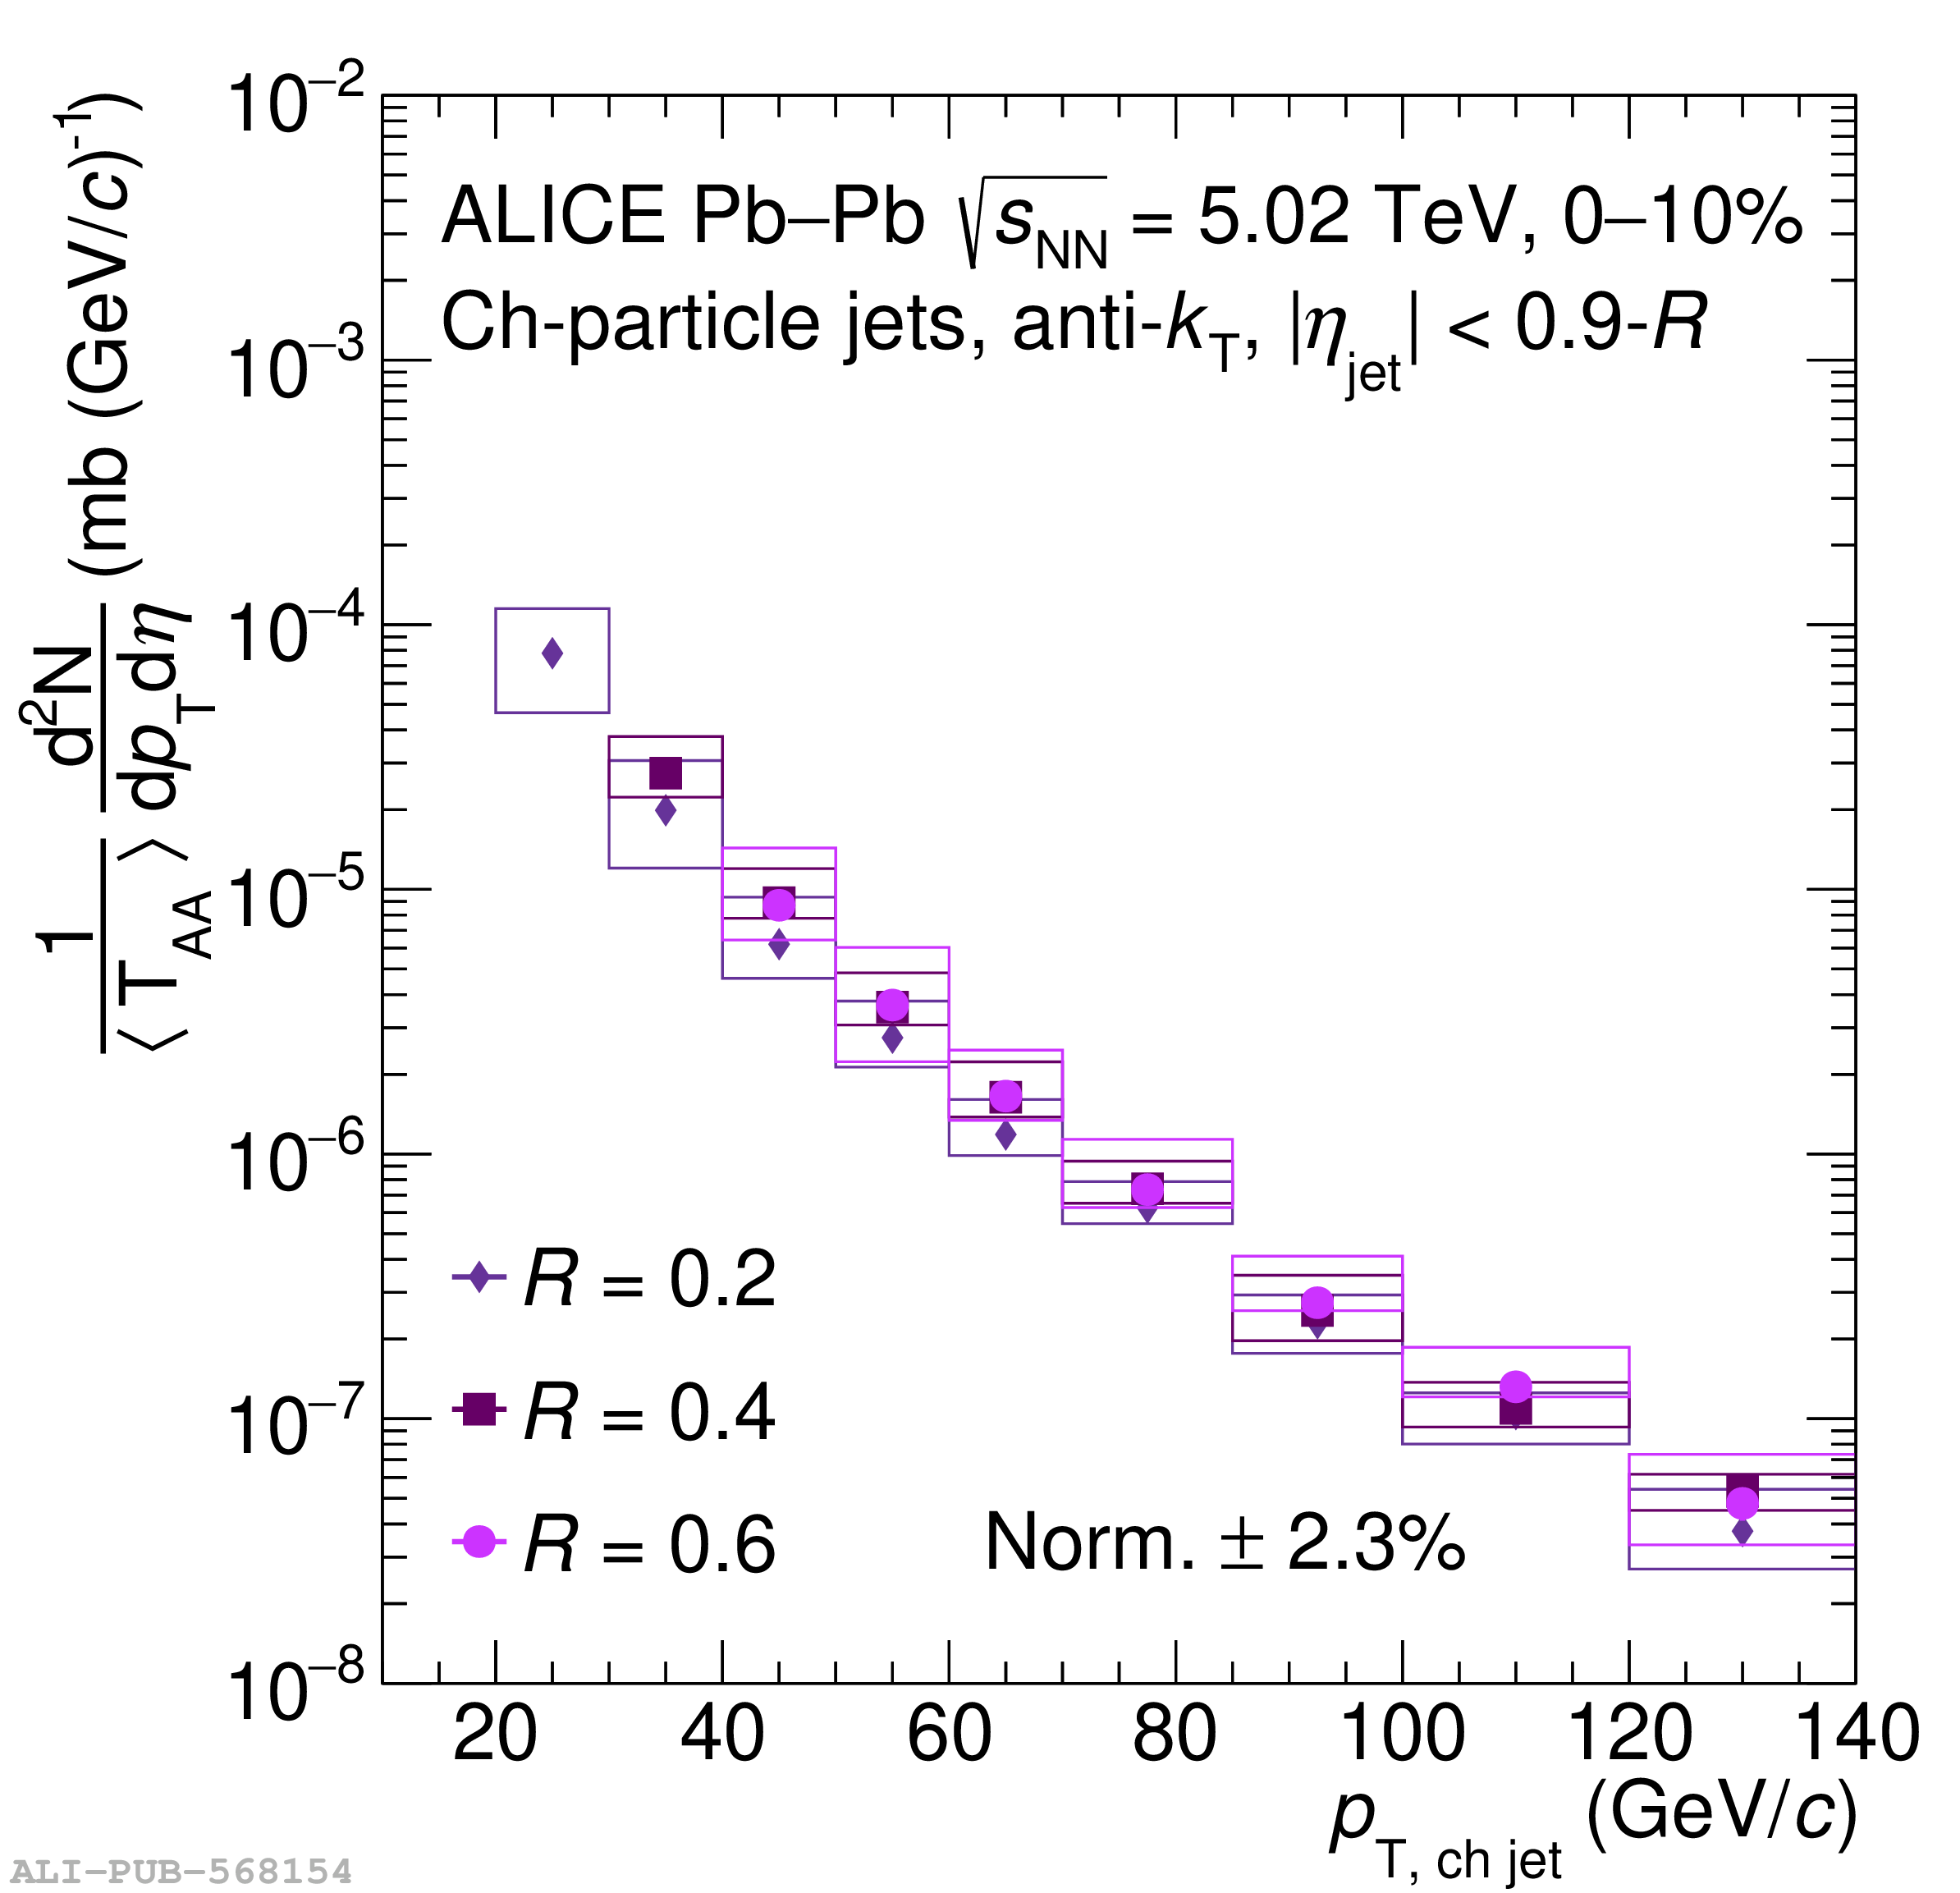 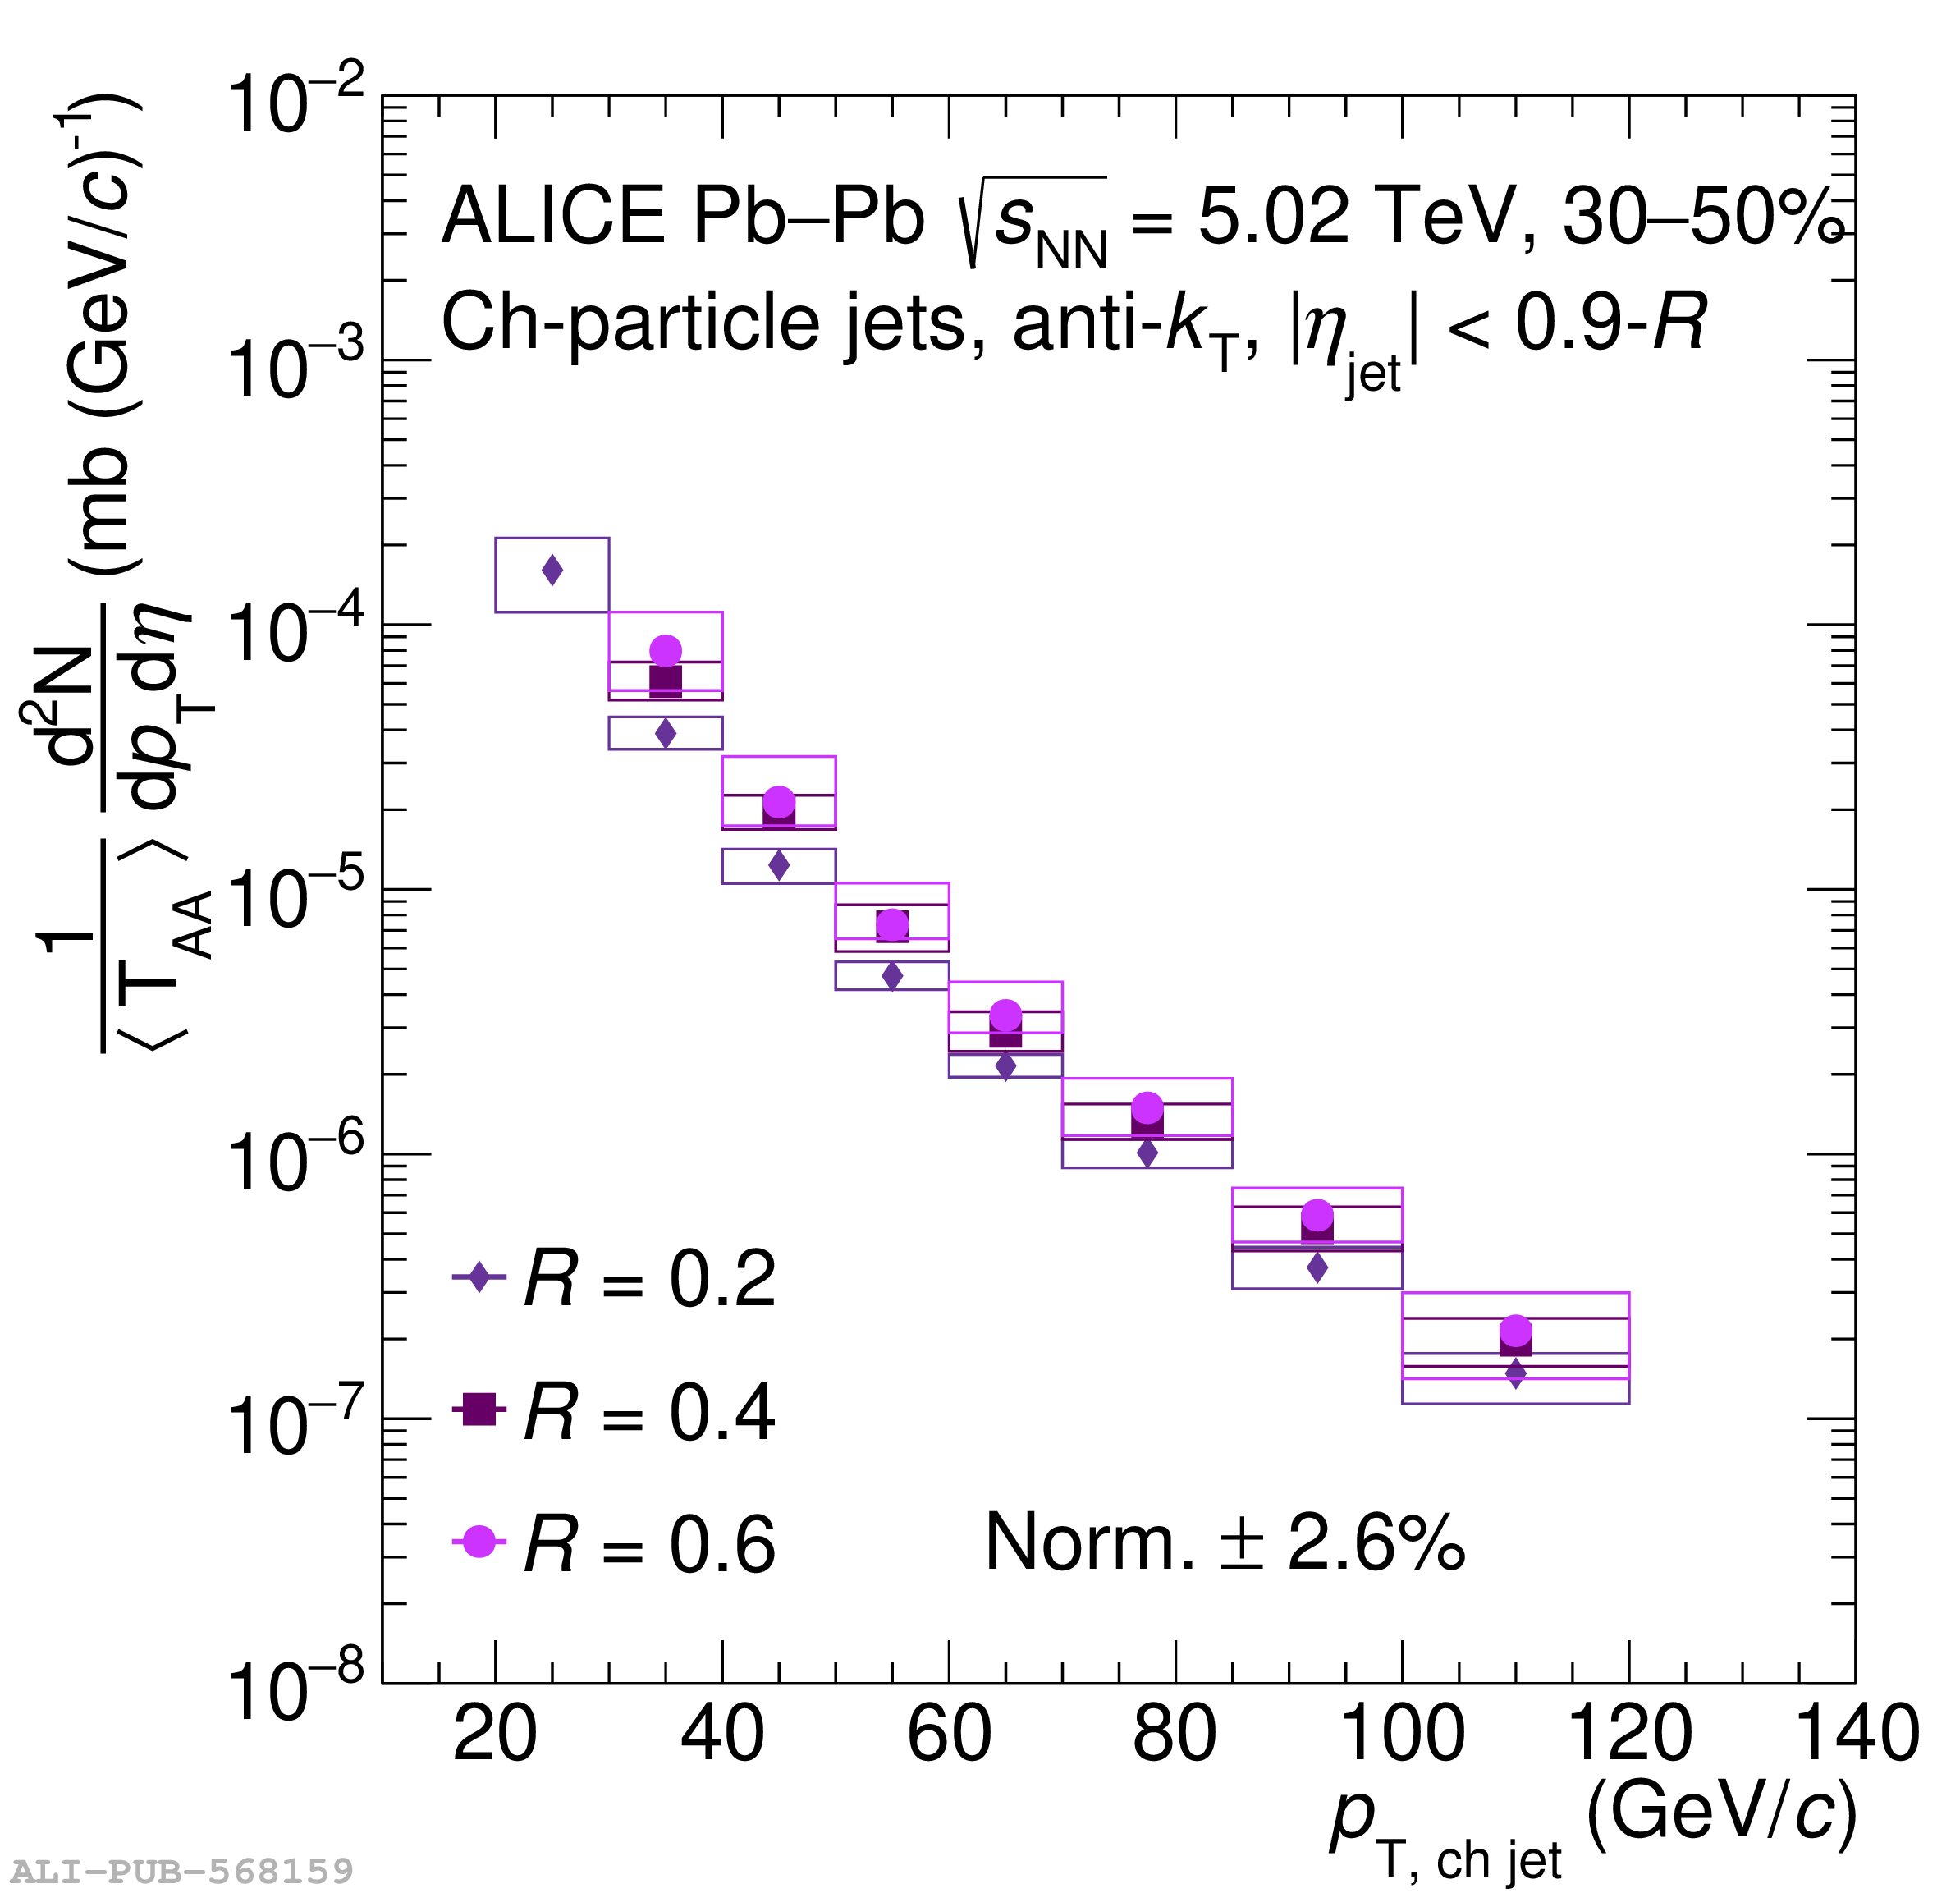 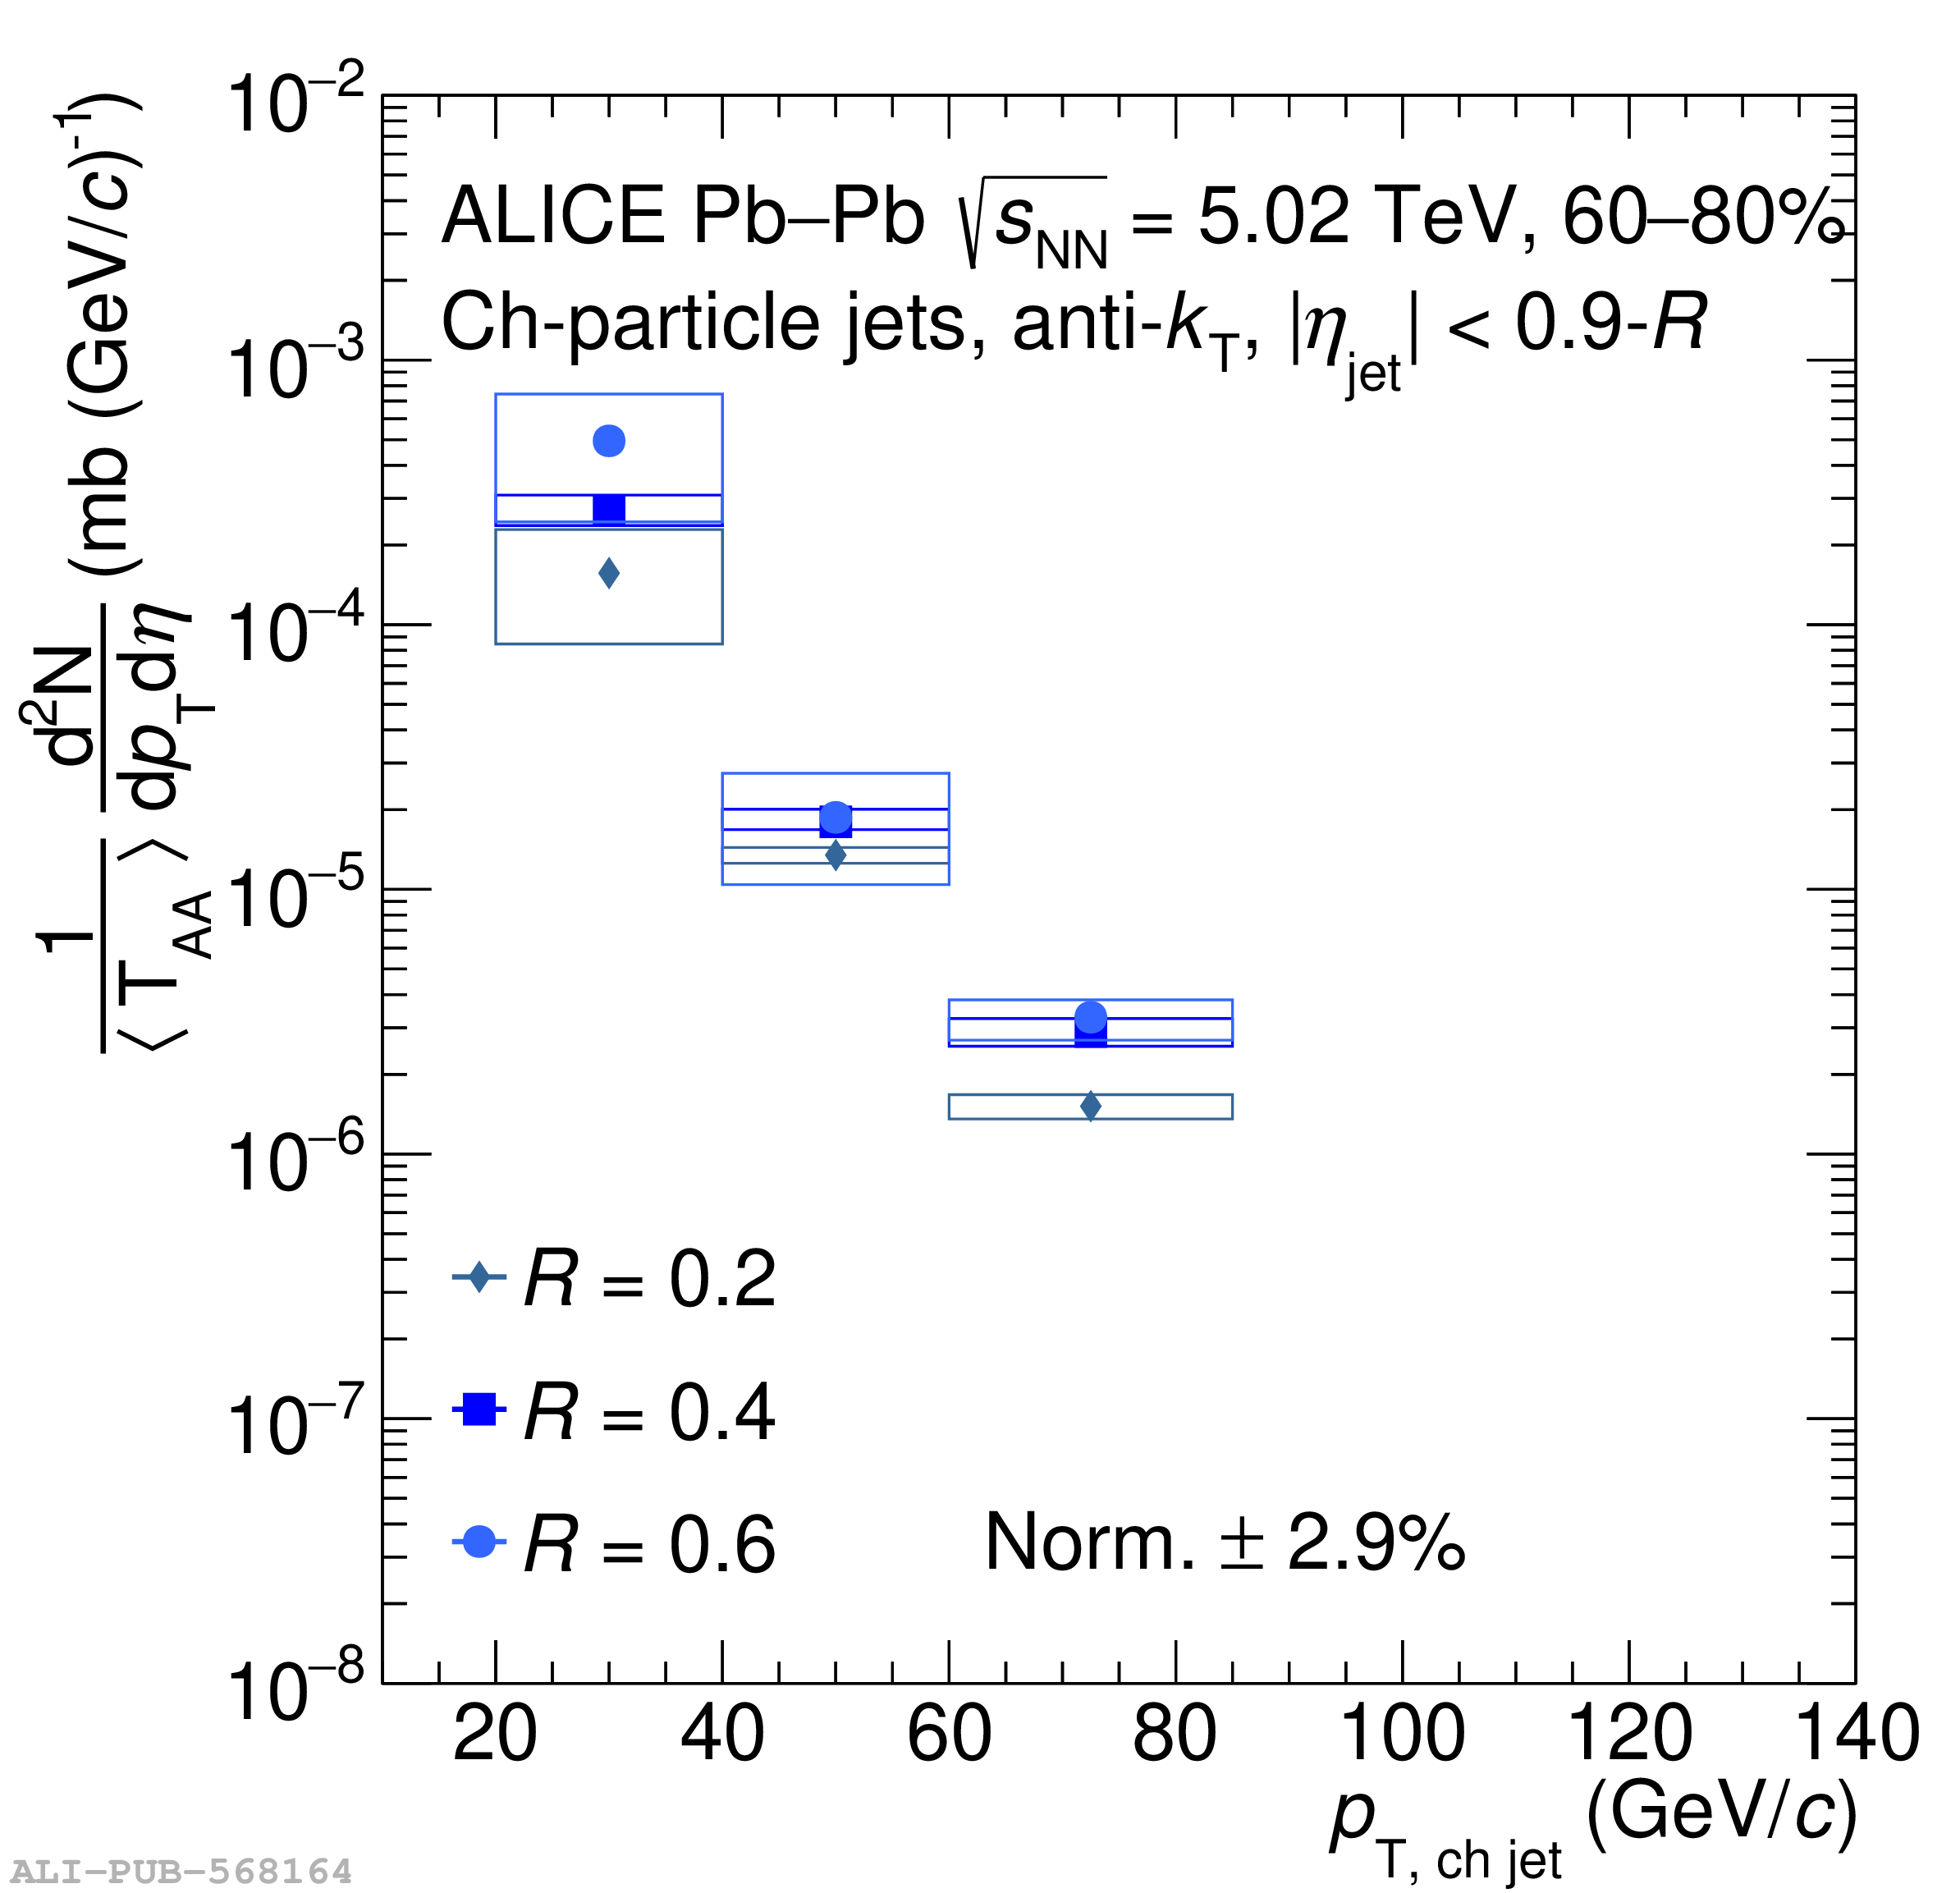 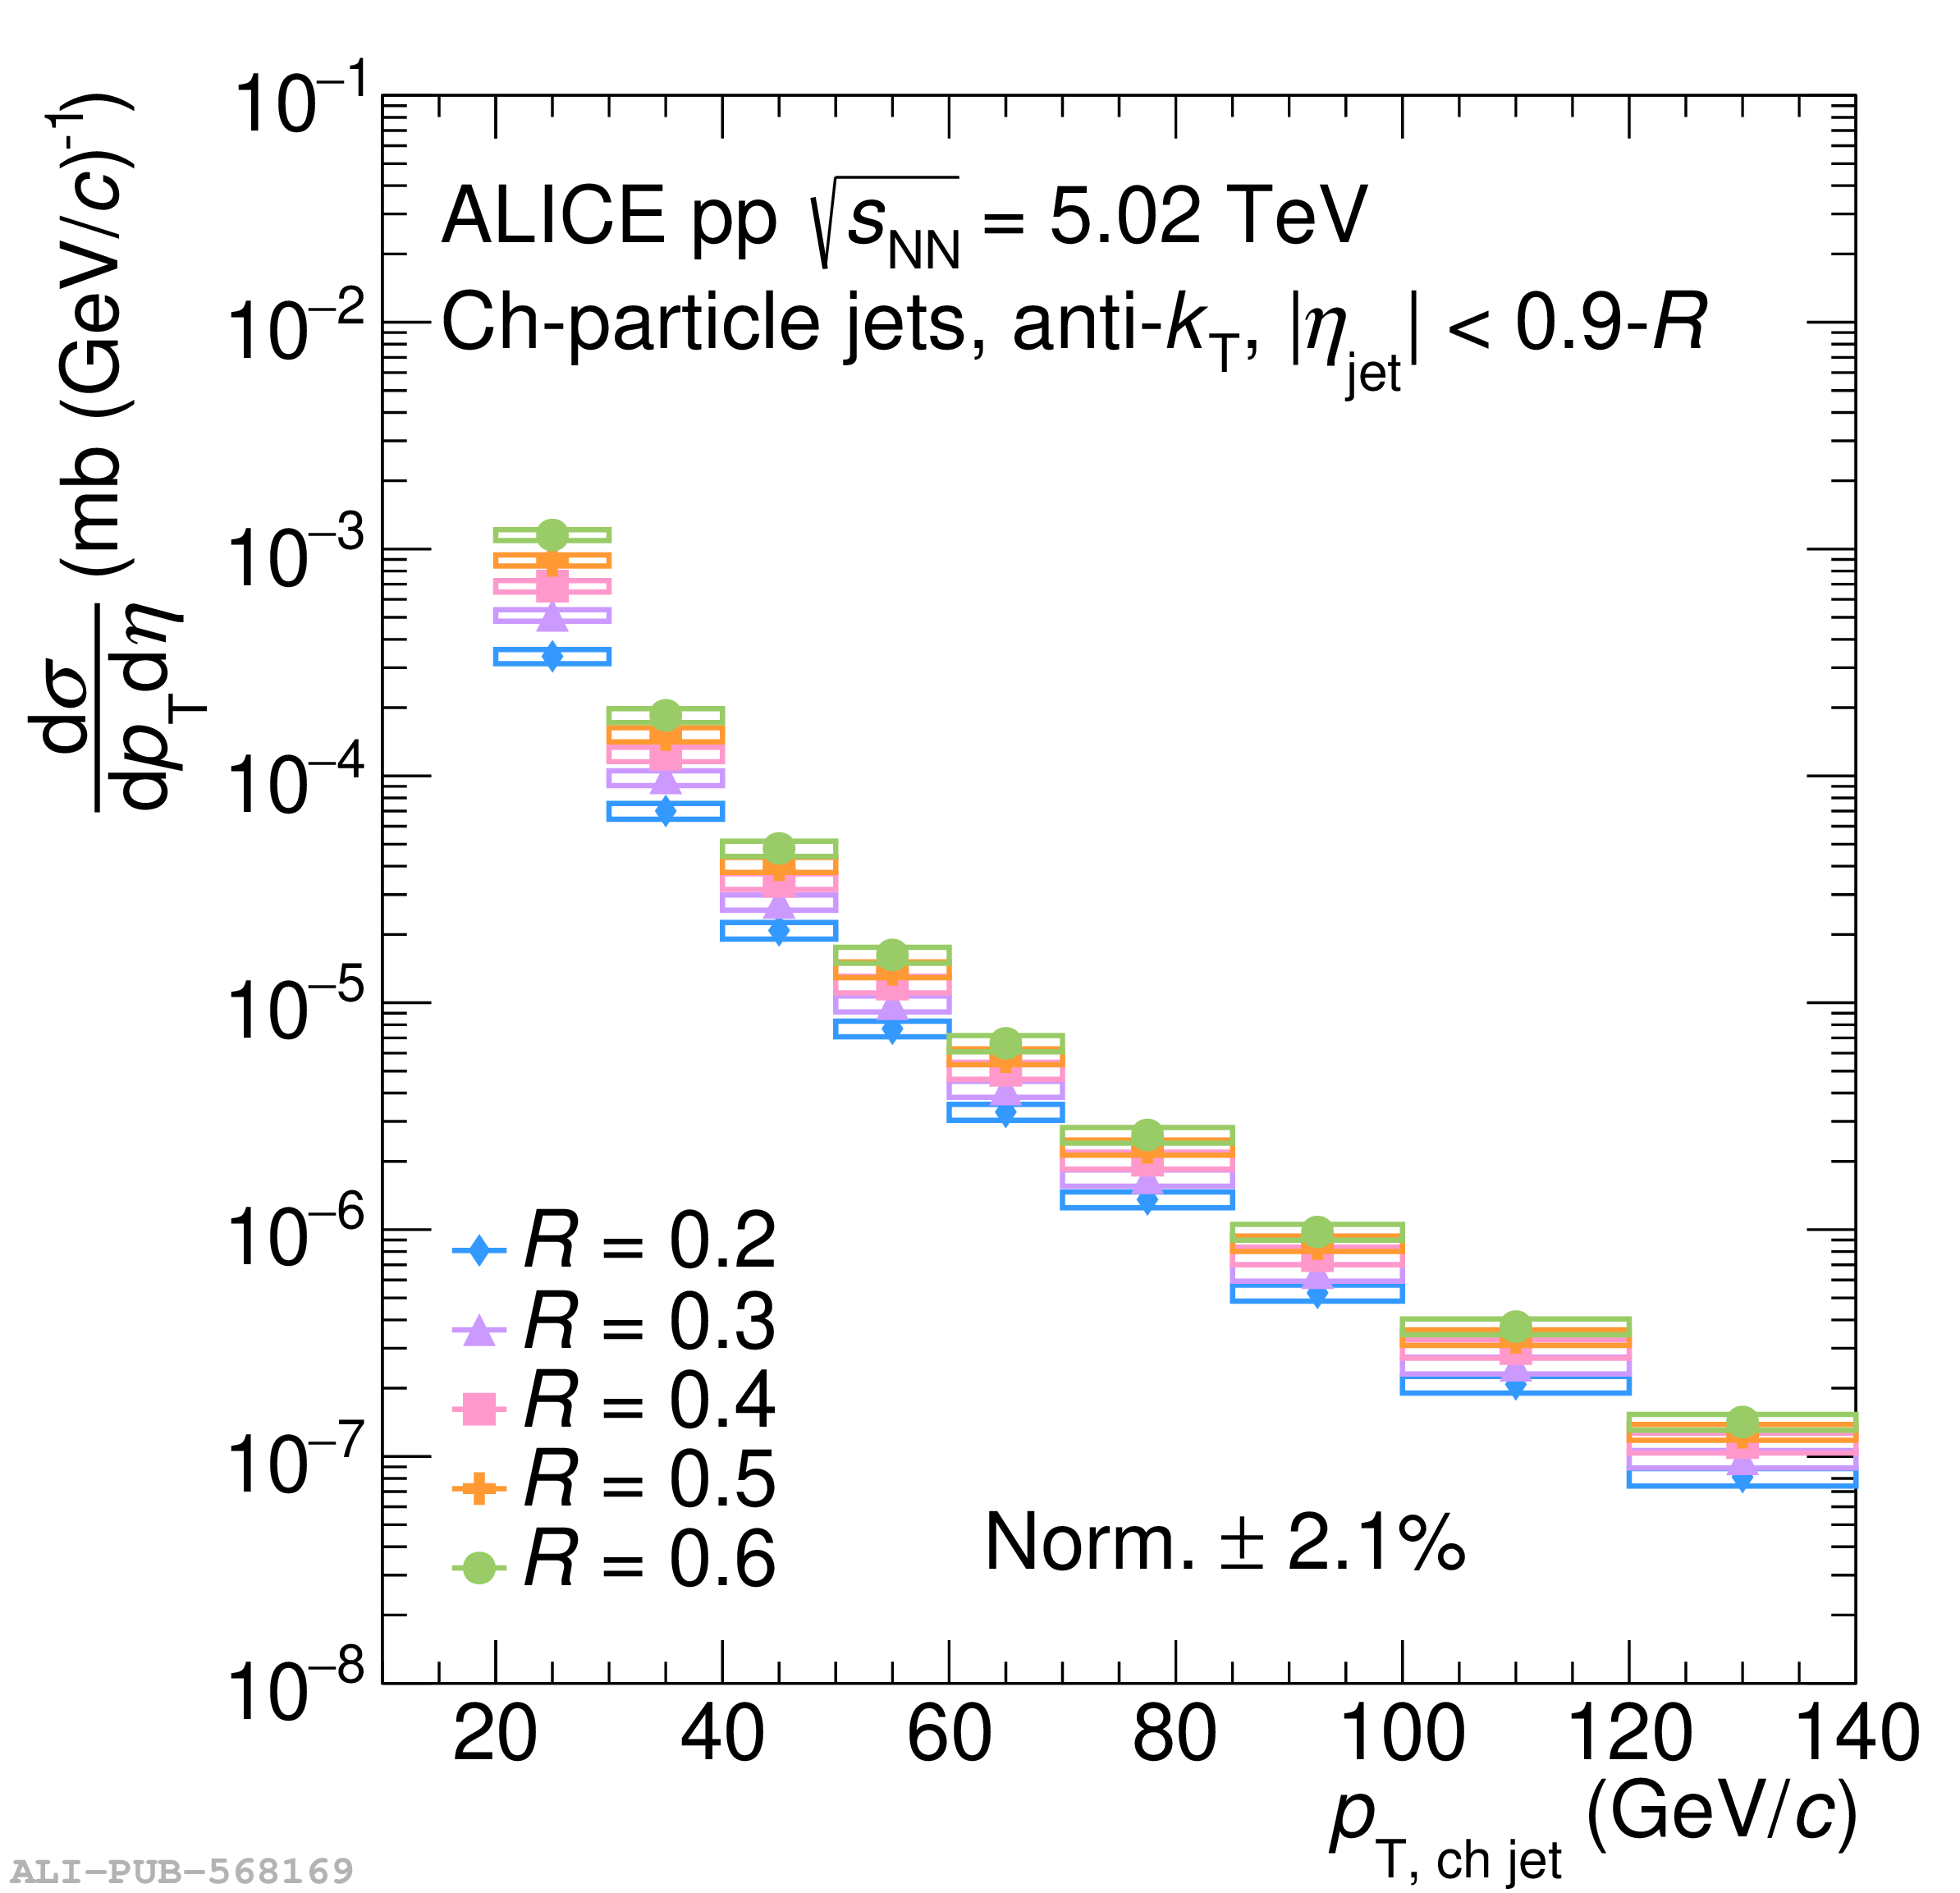 |
Figure 4
Nuclear modification factors of inclusive charged-particle jets as a function of $\pT$ for $R=0.2$, $R=0.4$, and $R=0.6$, shown for 0--10\%, 30--50\% and 60--80\% central Pb-Pb collisions for the ML-based method compared to results obtained with the area-based method where applicable. | 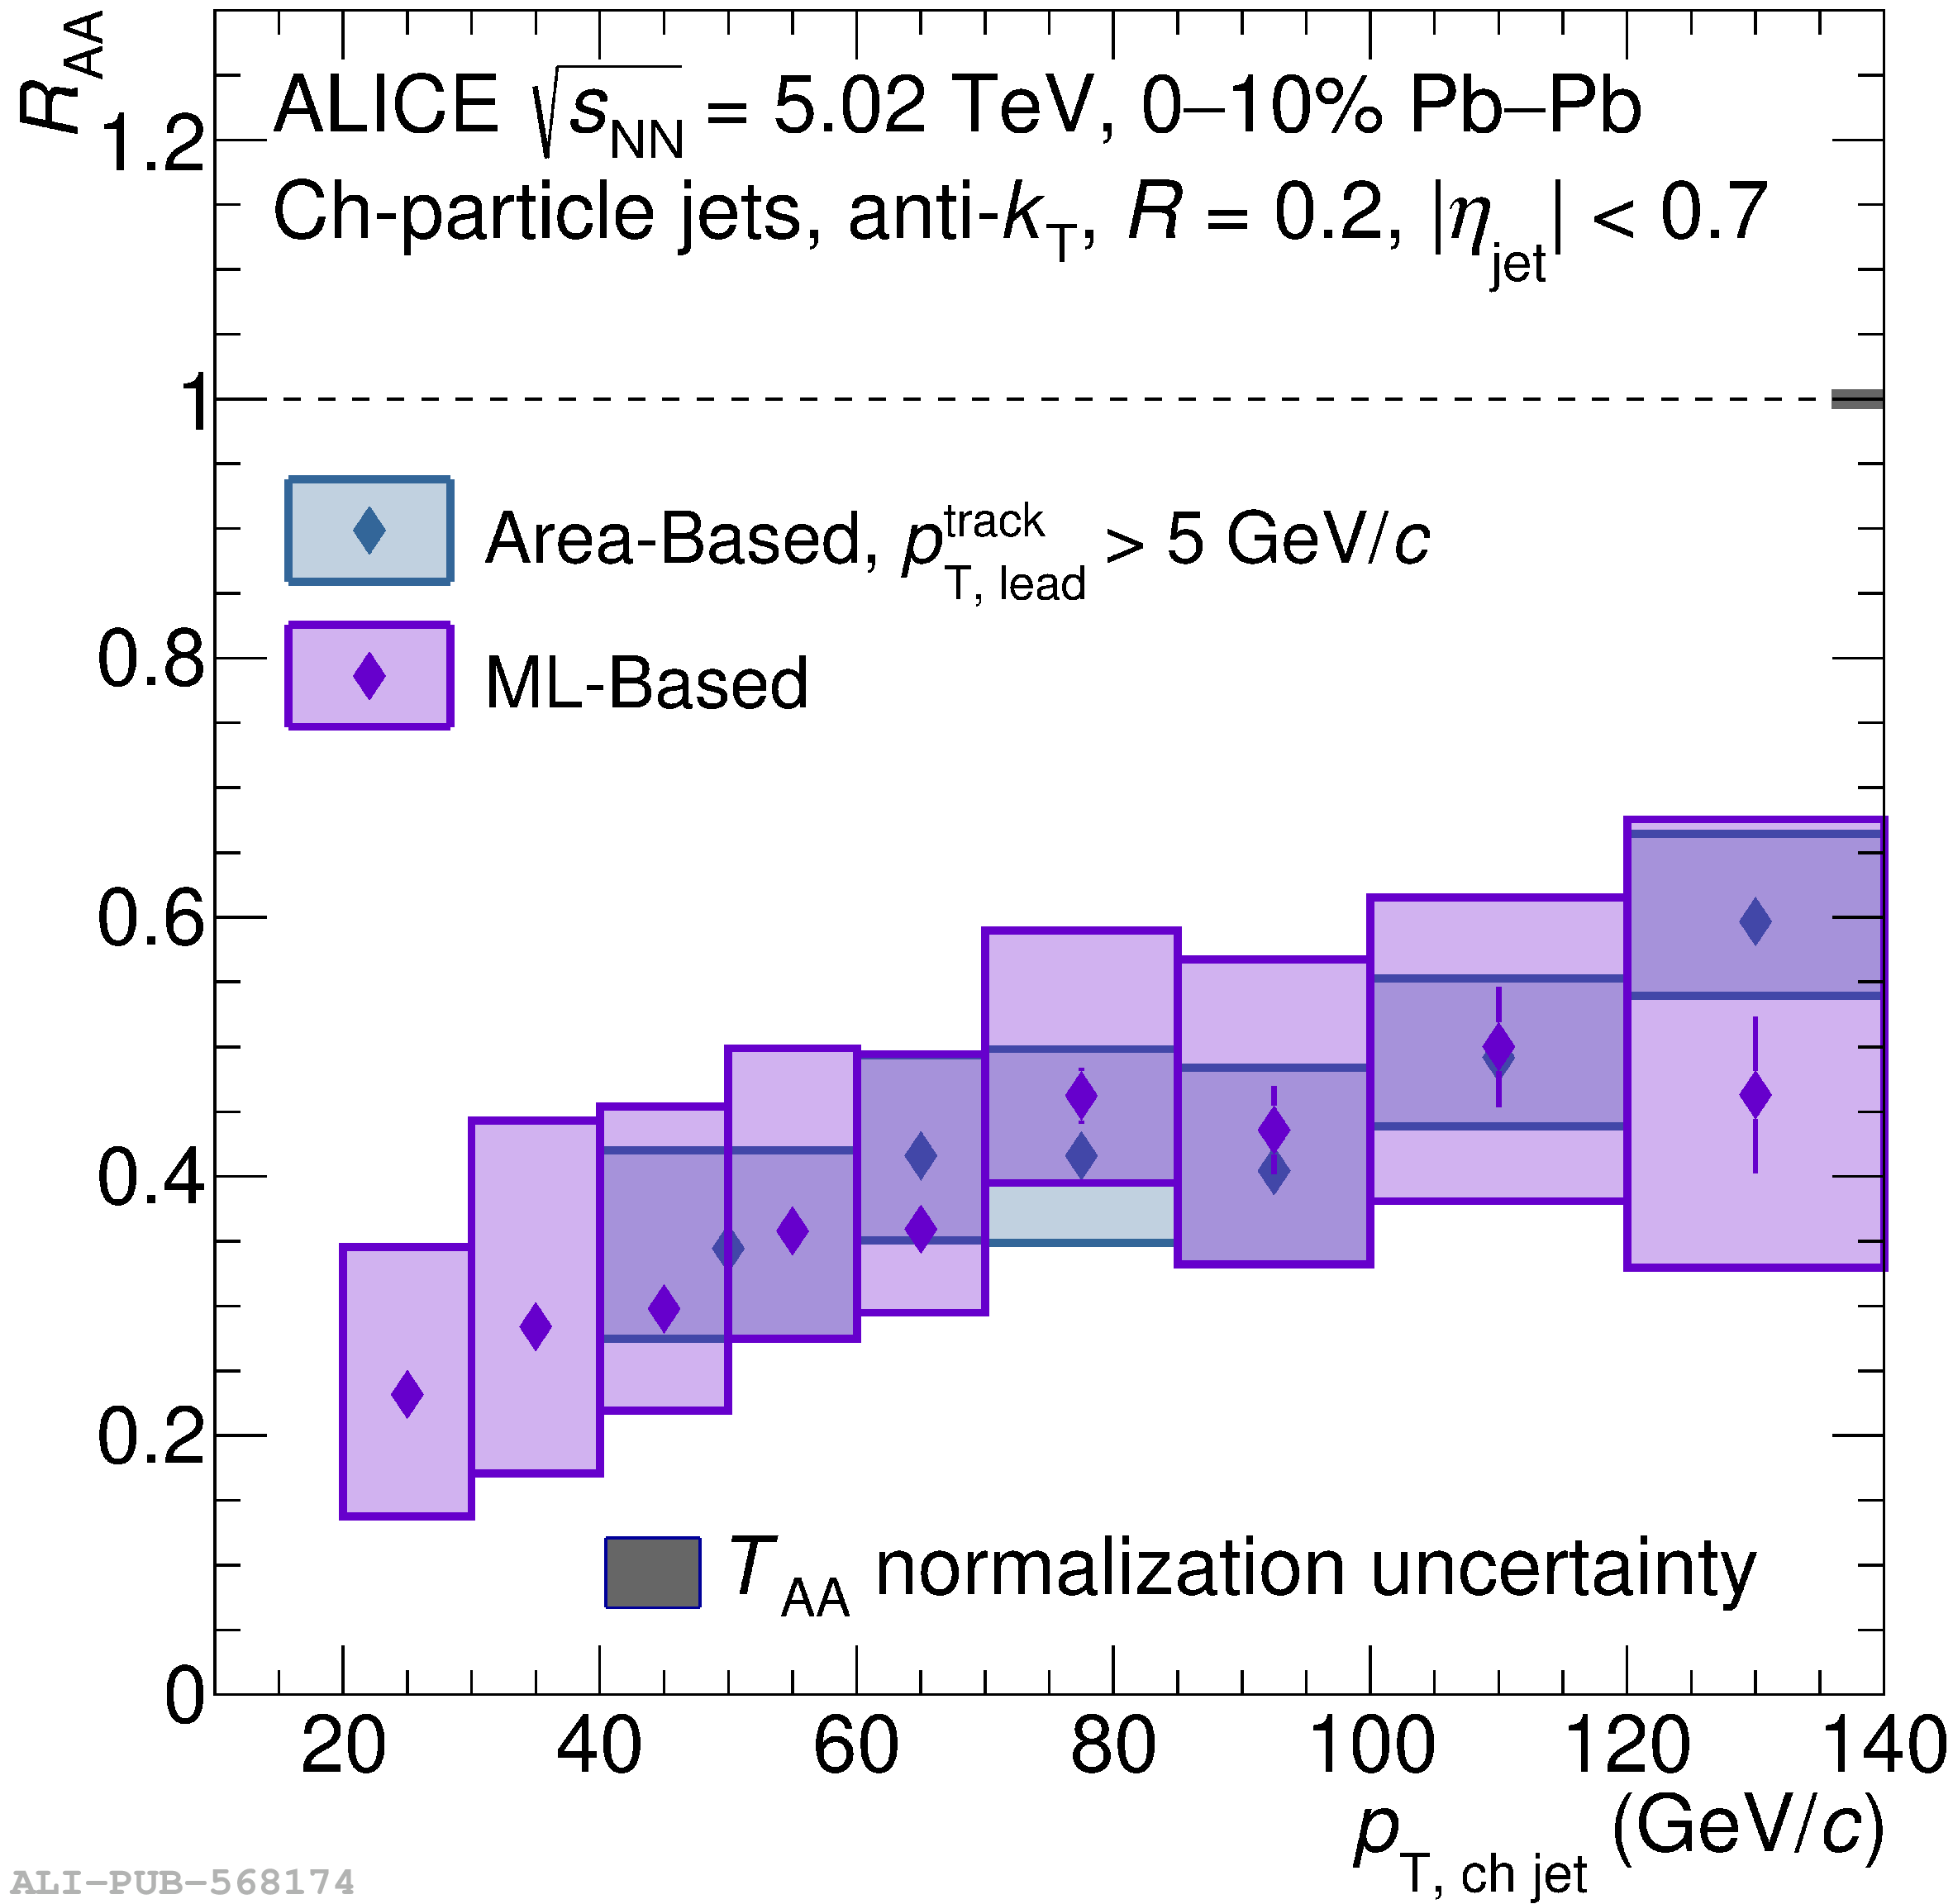 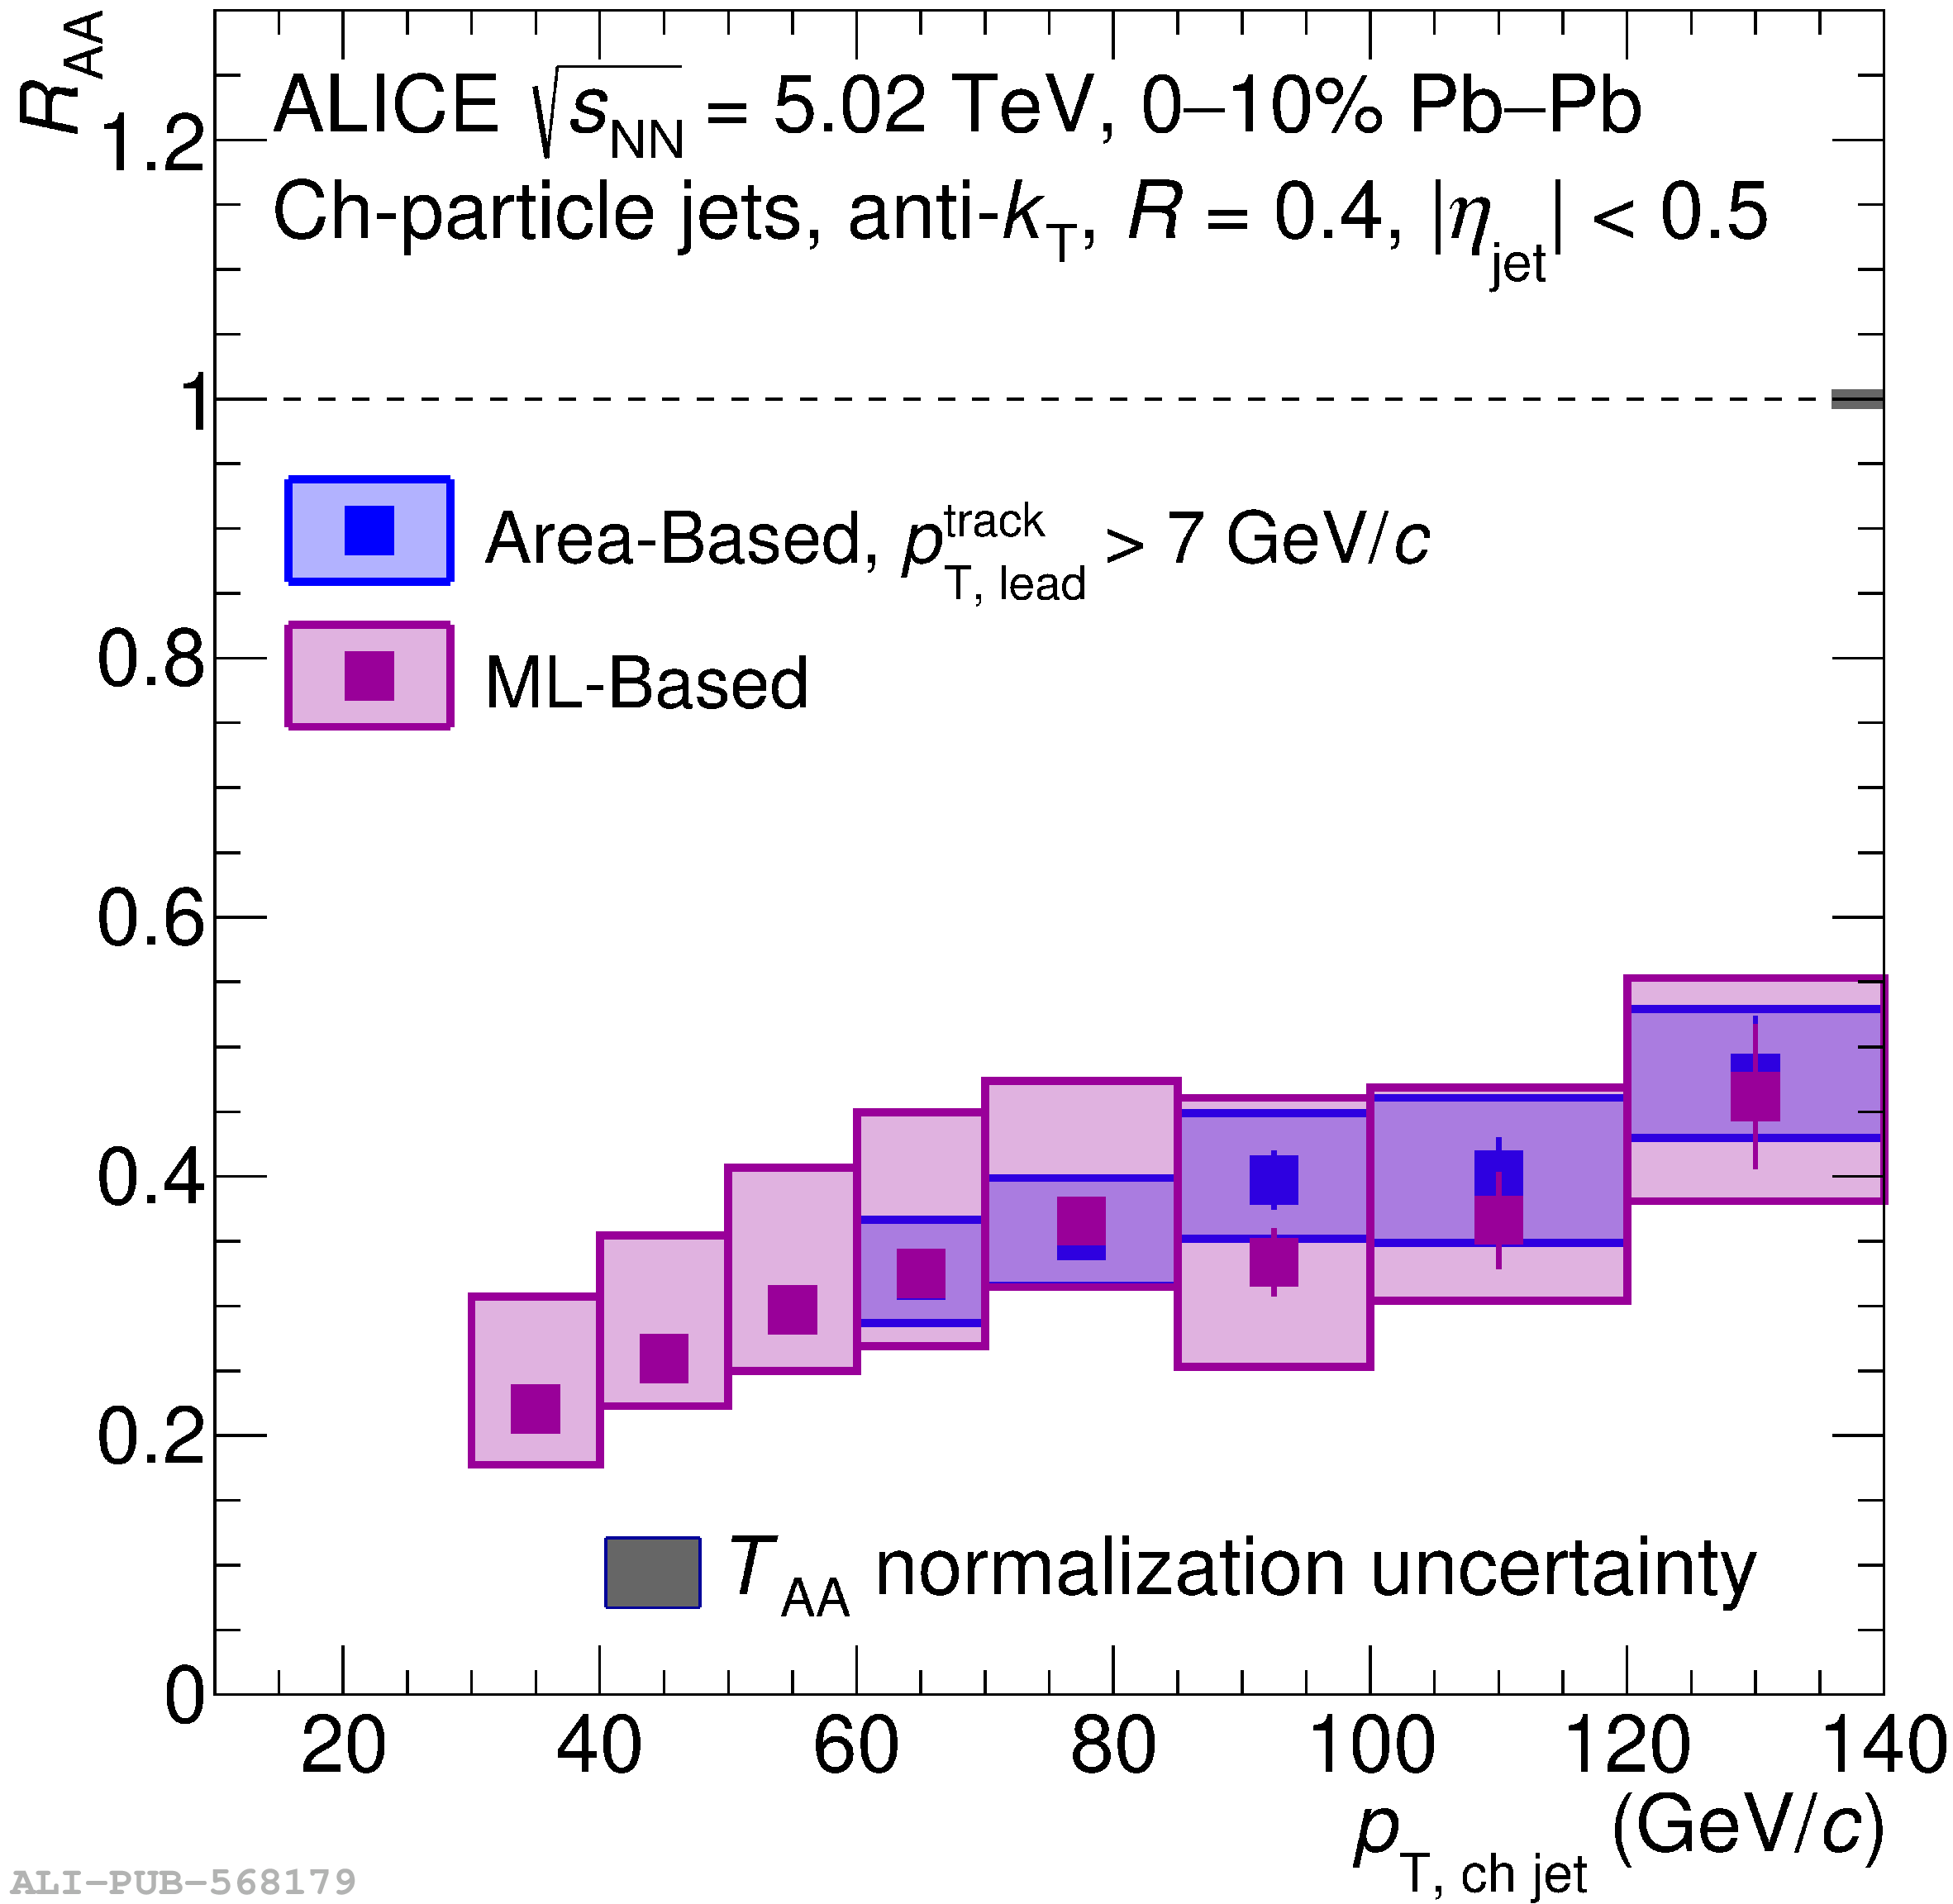 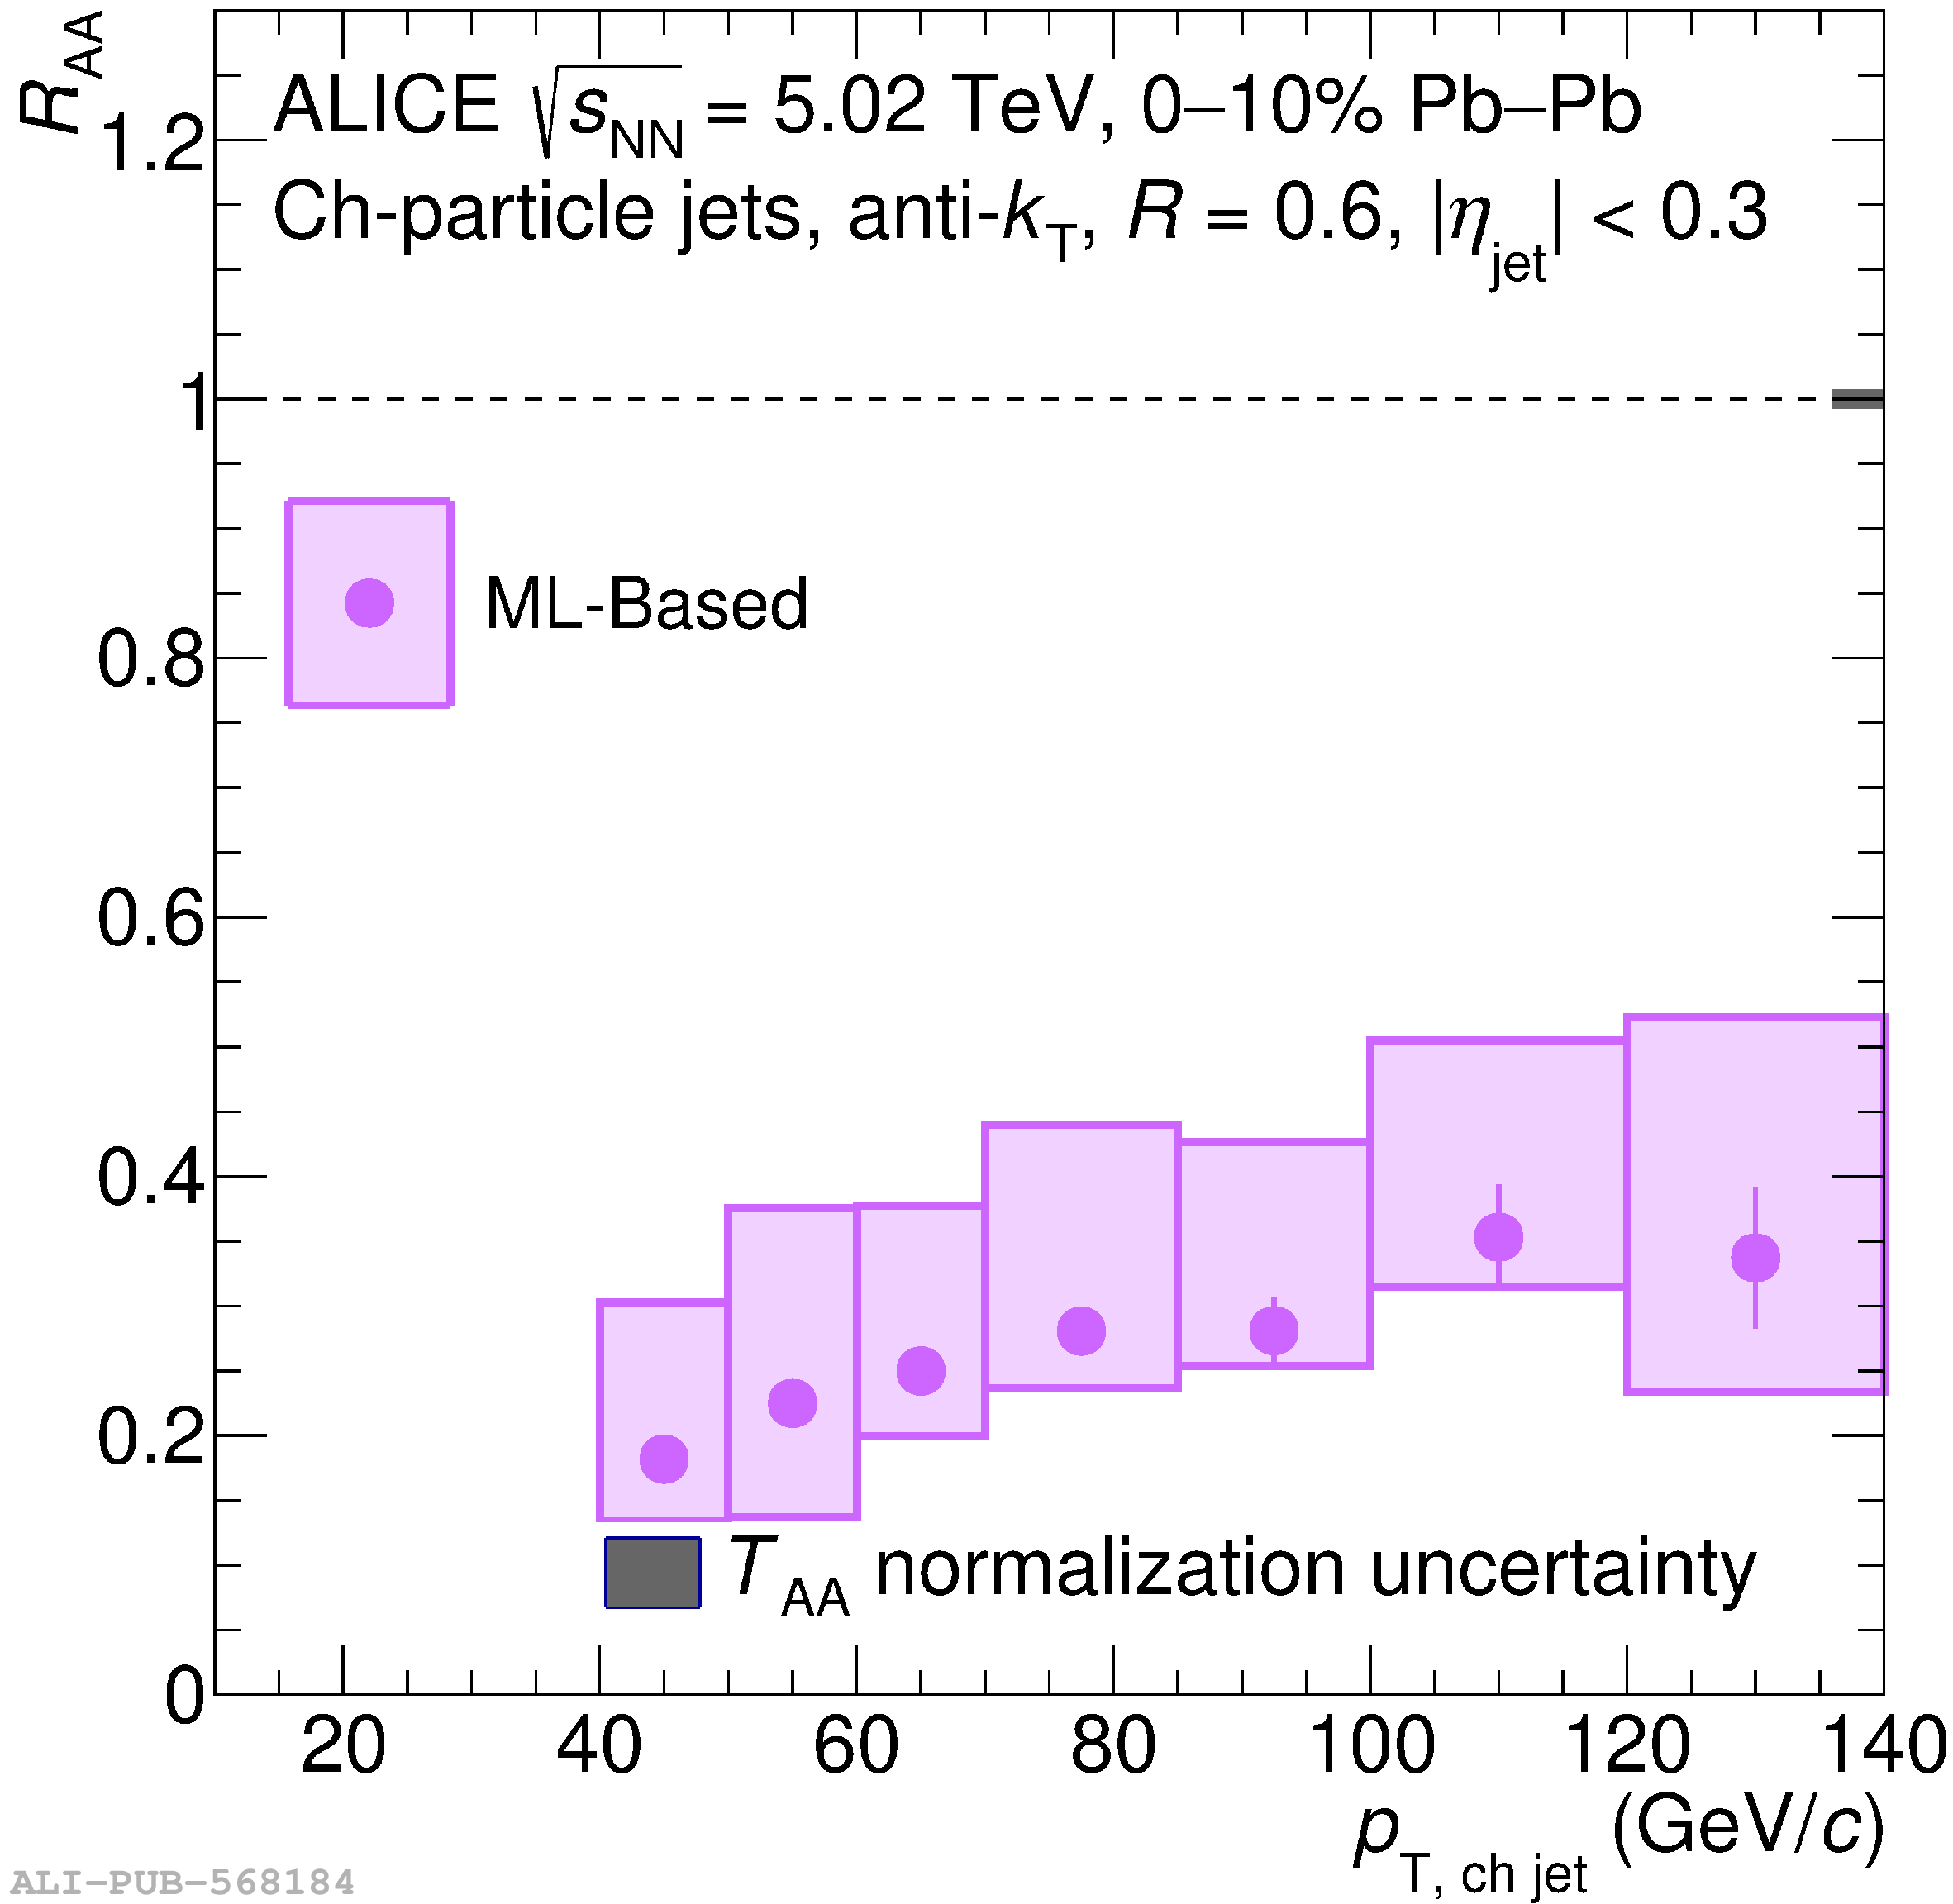 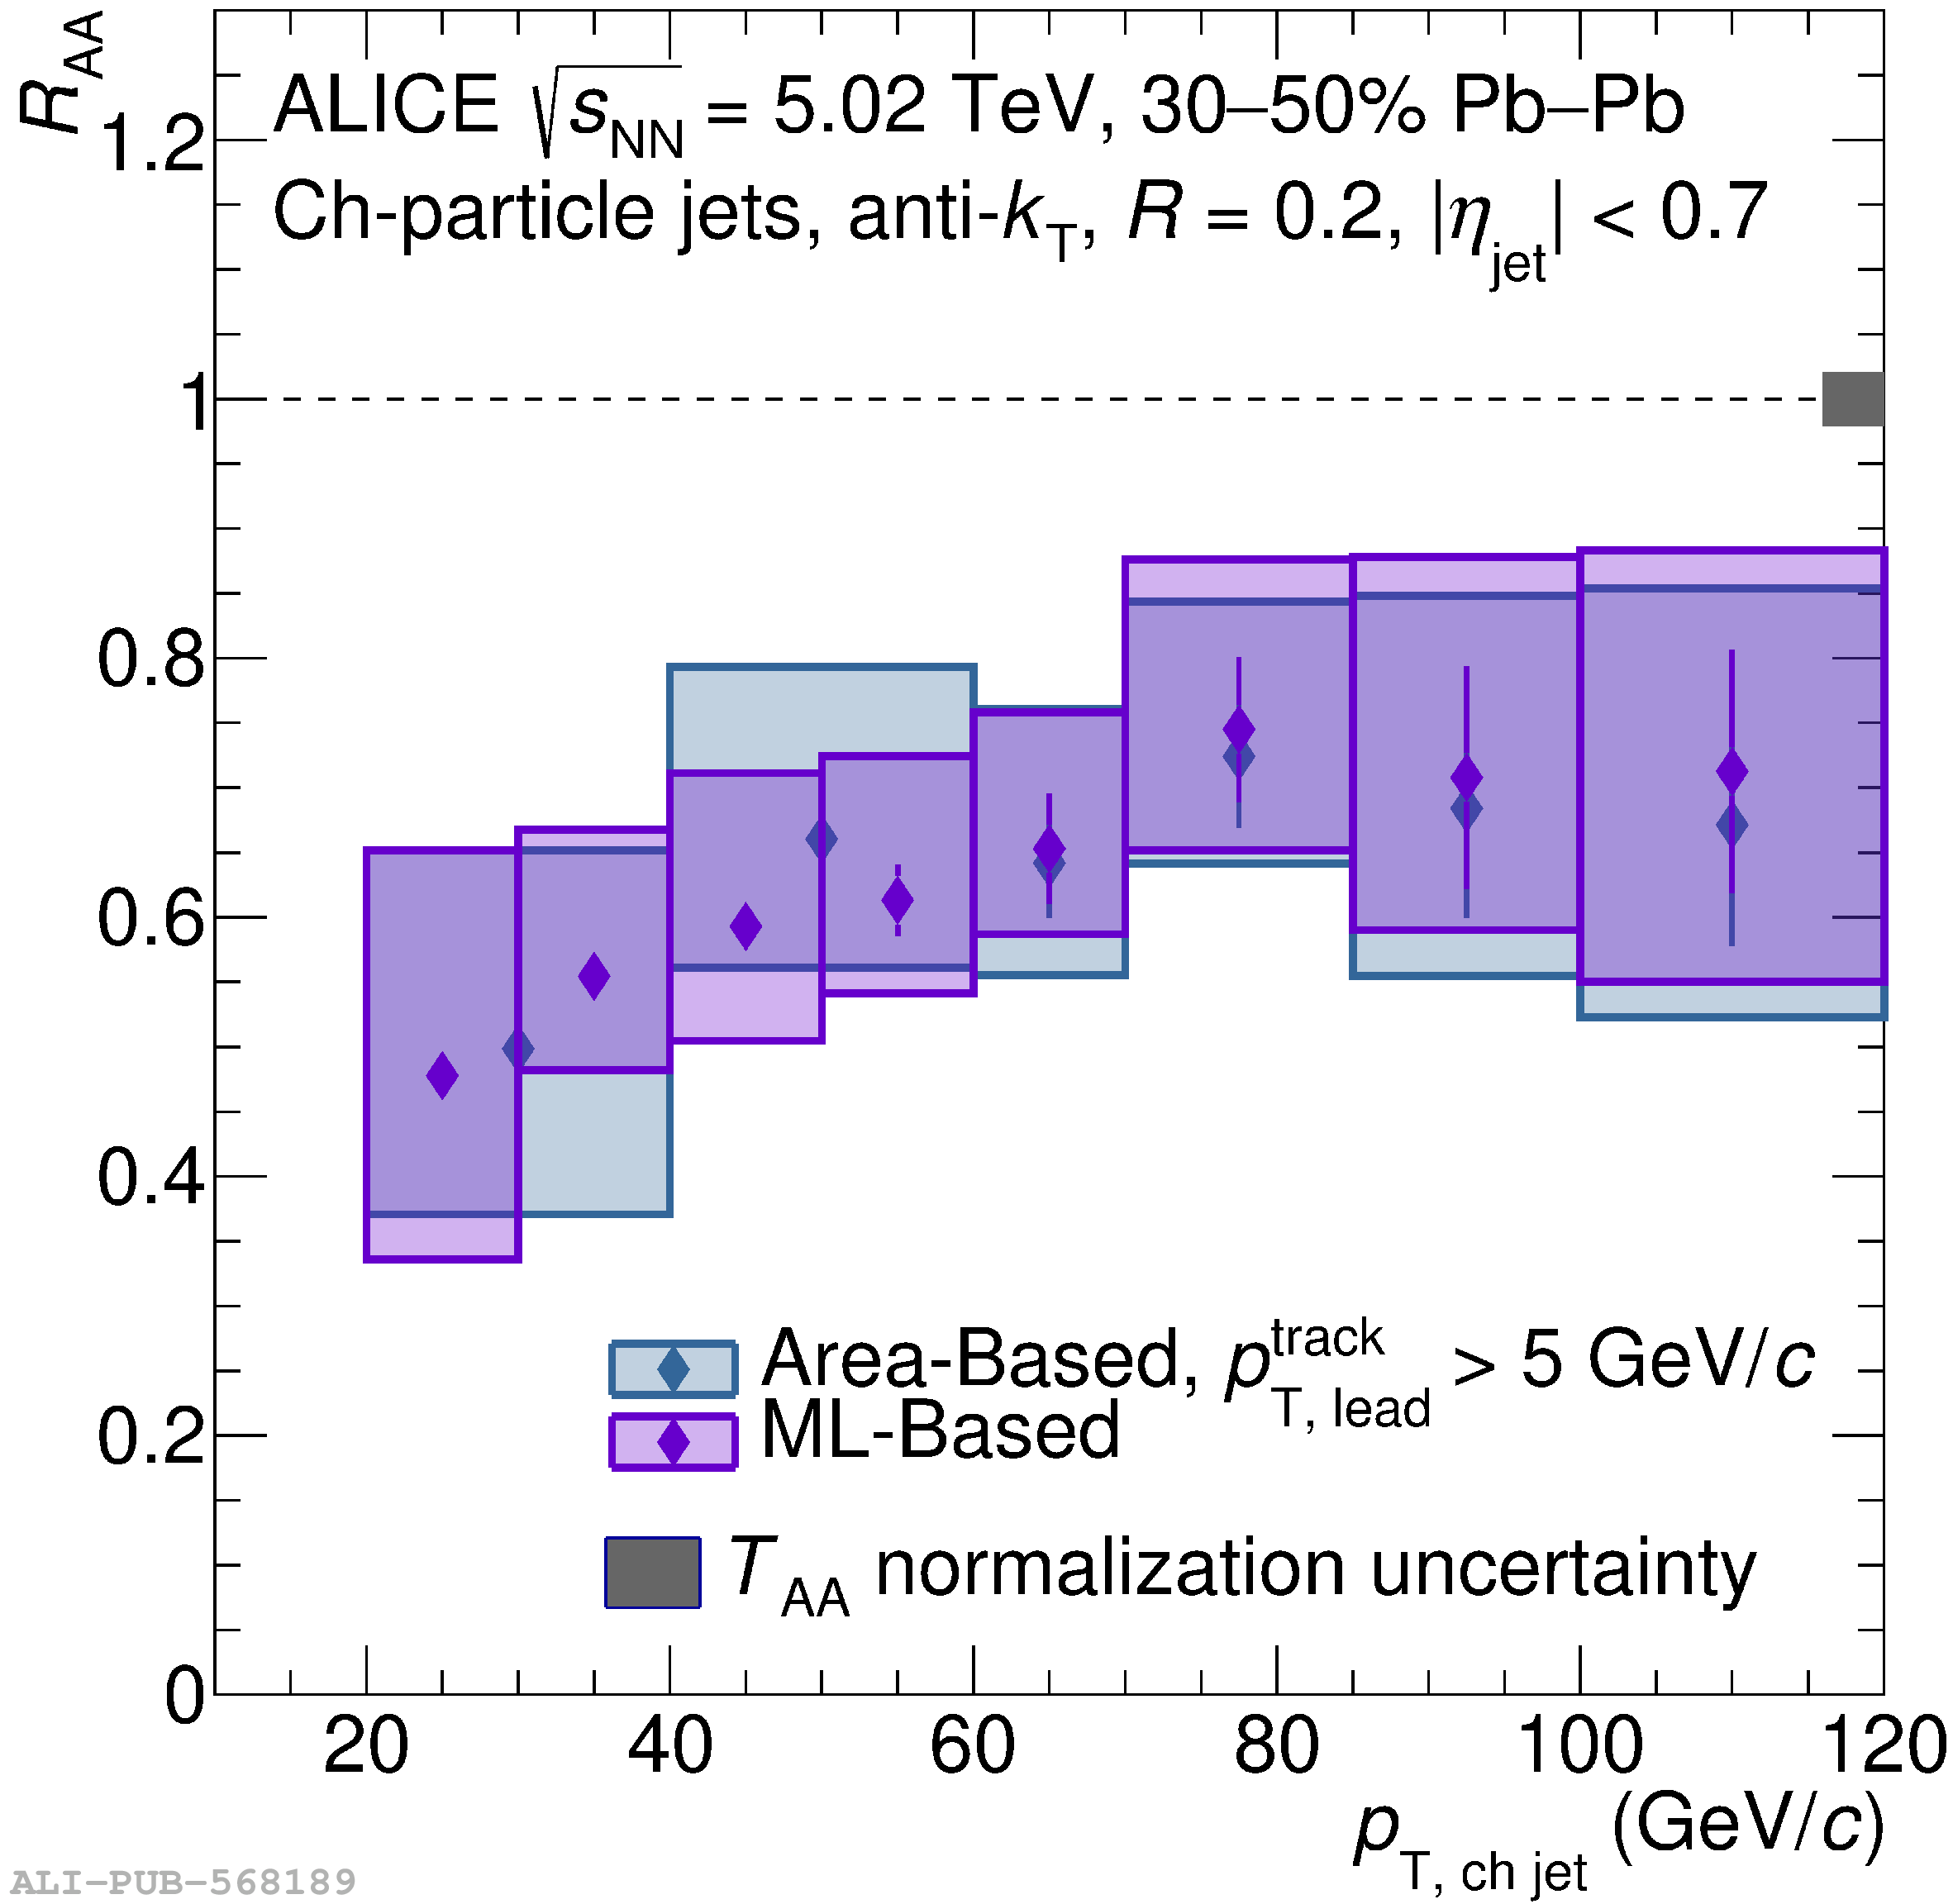 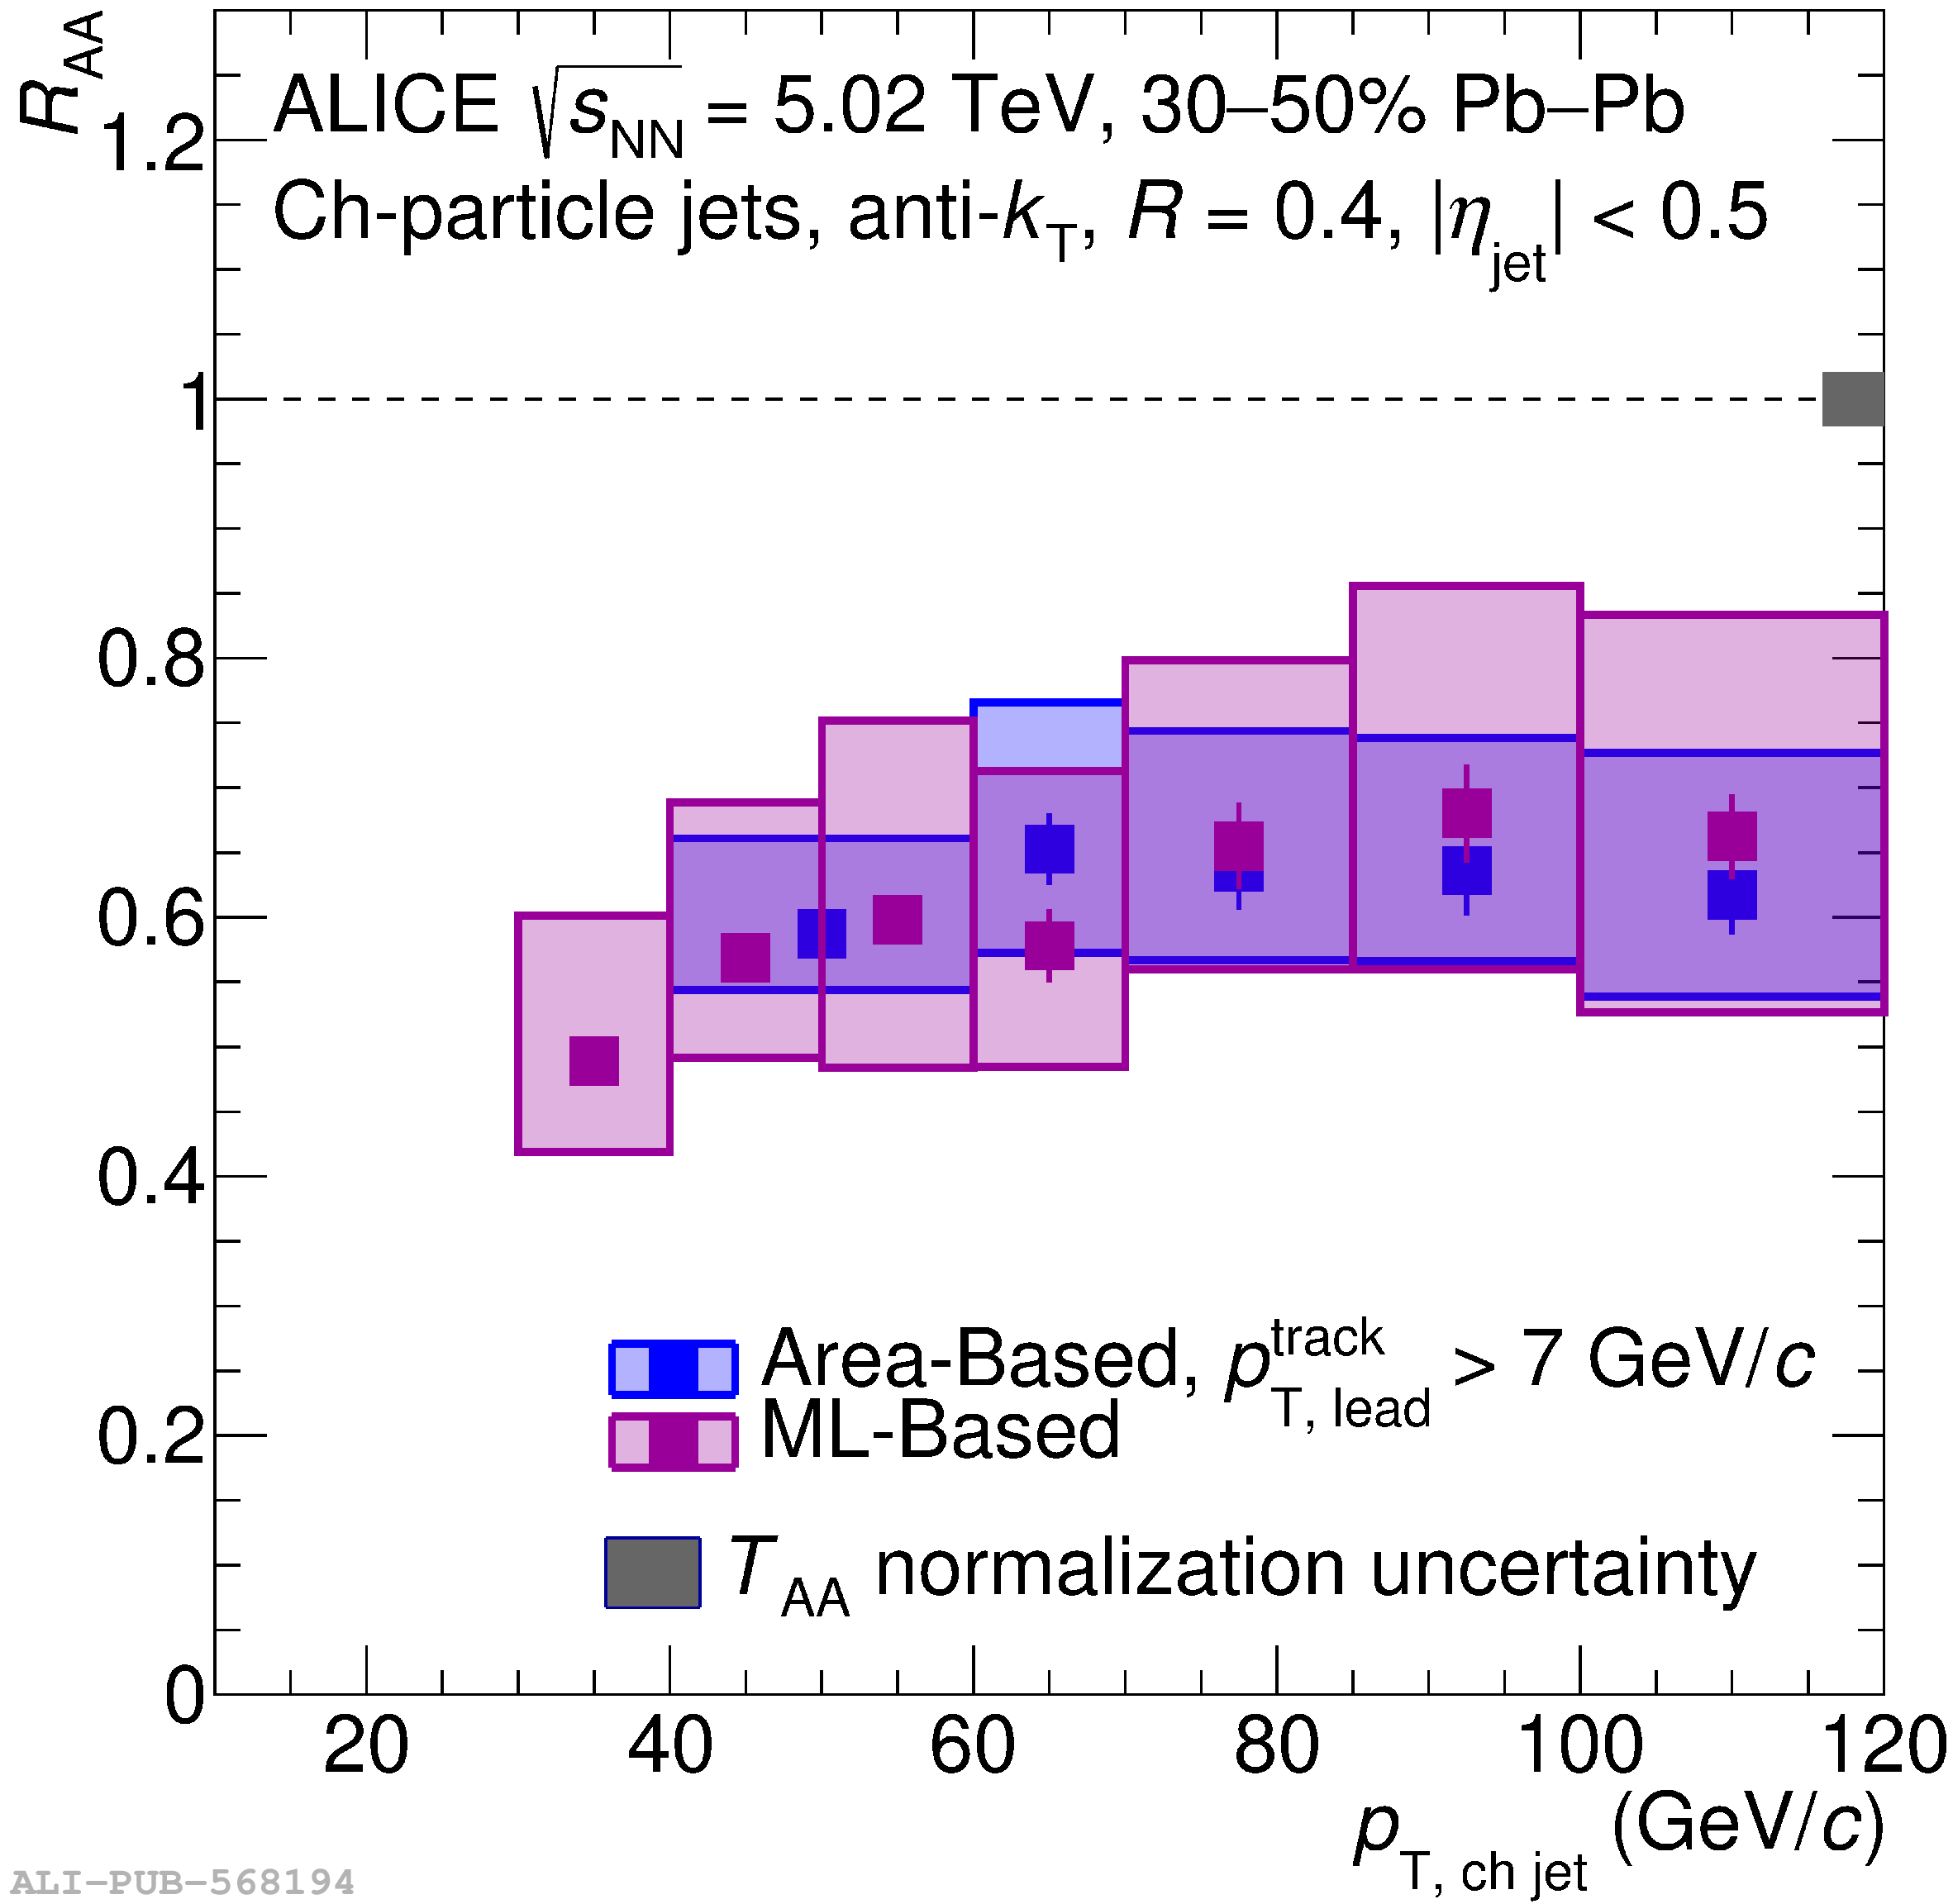 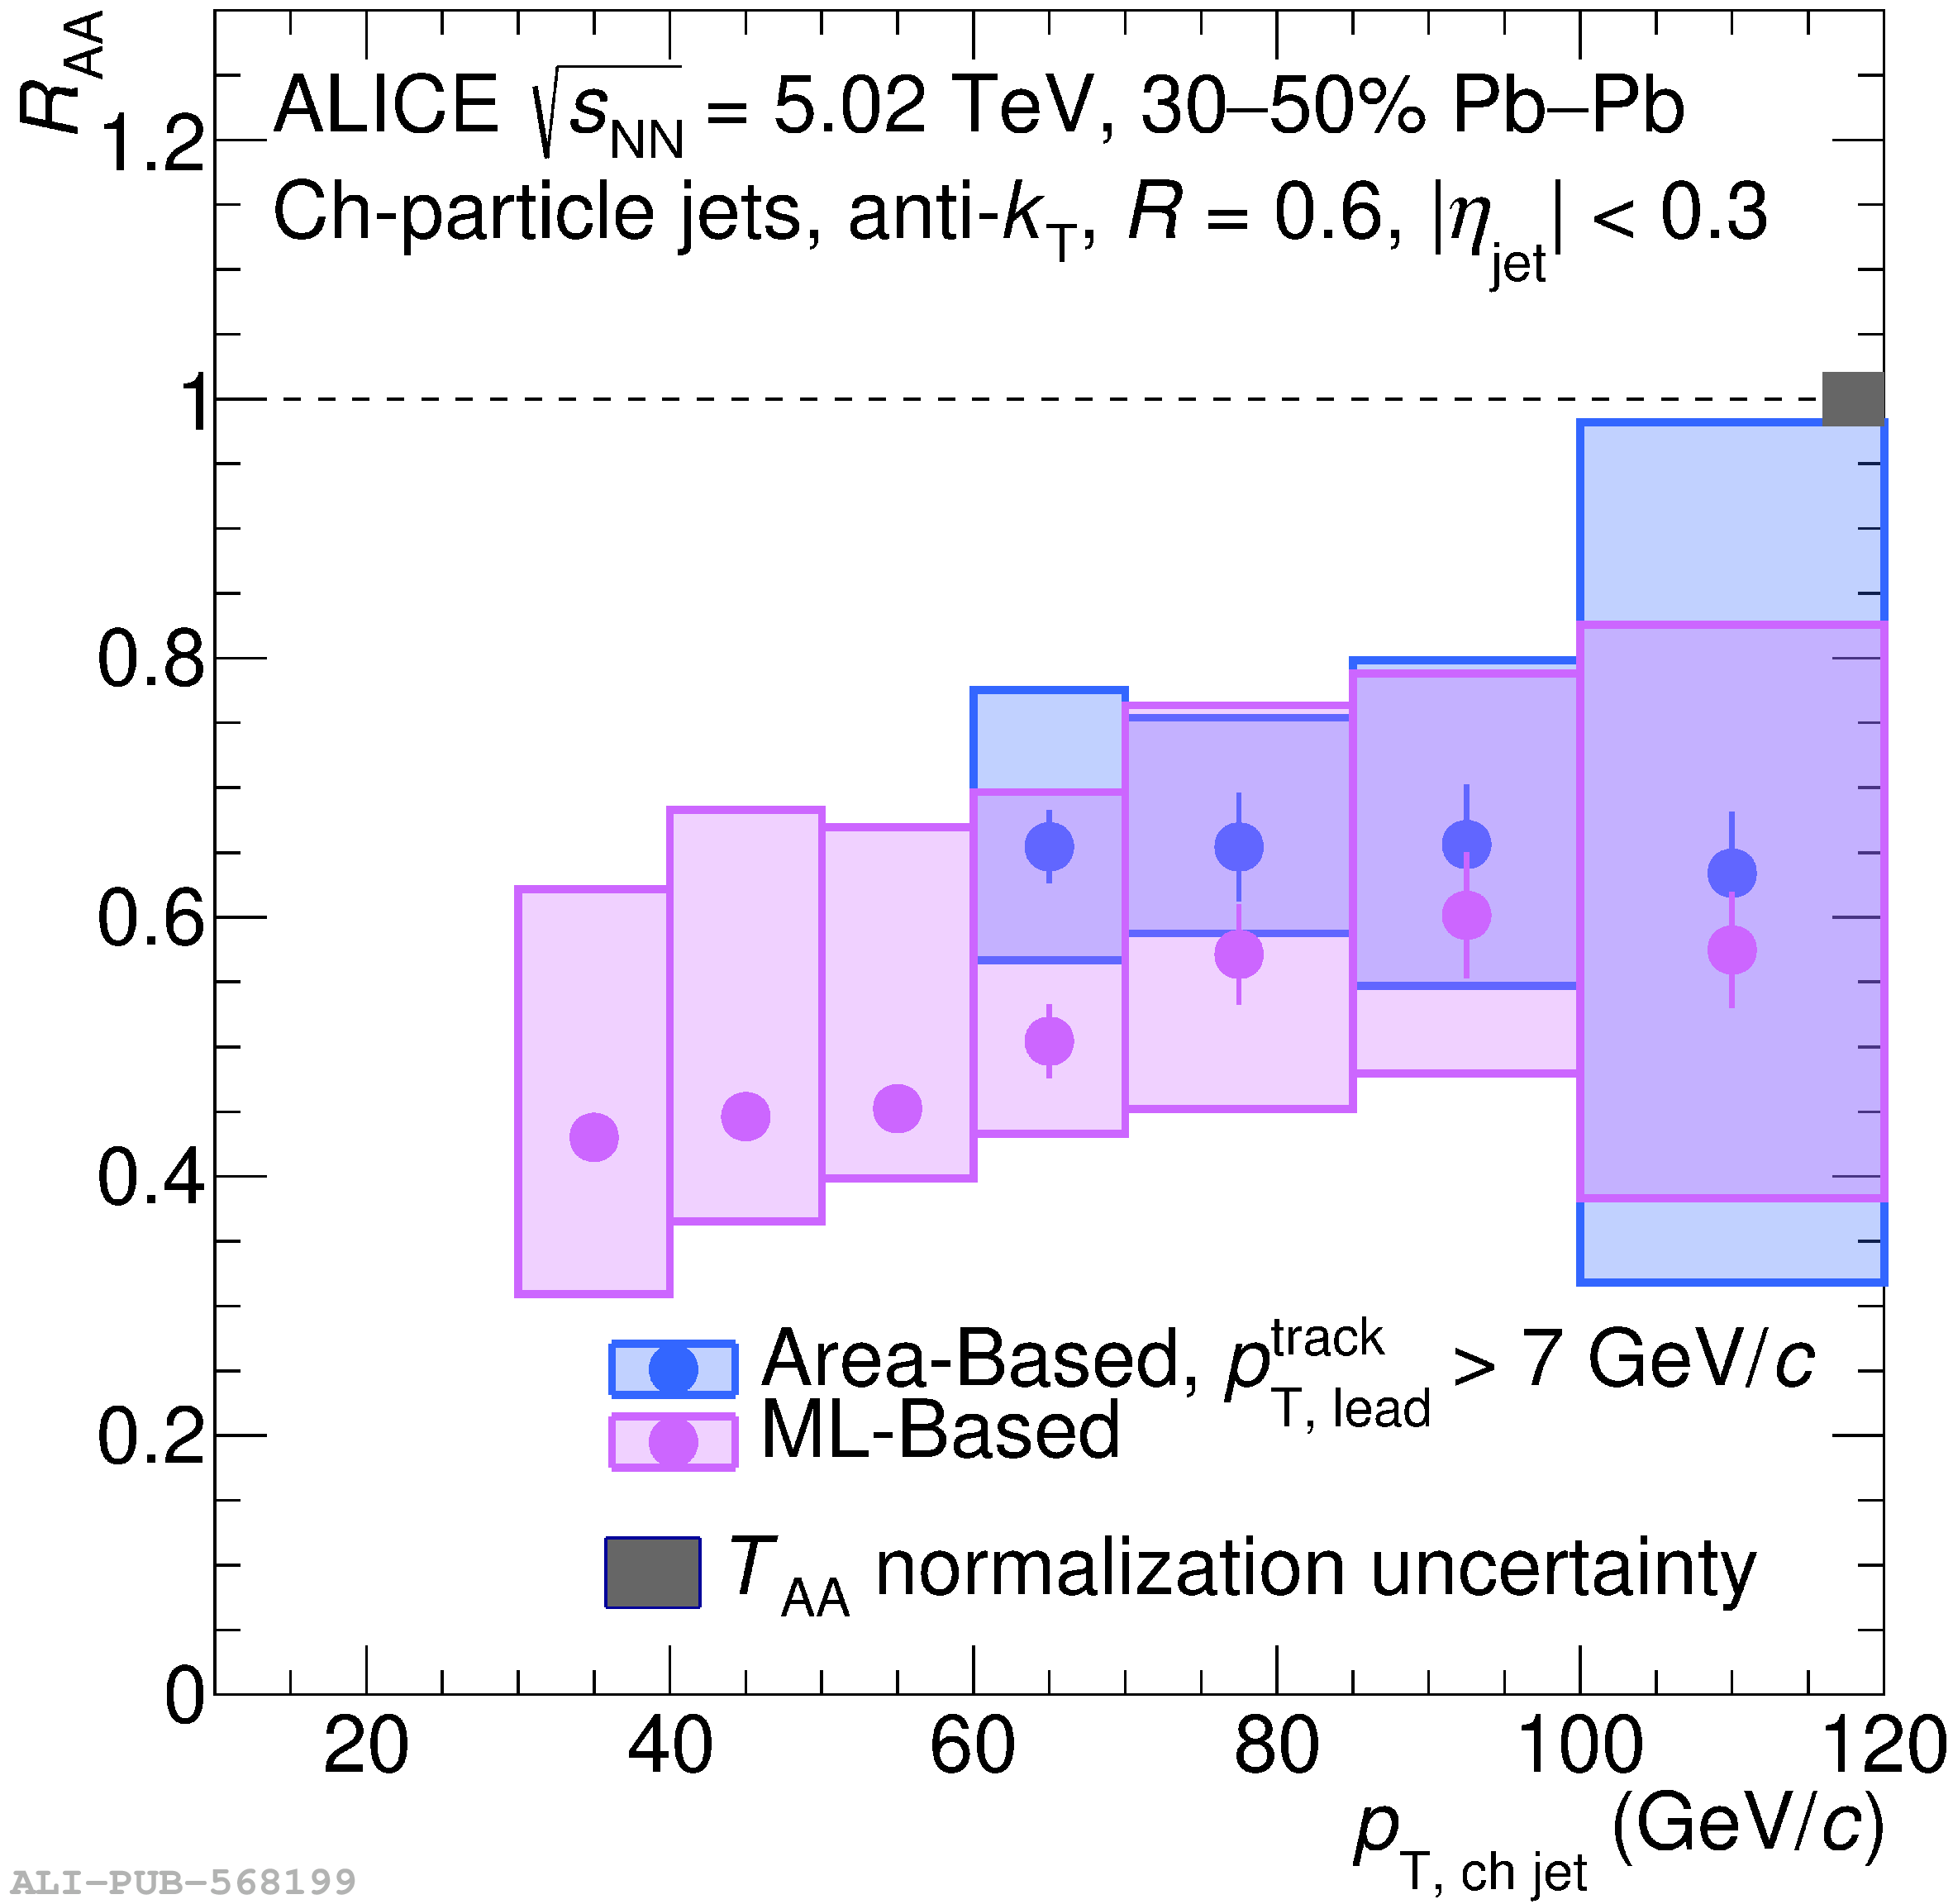 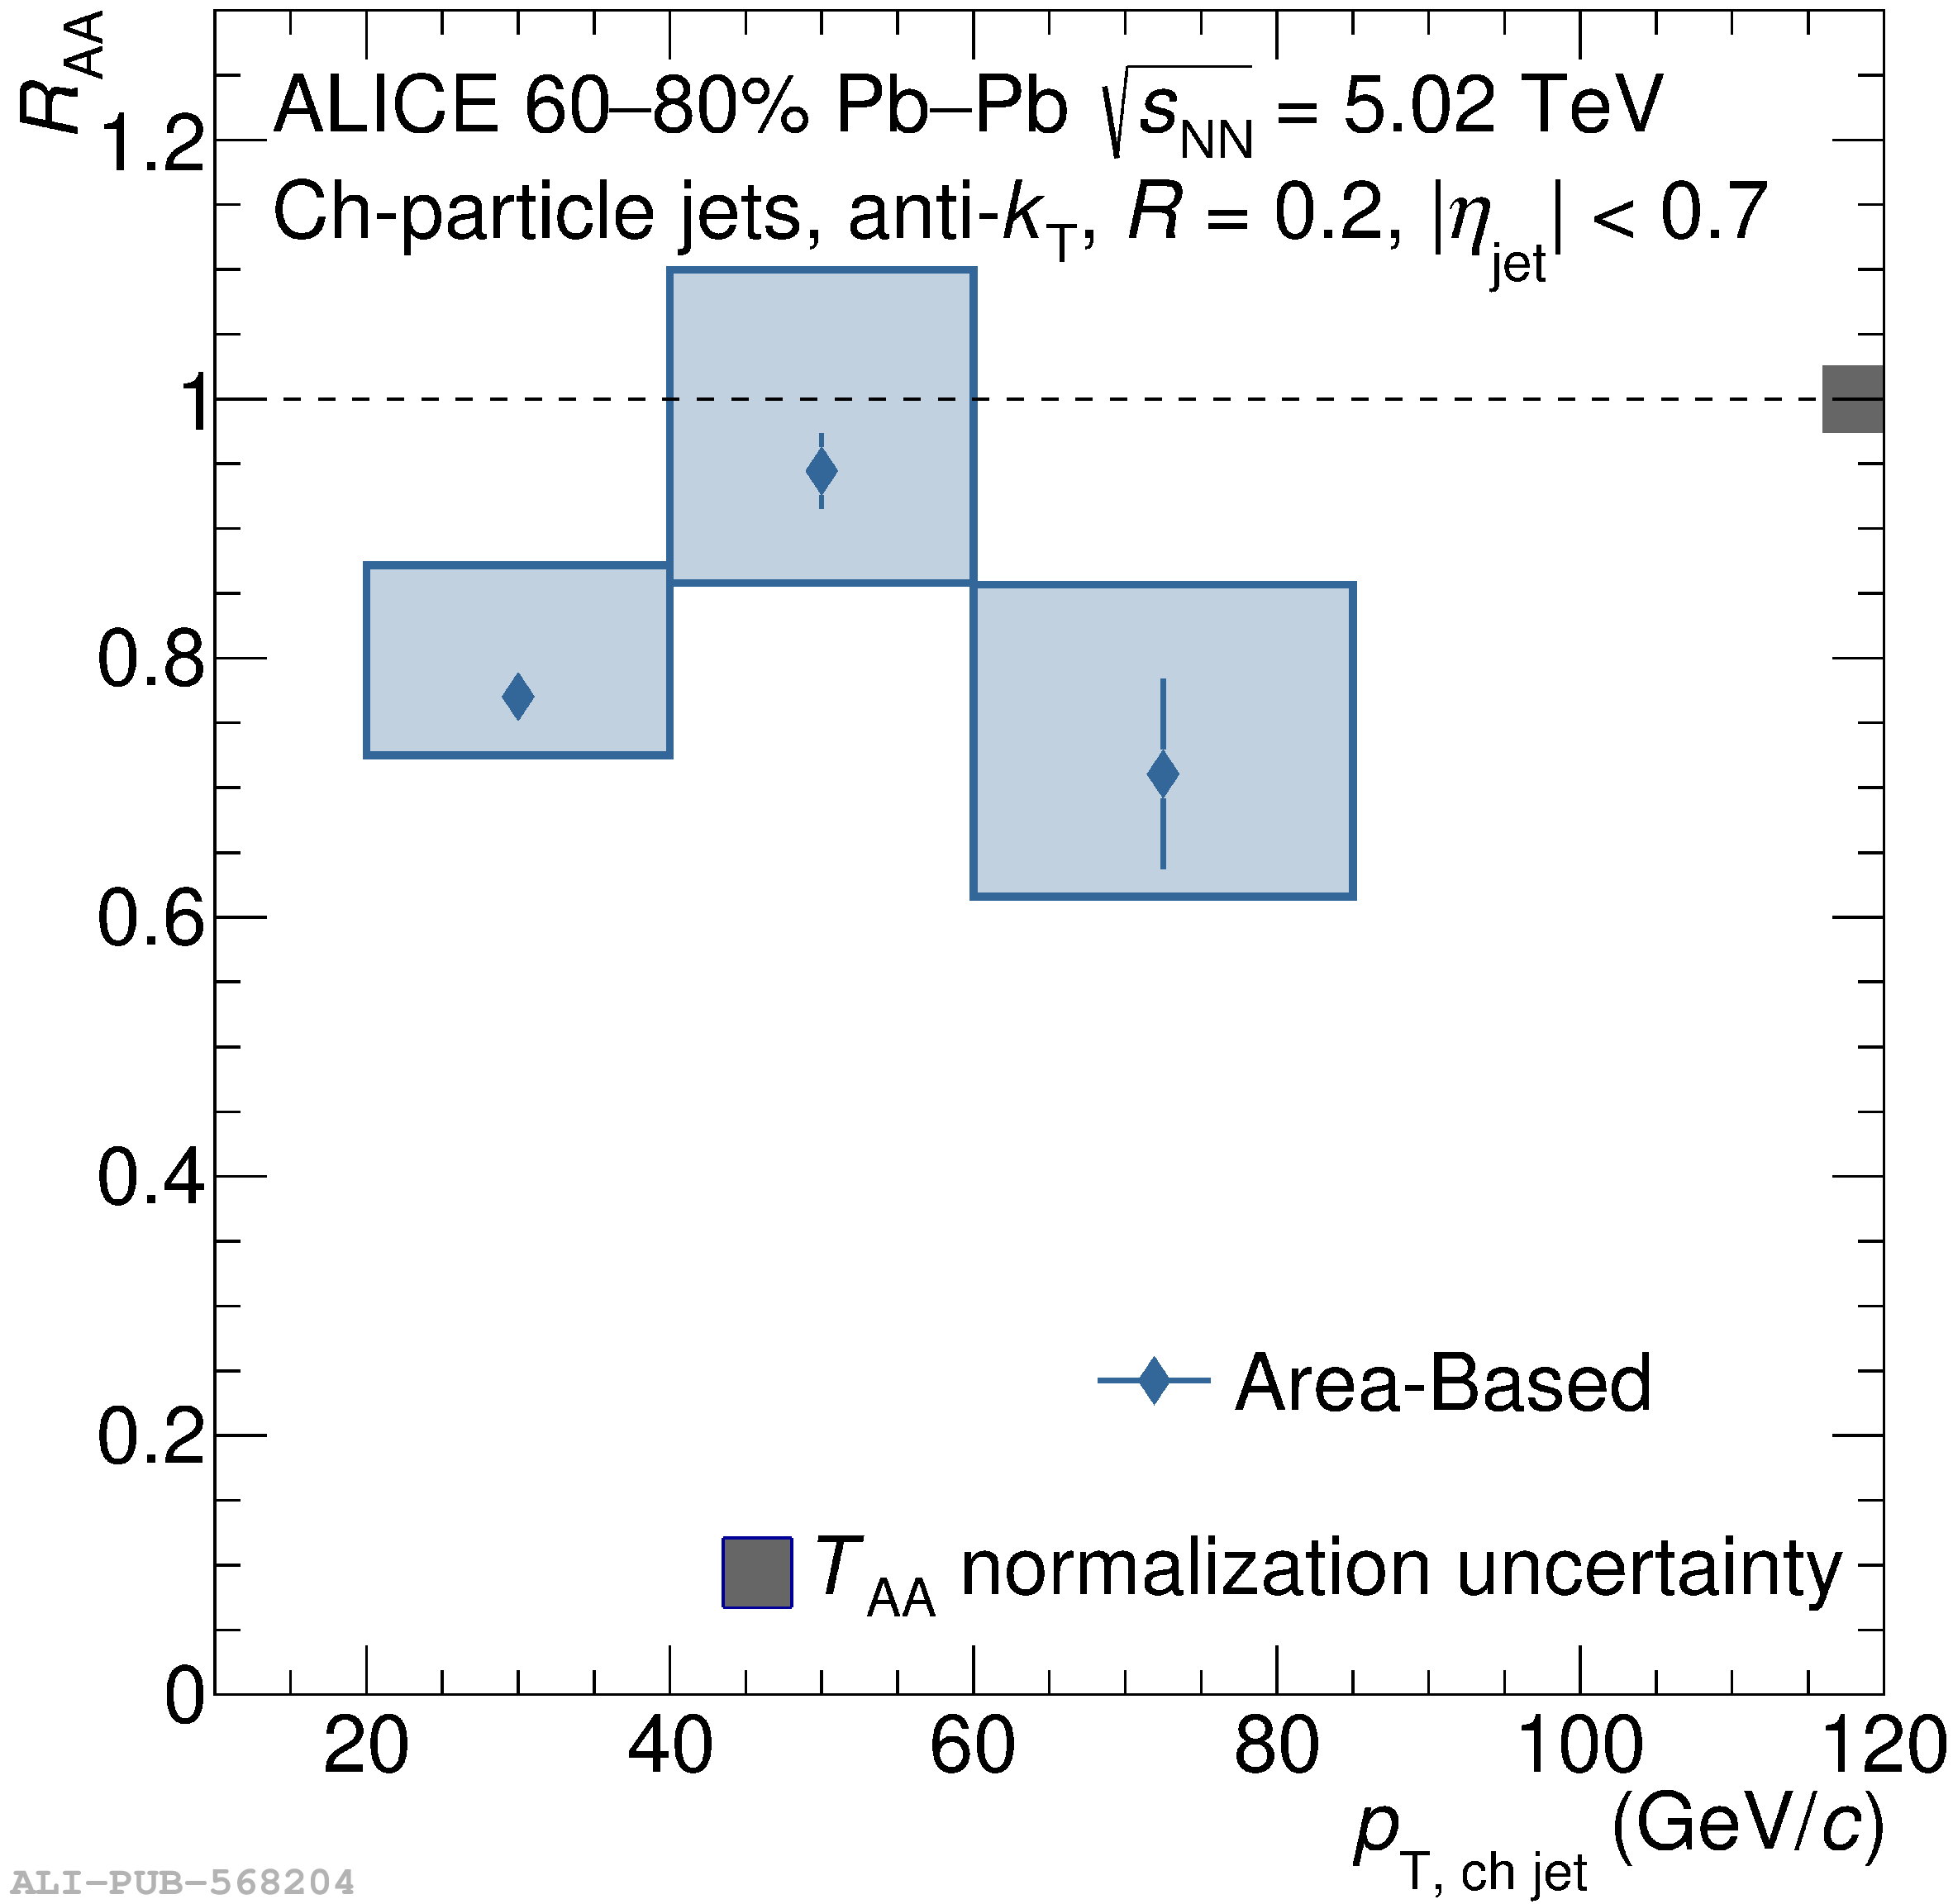 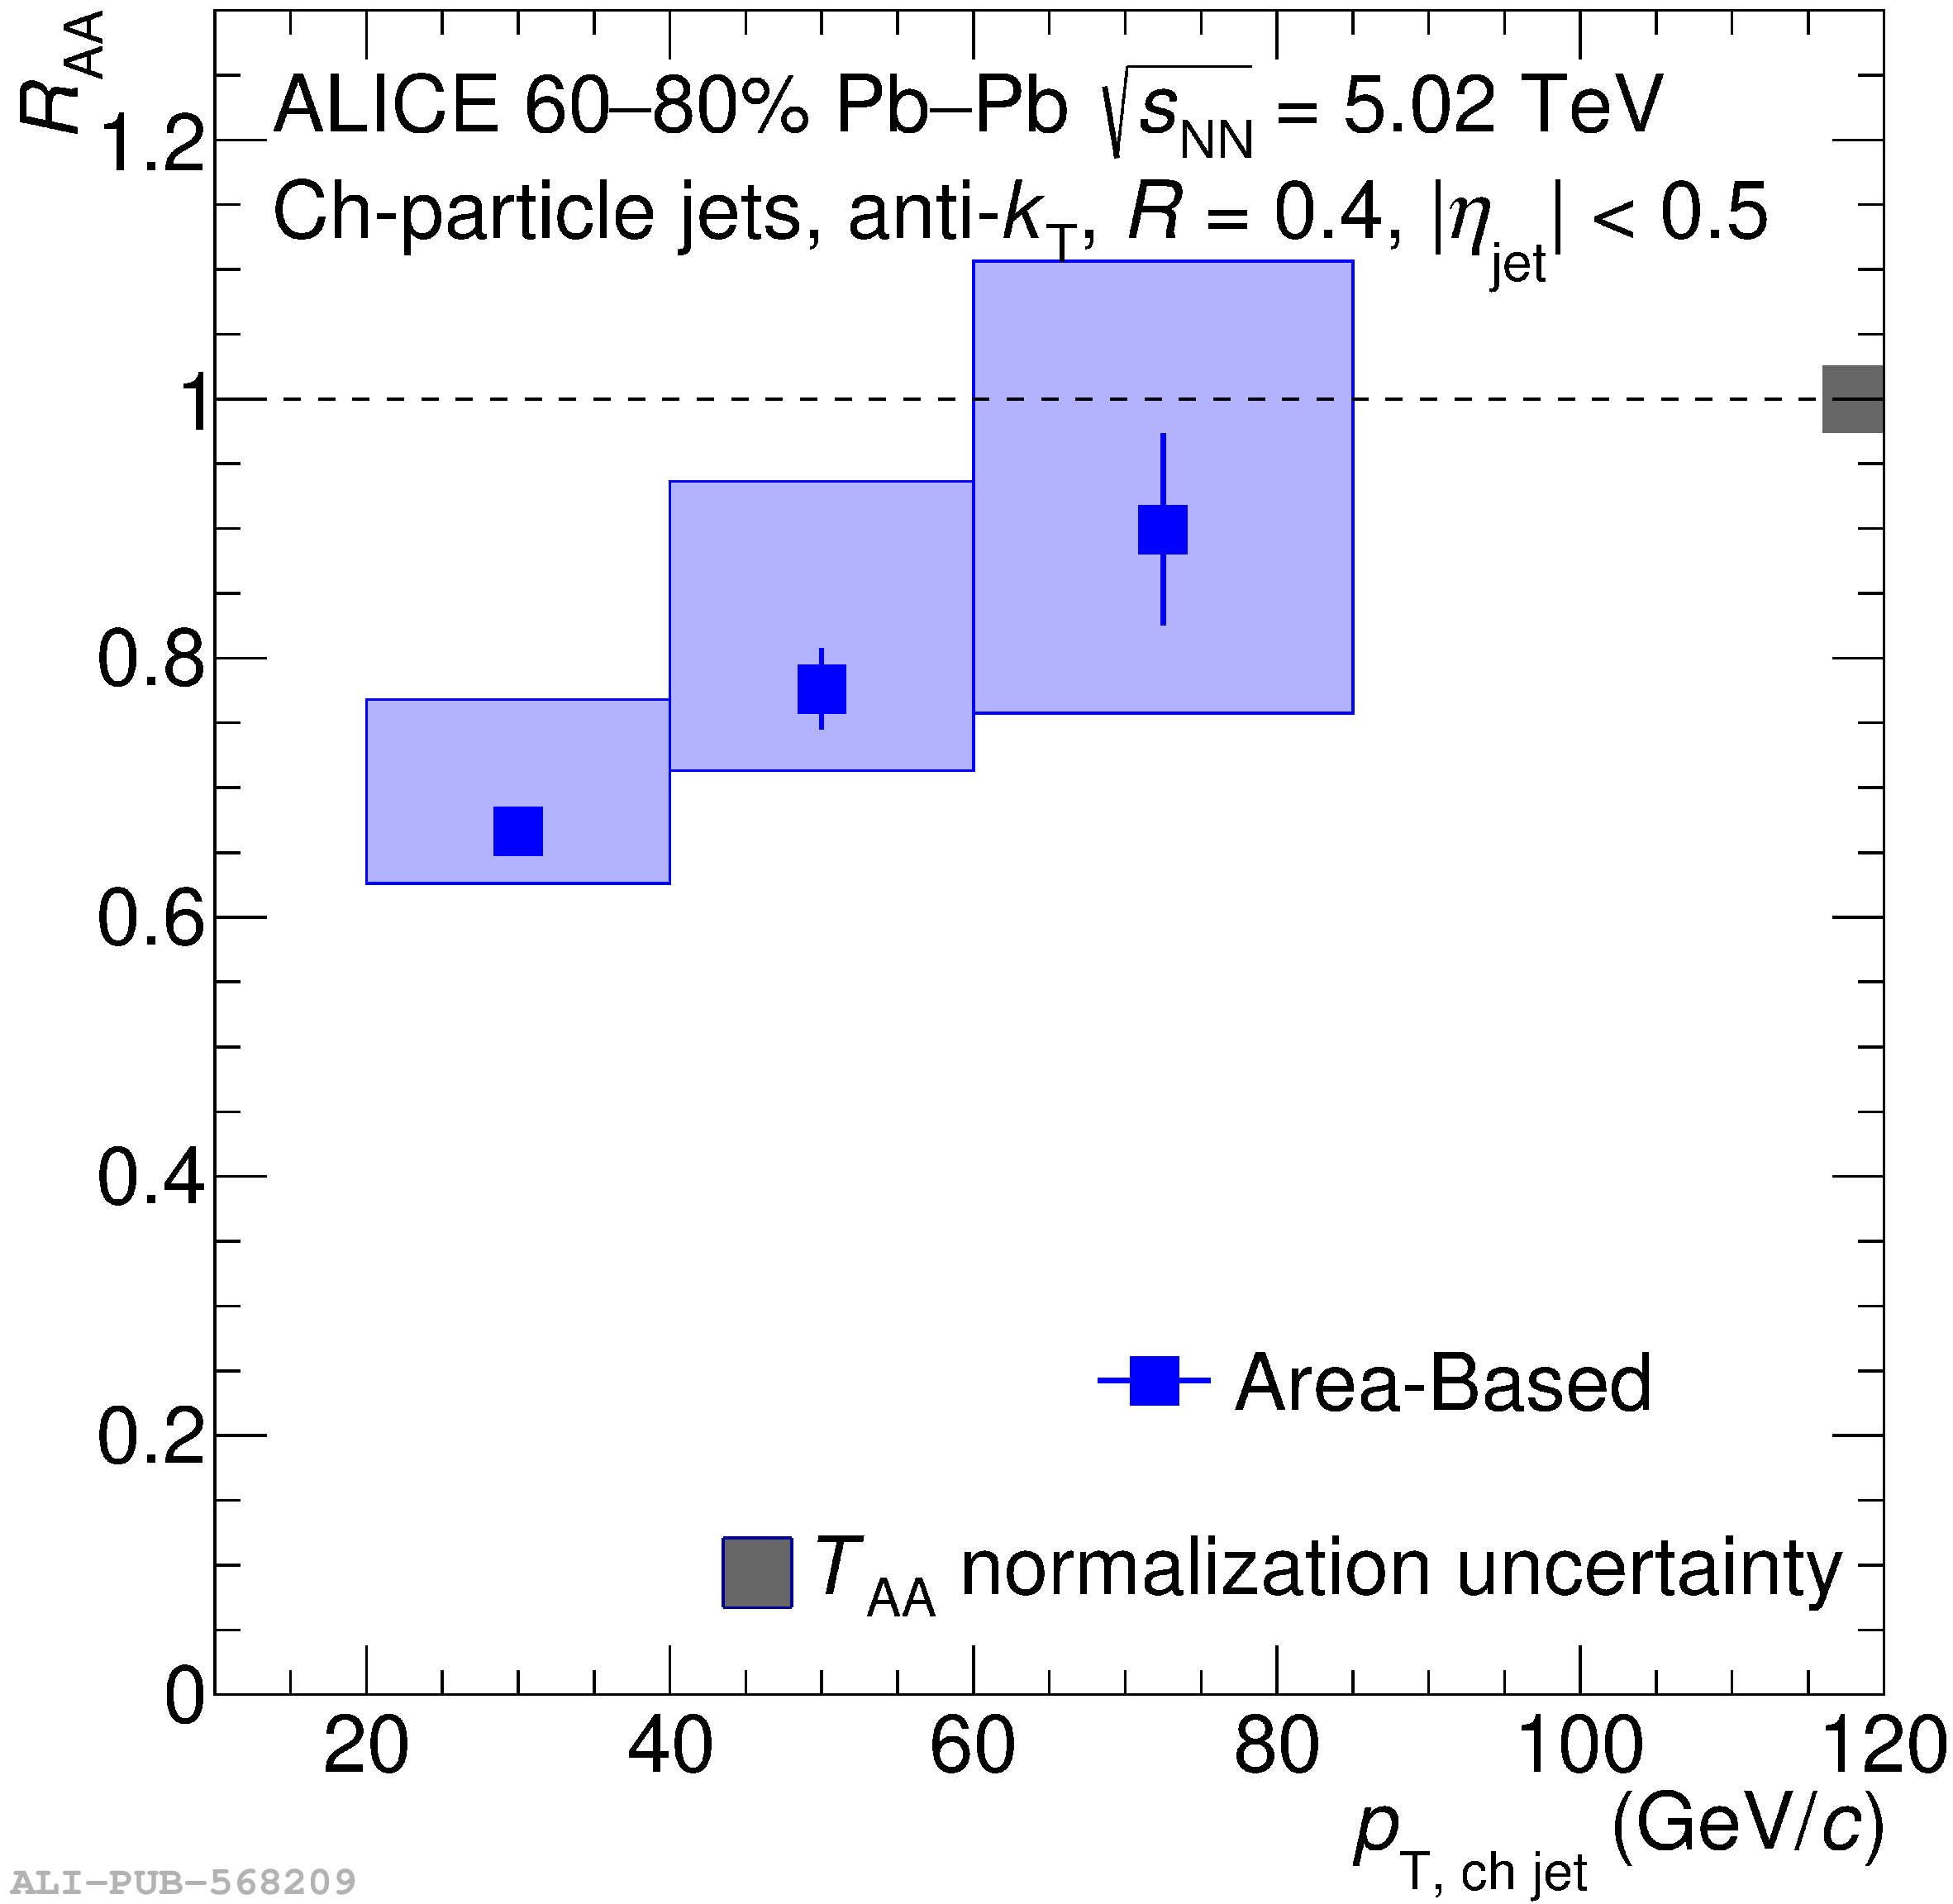 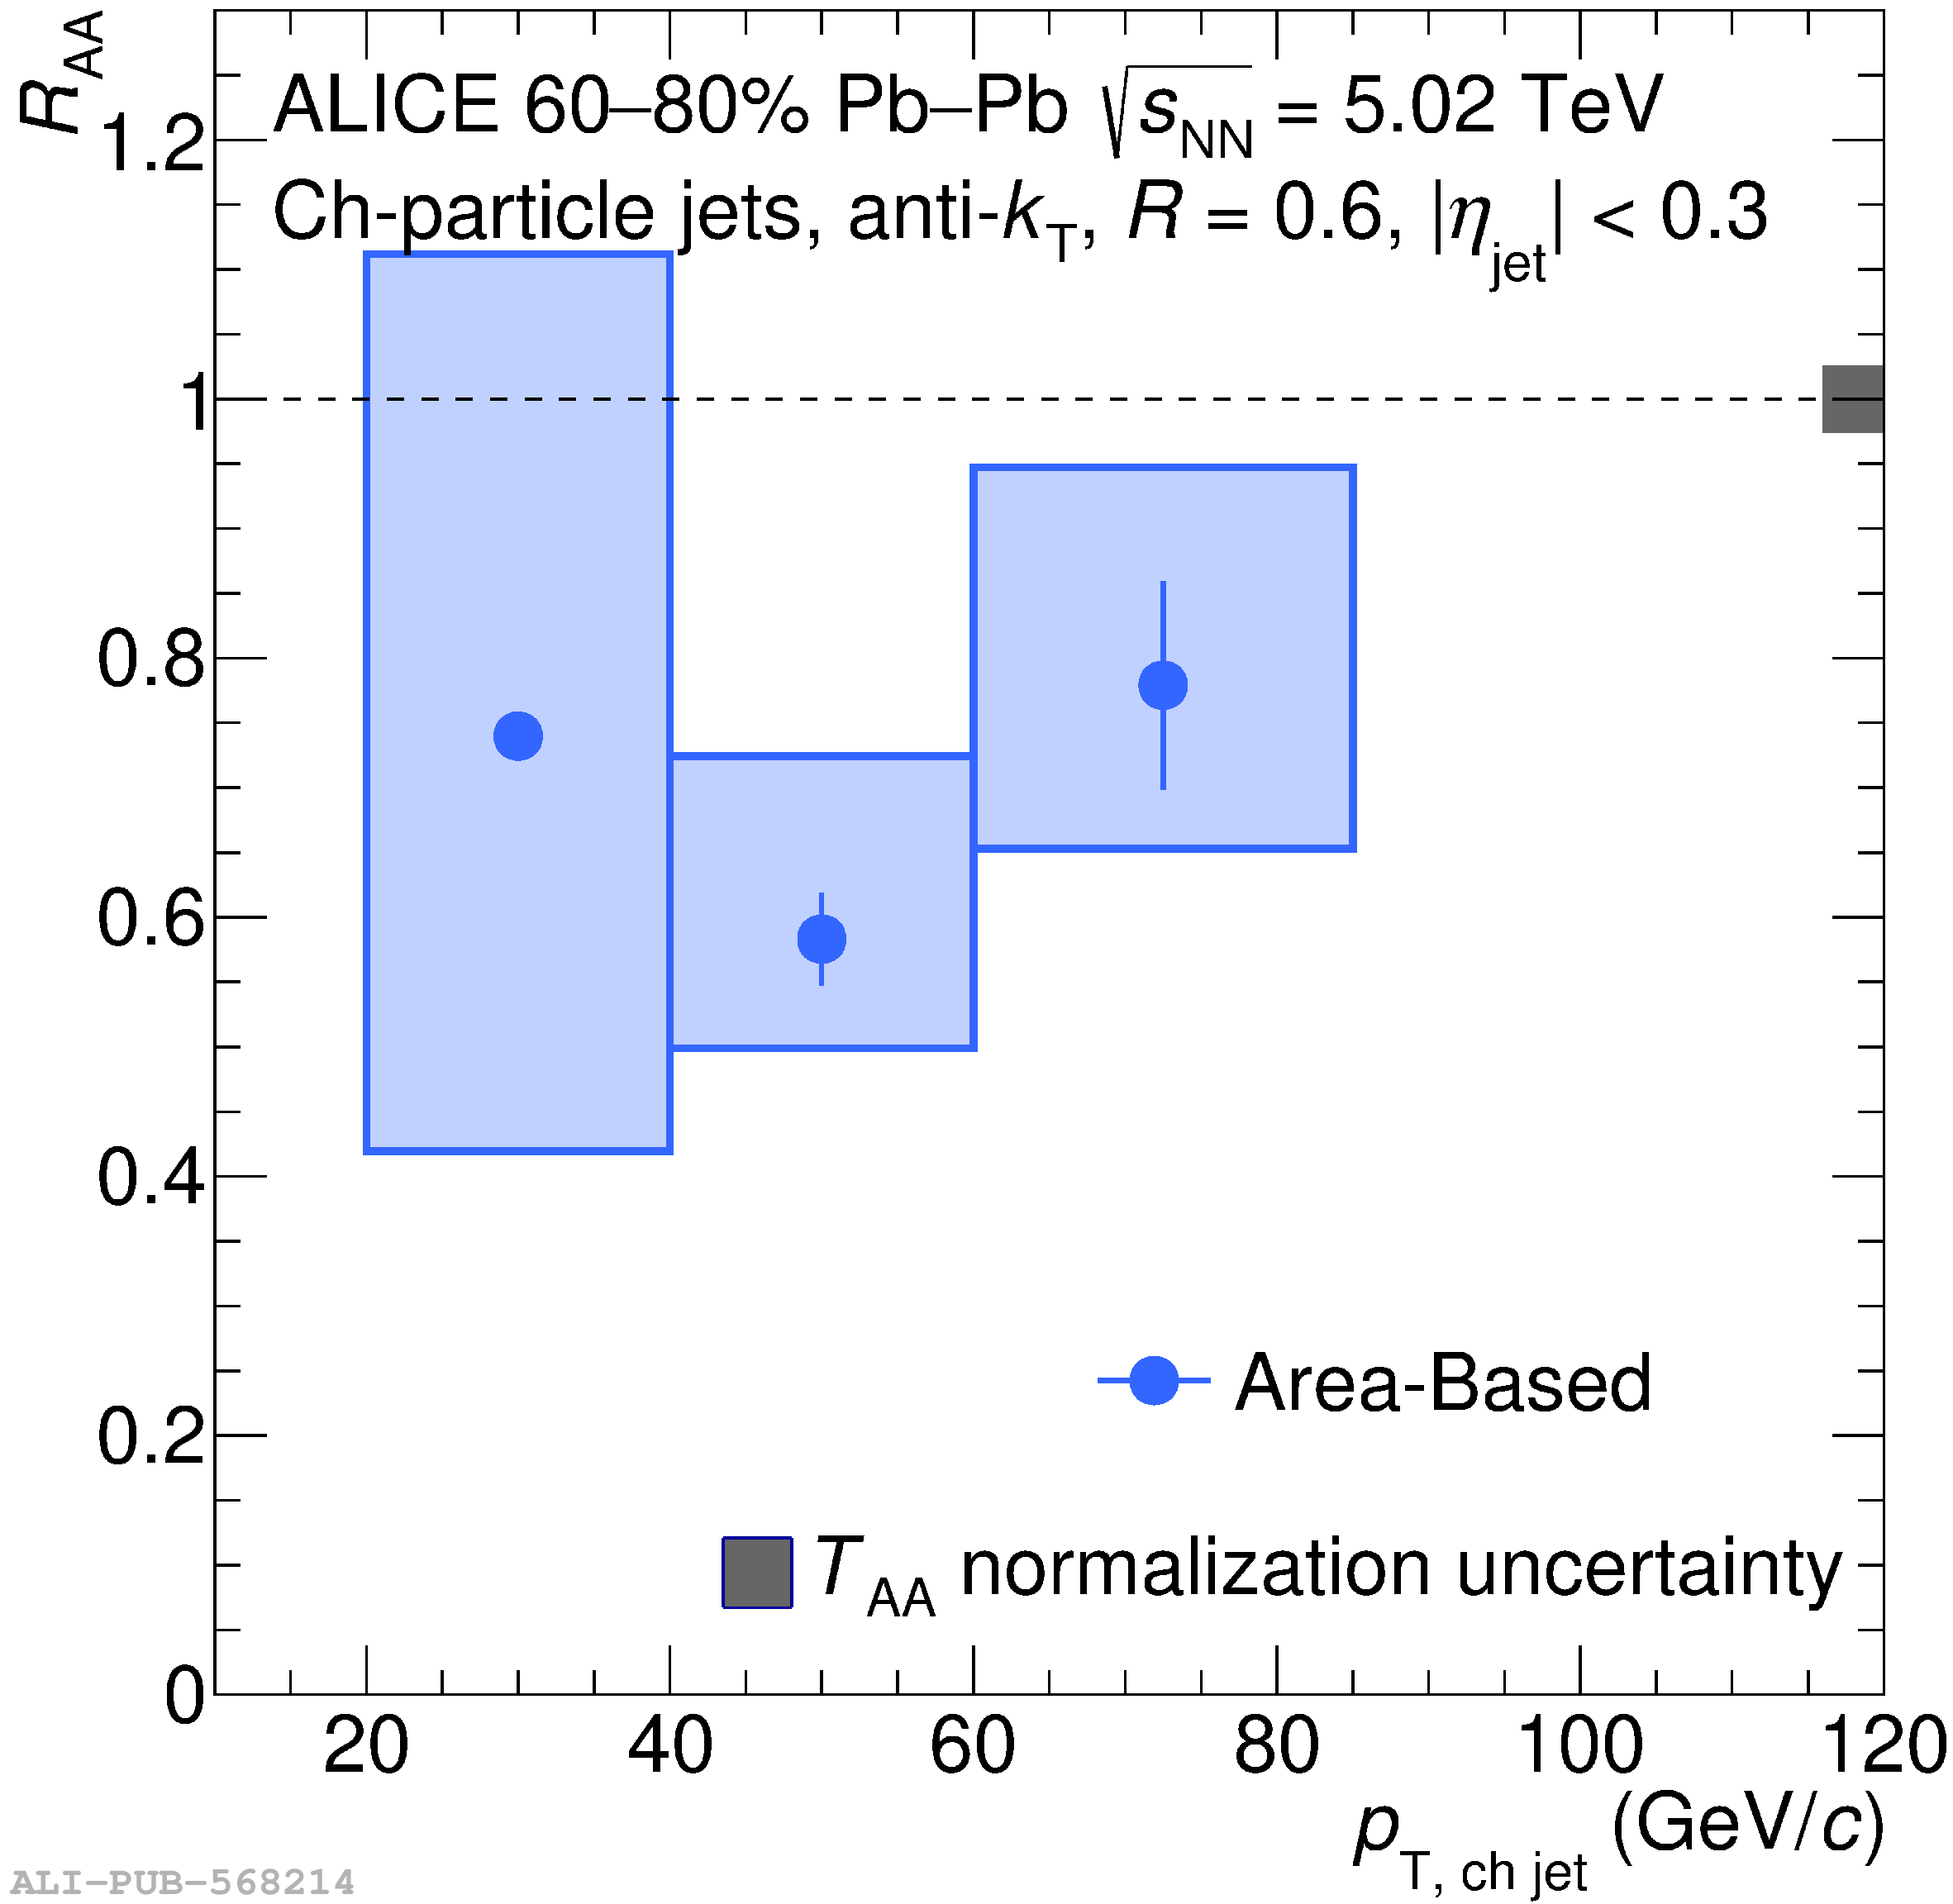 |
Figure 5
Nuclear modification factors for jets with $R=0.6$ in 0--10\% (left) and 30--50\% (right) central Pb-Pb collisions outlining the impact of the various fragmentation models on the final result. Note that the systematic uncertainties, described in Sec. 6, are drawn both with and without the fragmentation uncertainties in the empty and filled boxes, respectively. | 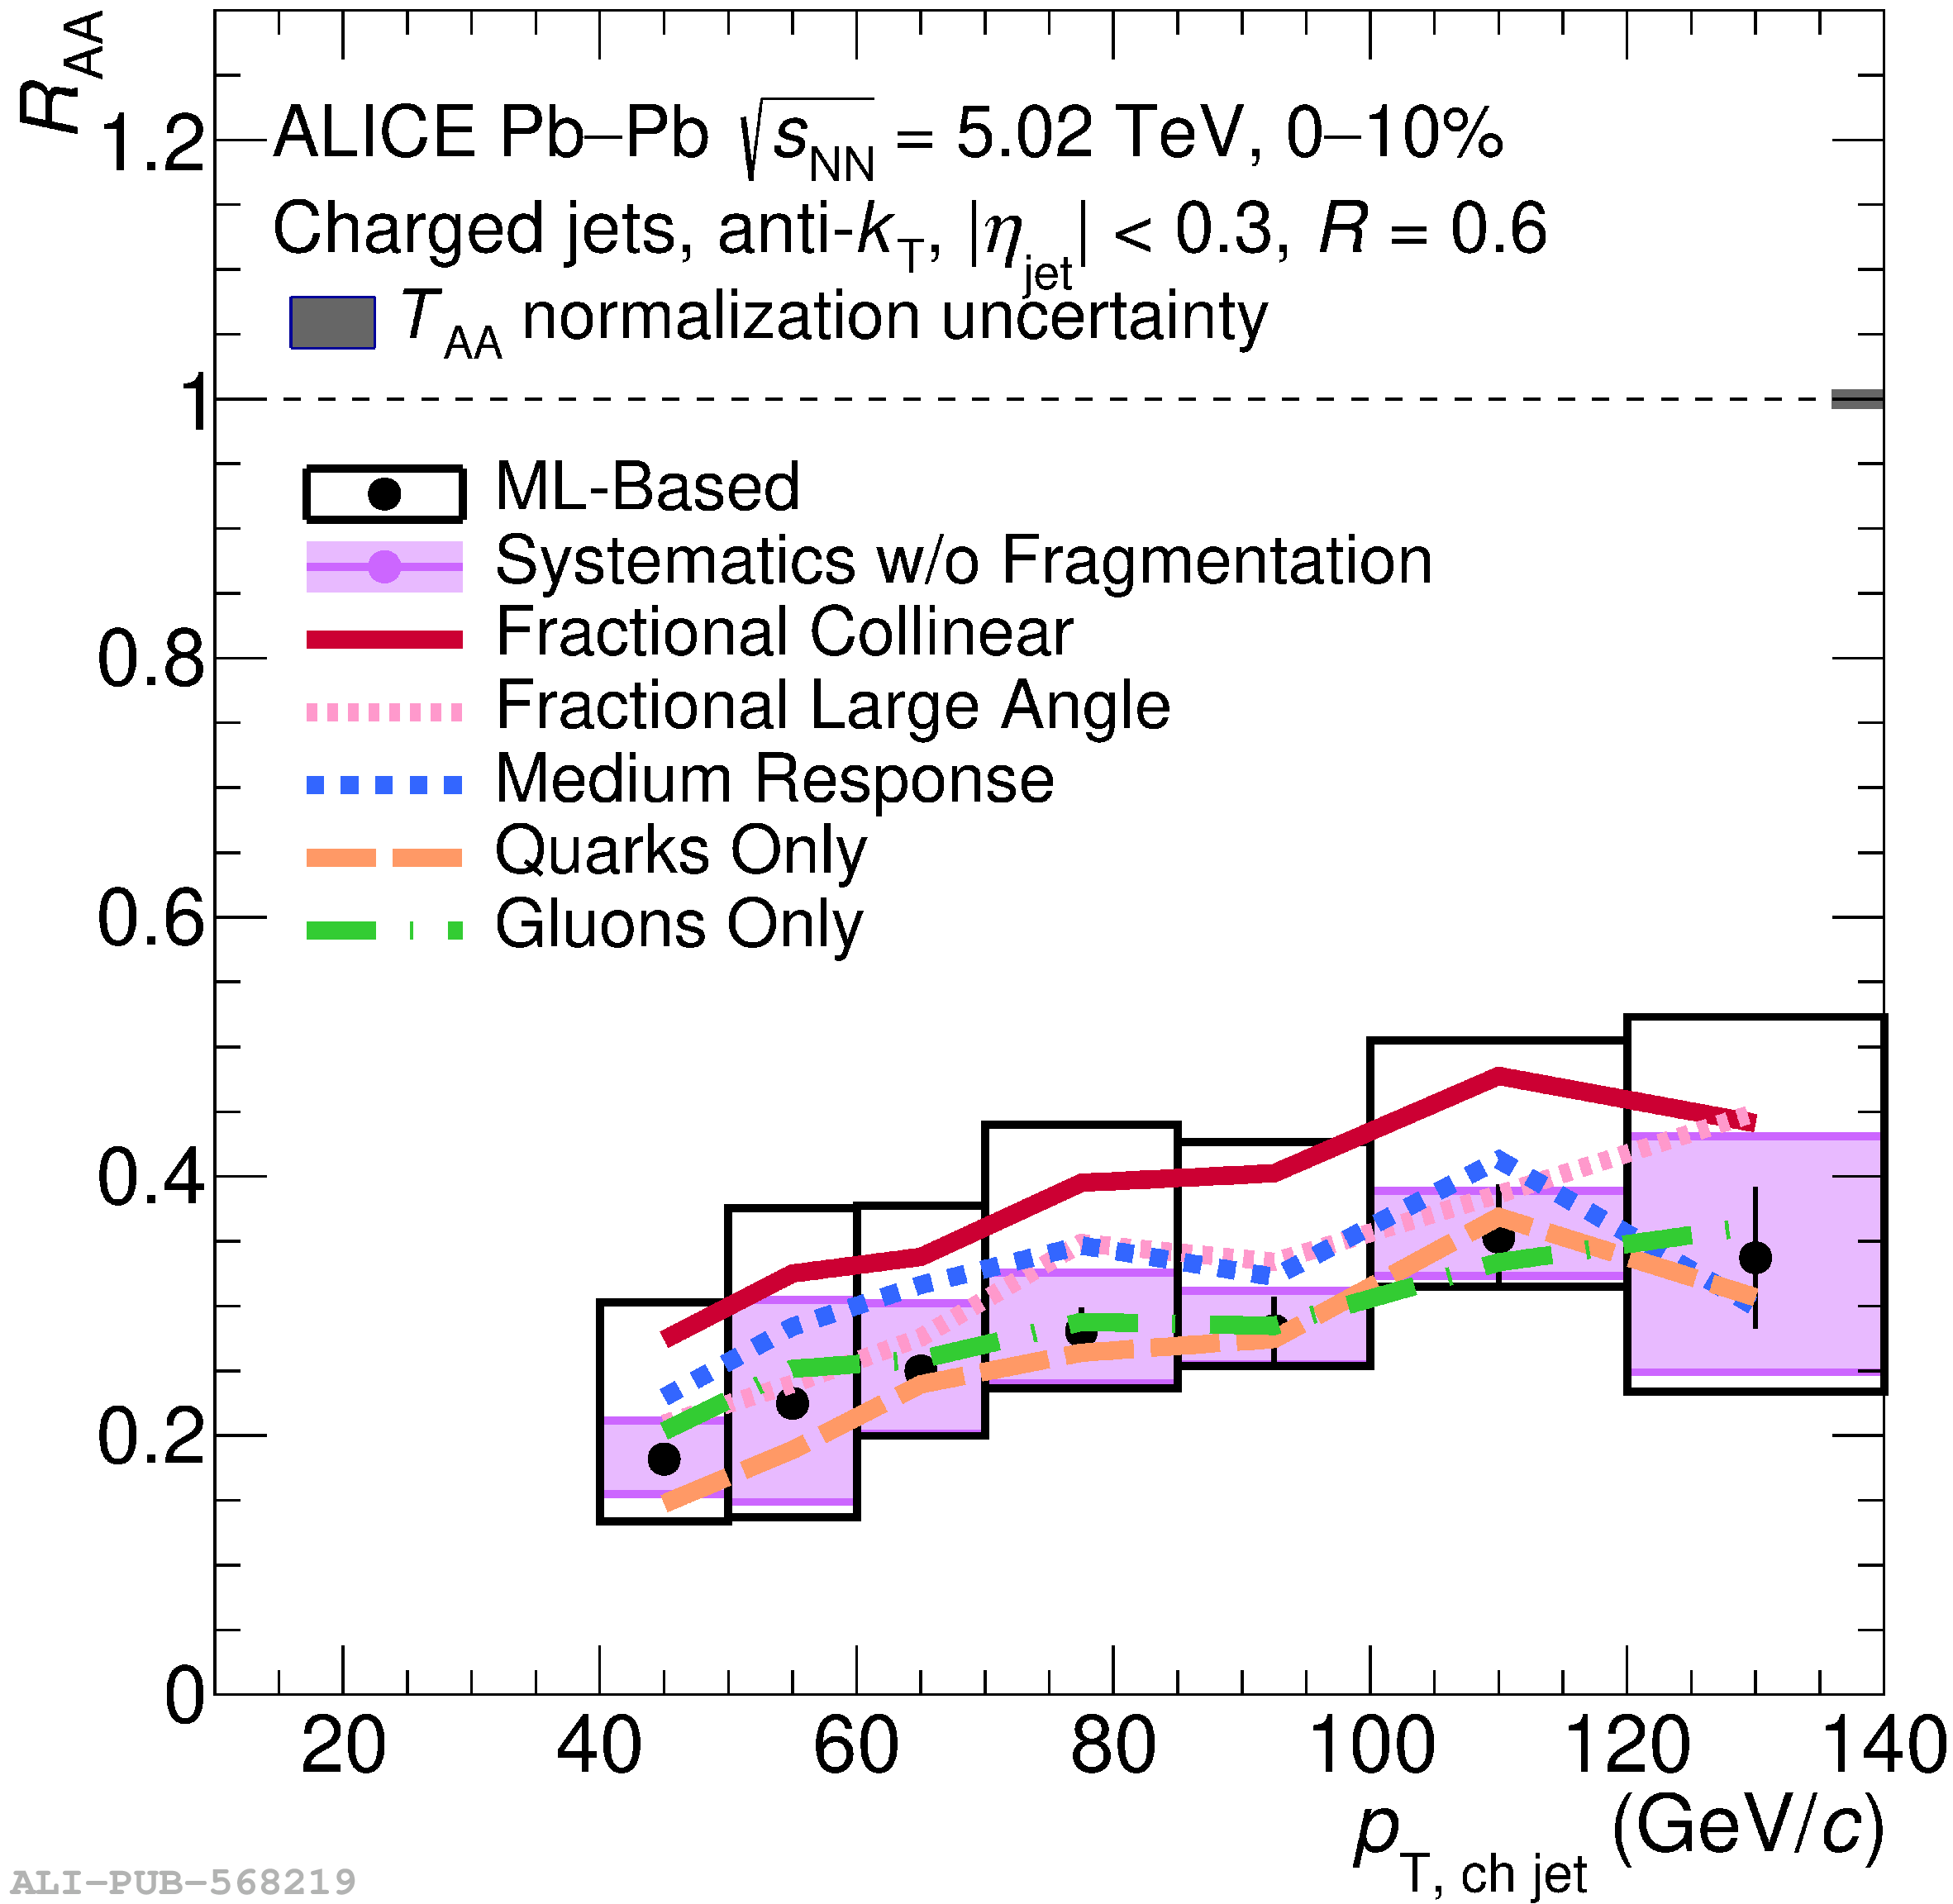 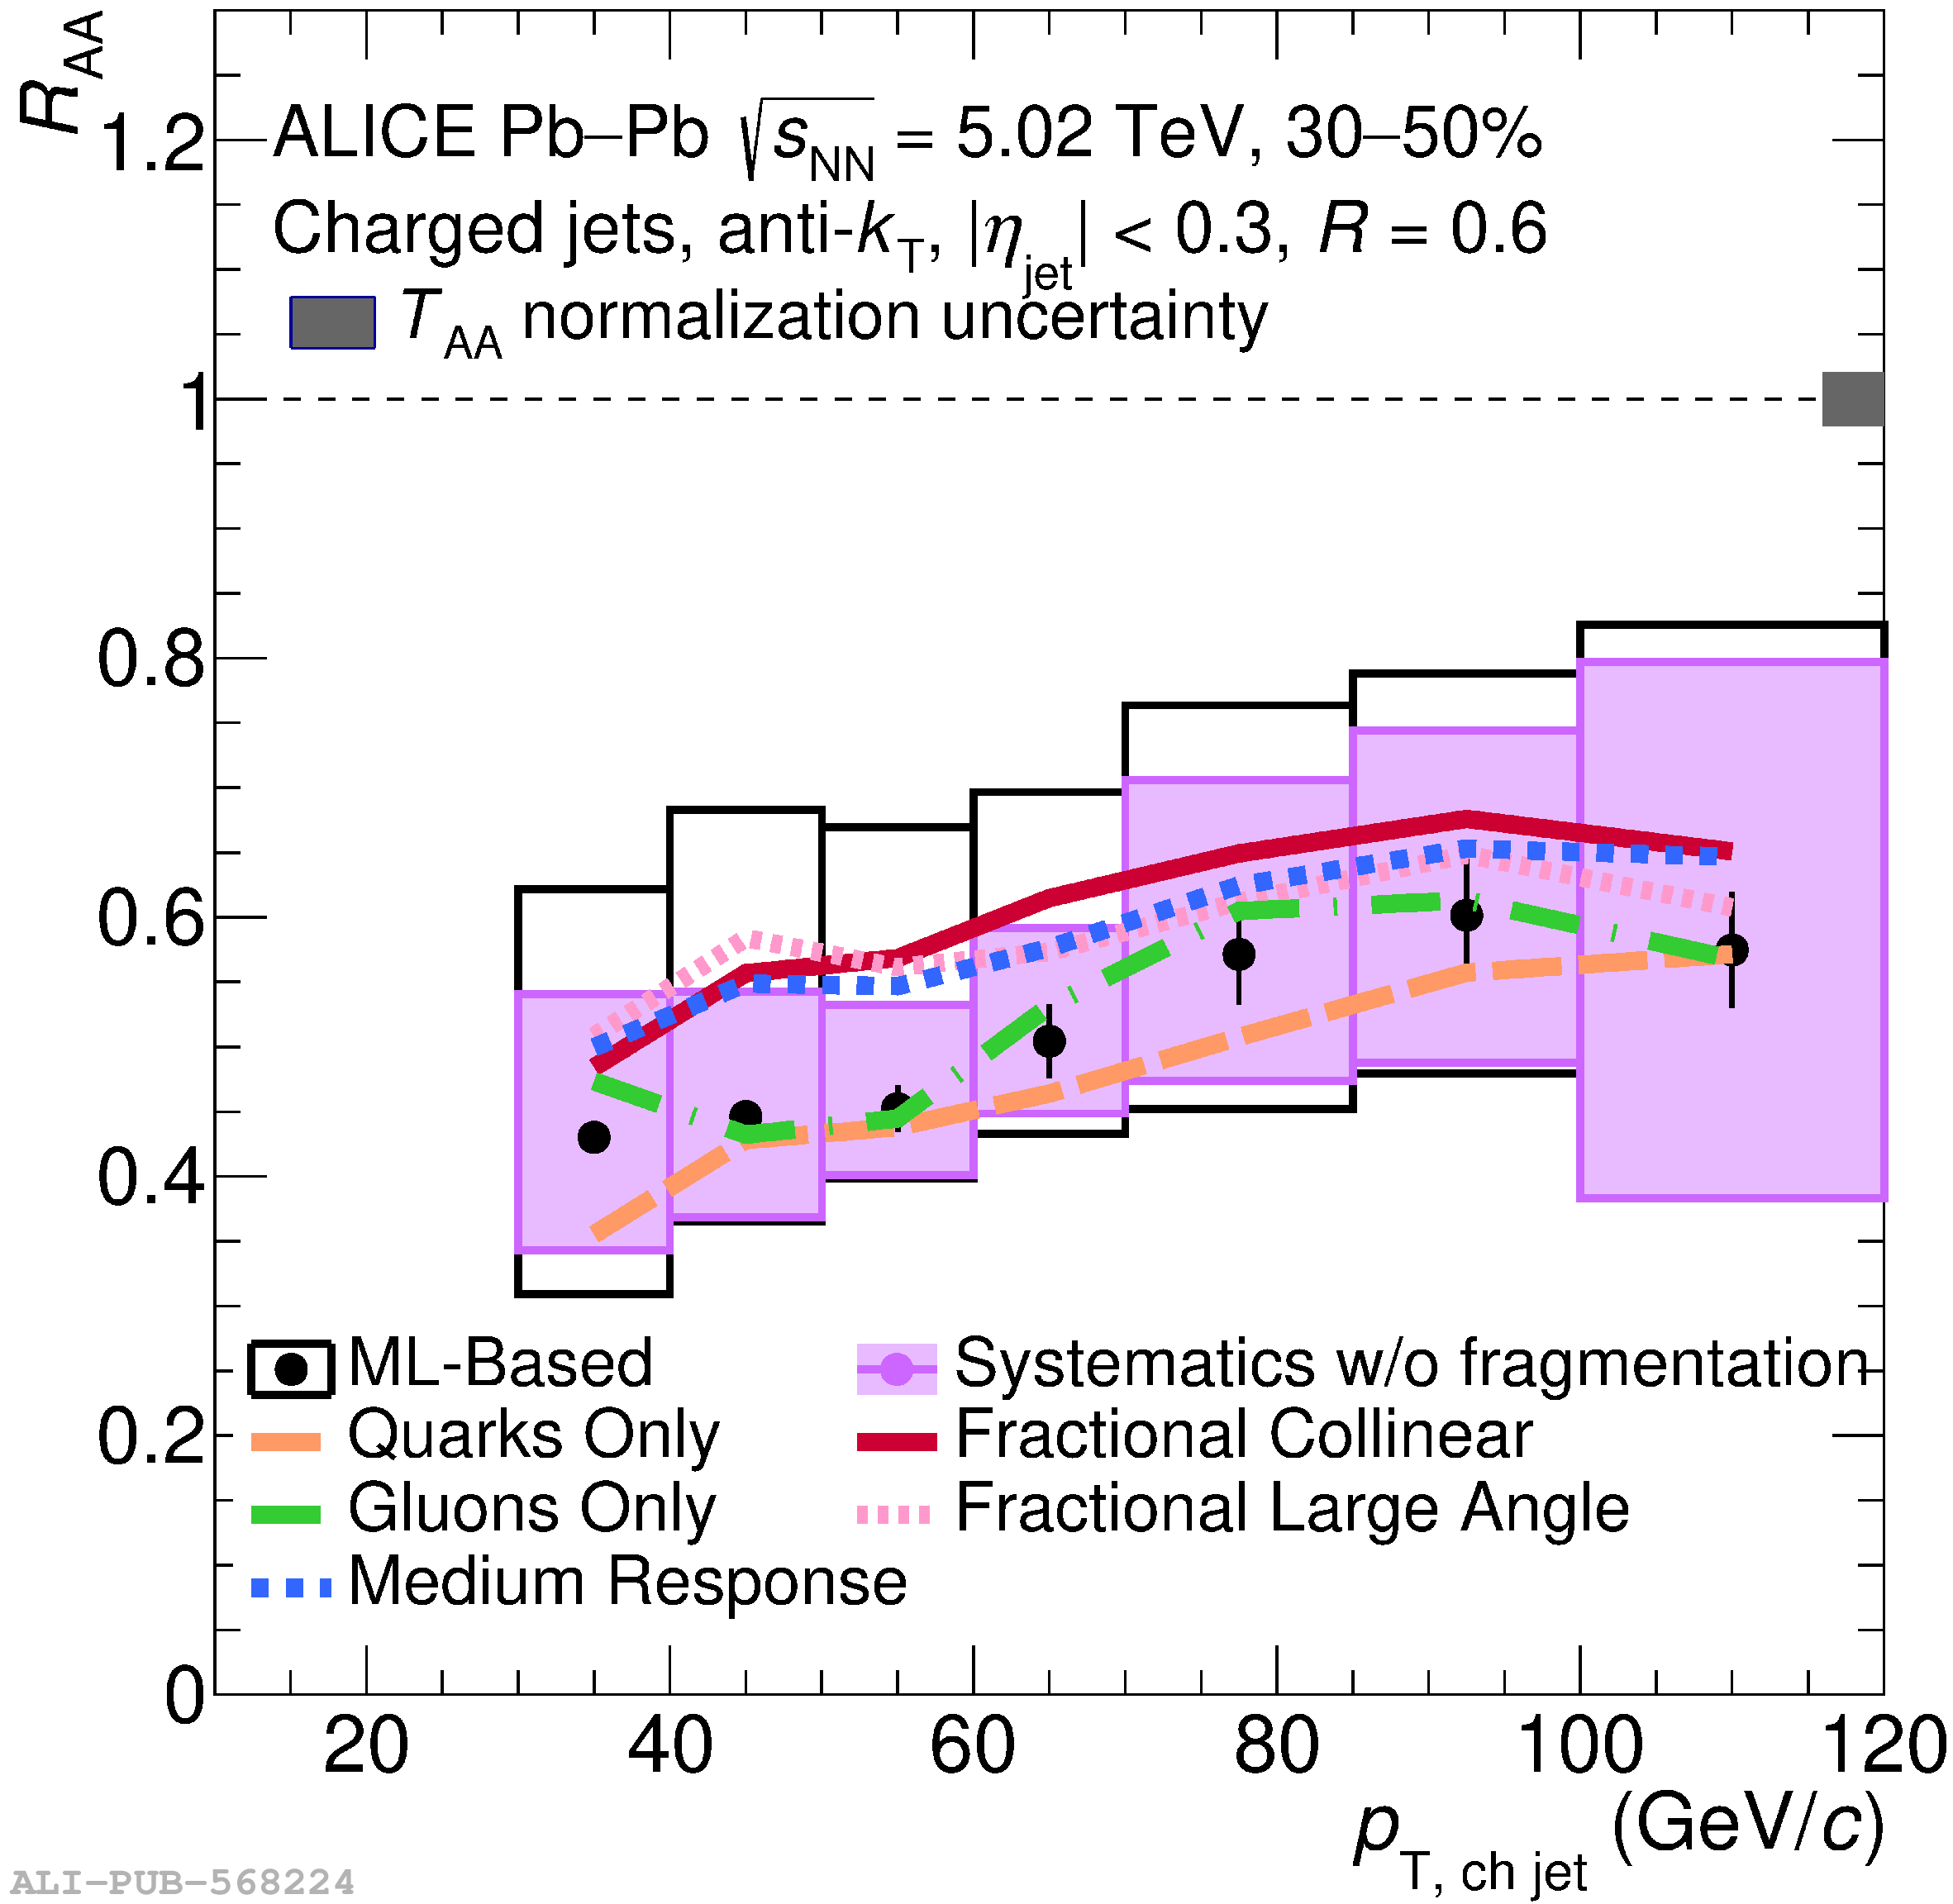 |
Figure 6
Nuclear modification factors for $R=0.2$, $R=0.4$, and $R=0.6$, shown for 0--10\% and 30--50\% central \PbPb\ collisions compared to theoretical calculations incorporating jet quenching (see text for details). | 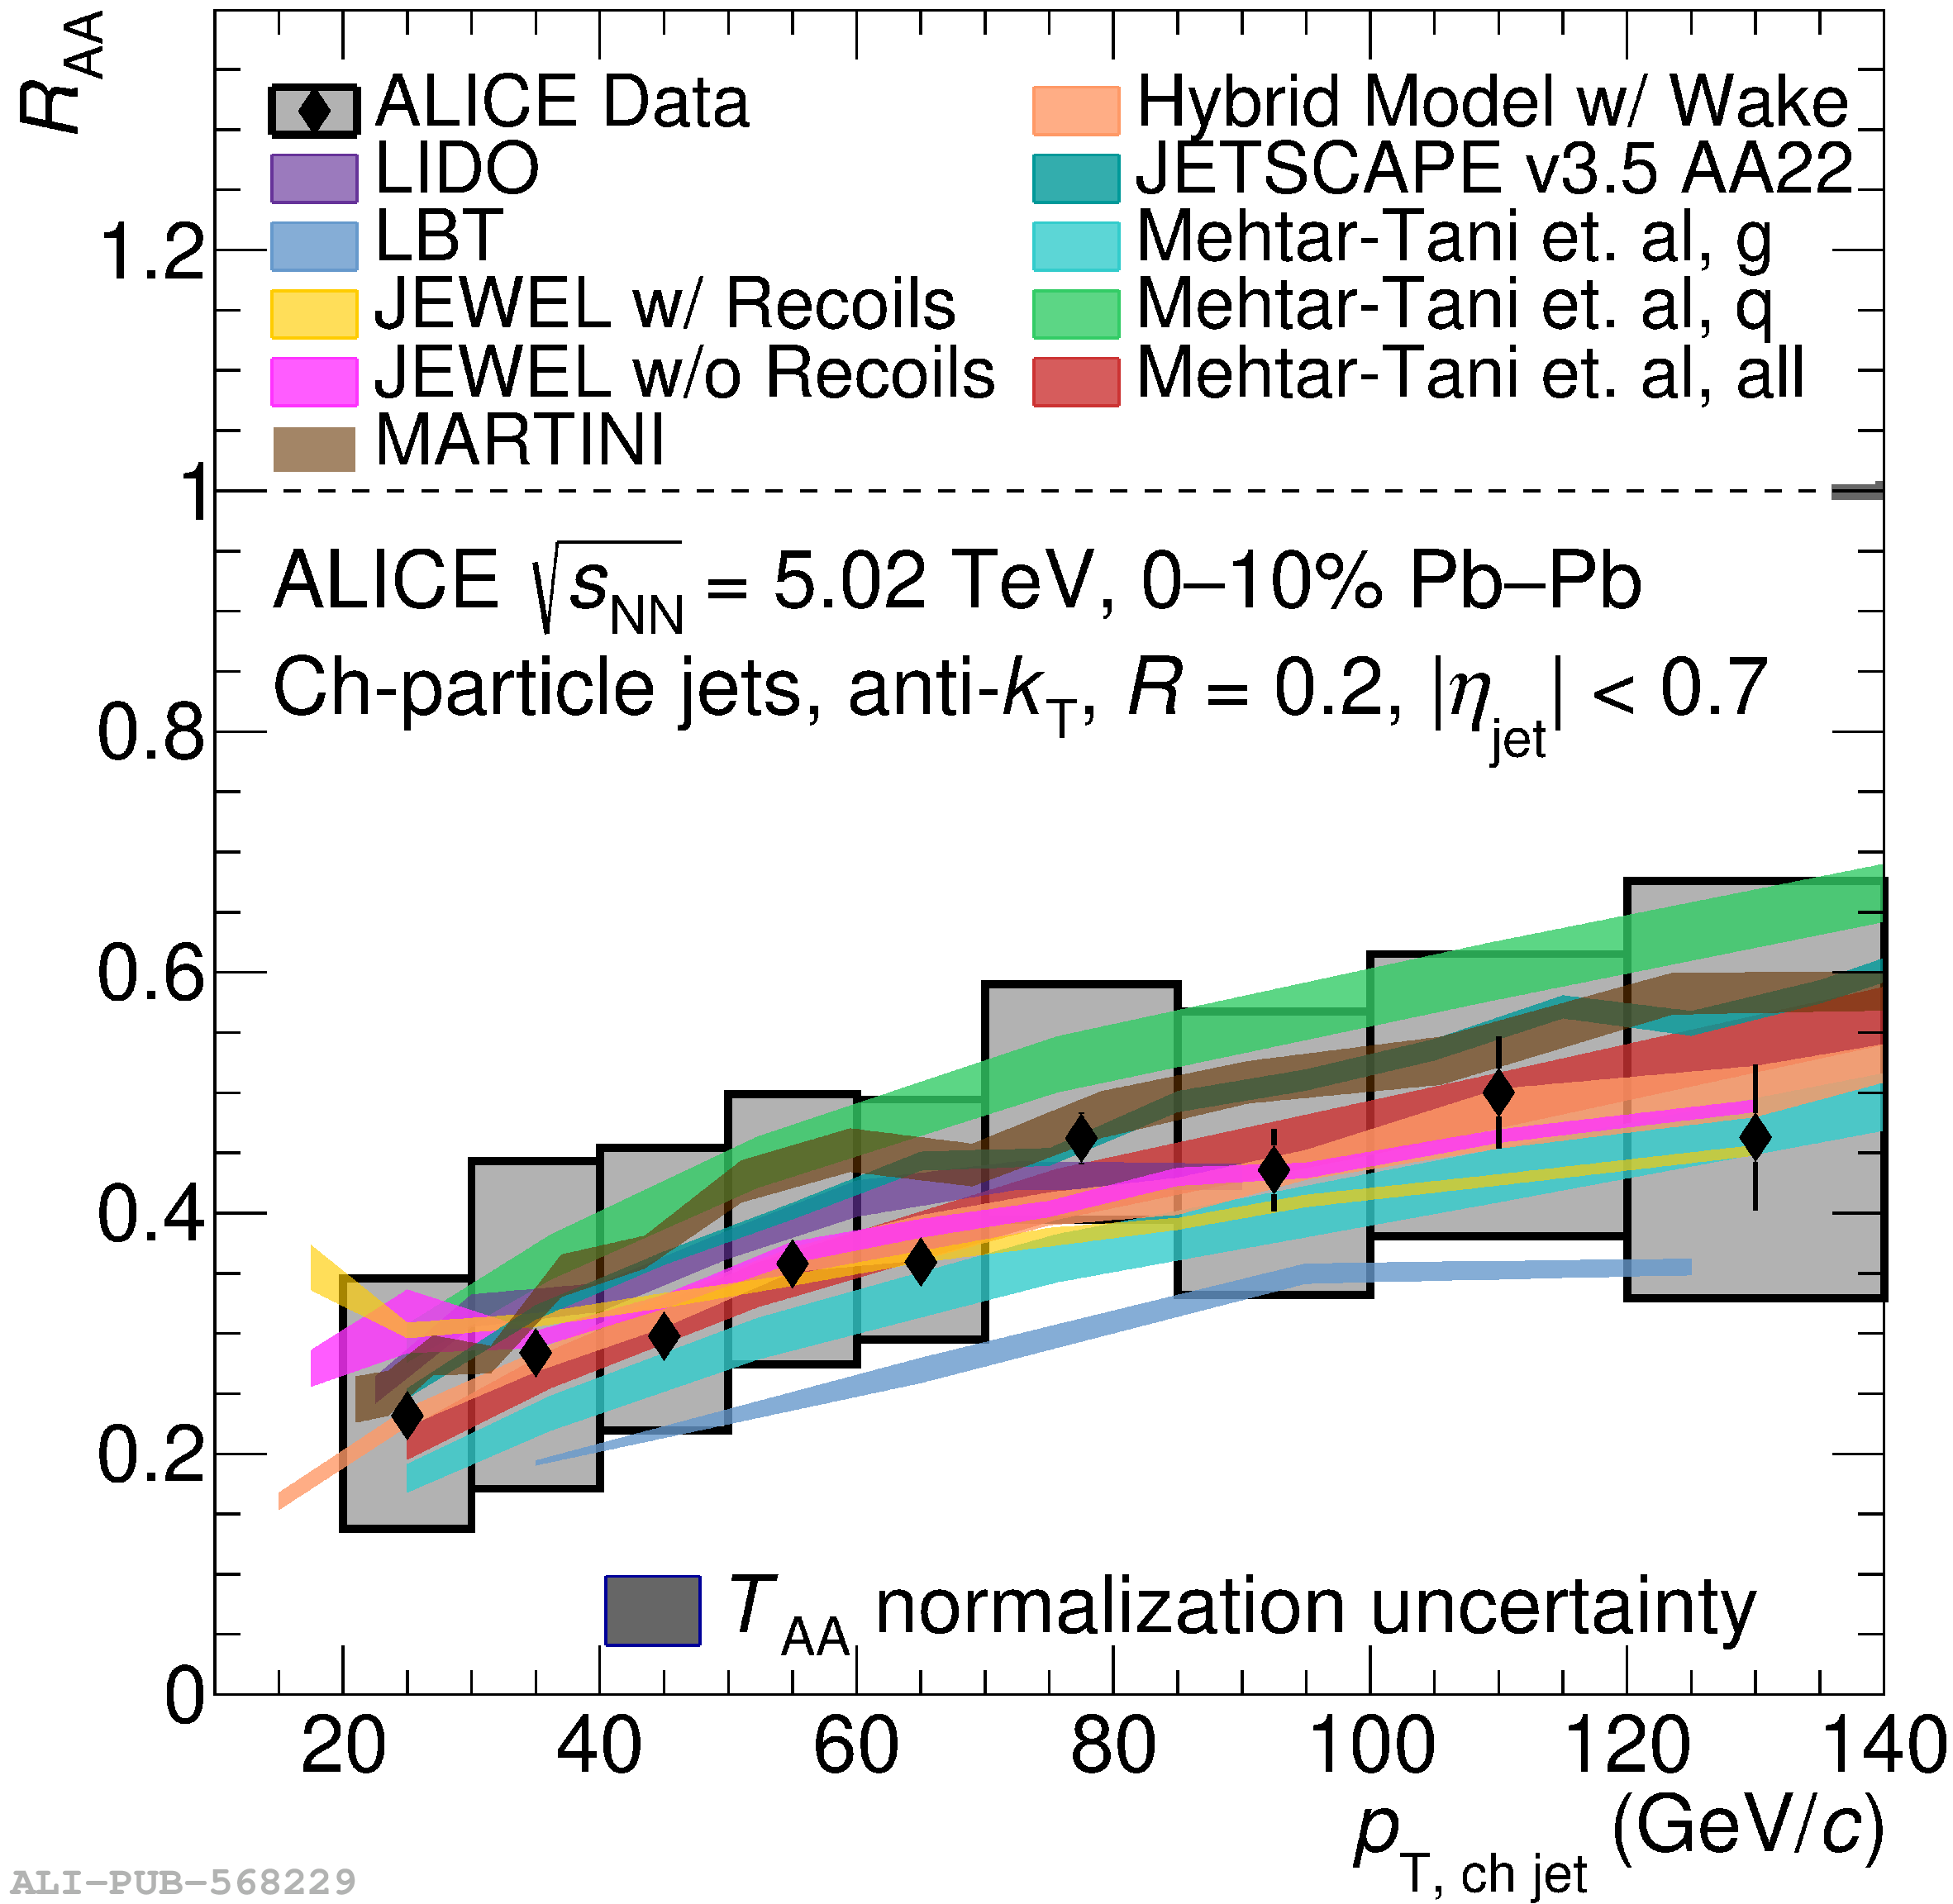 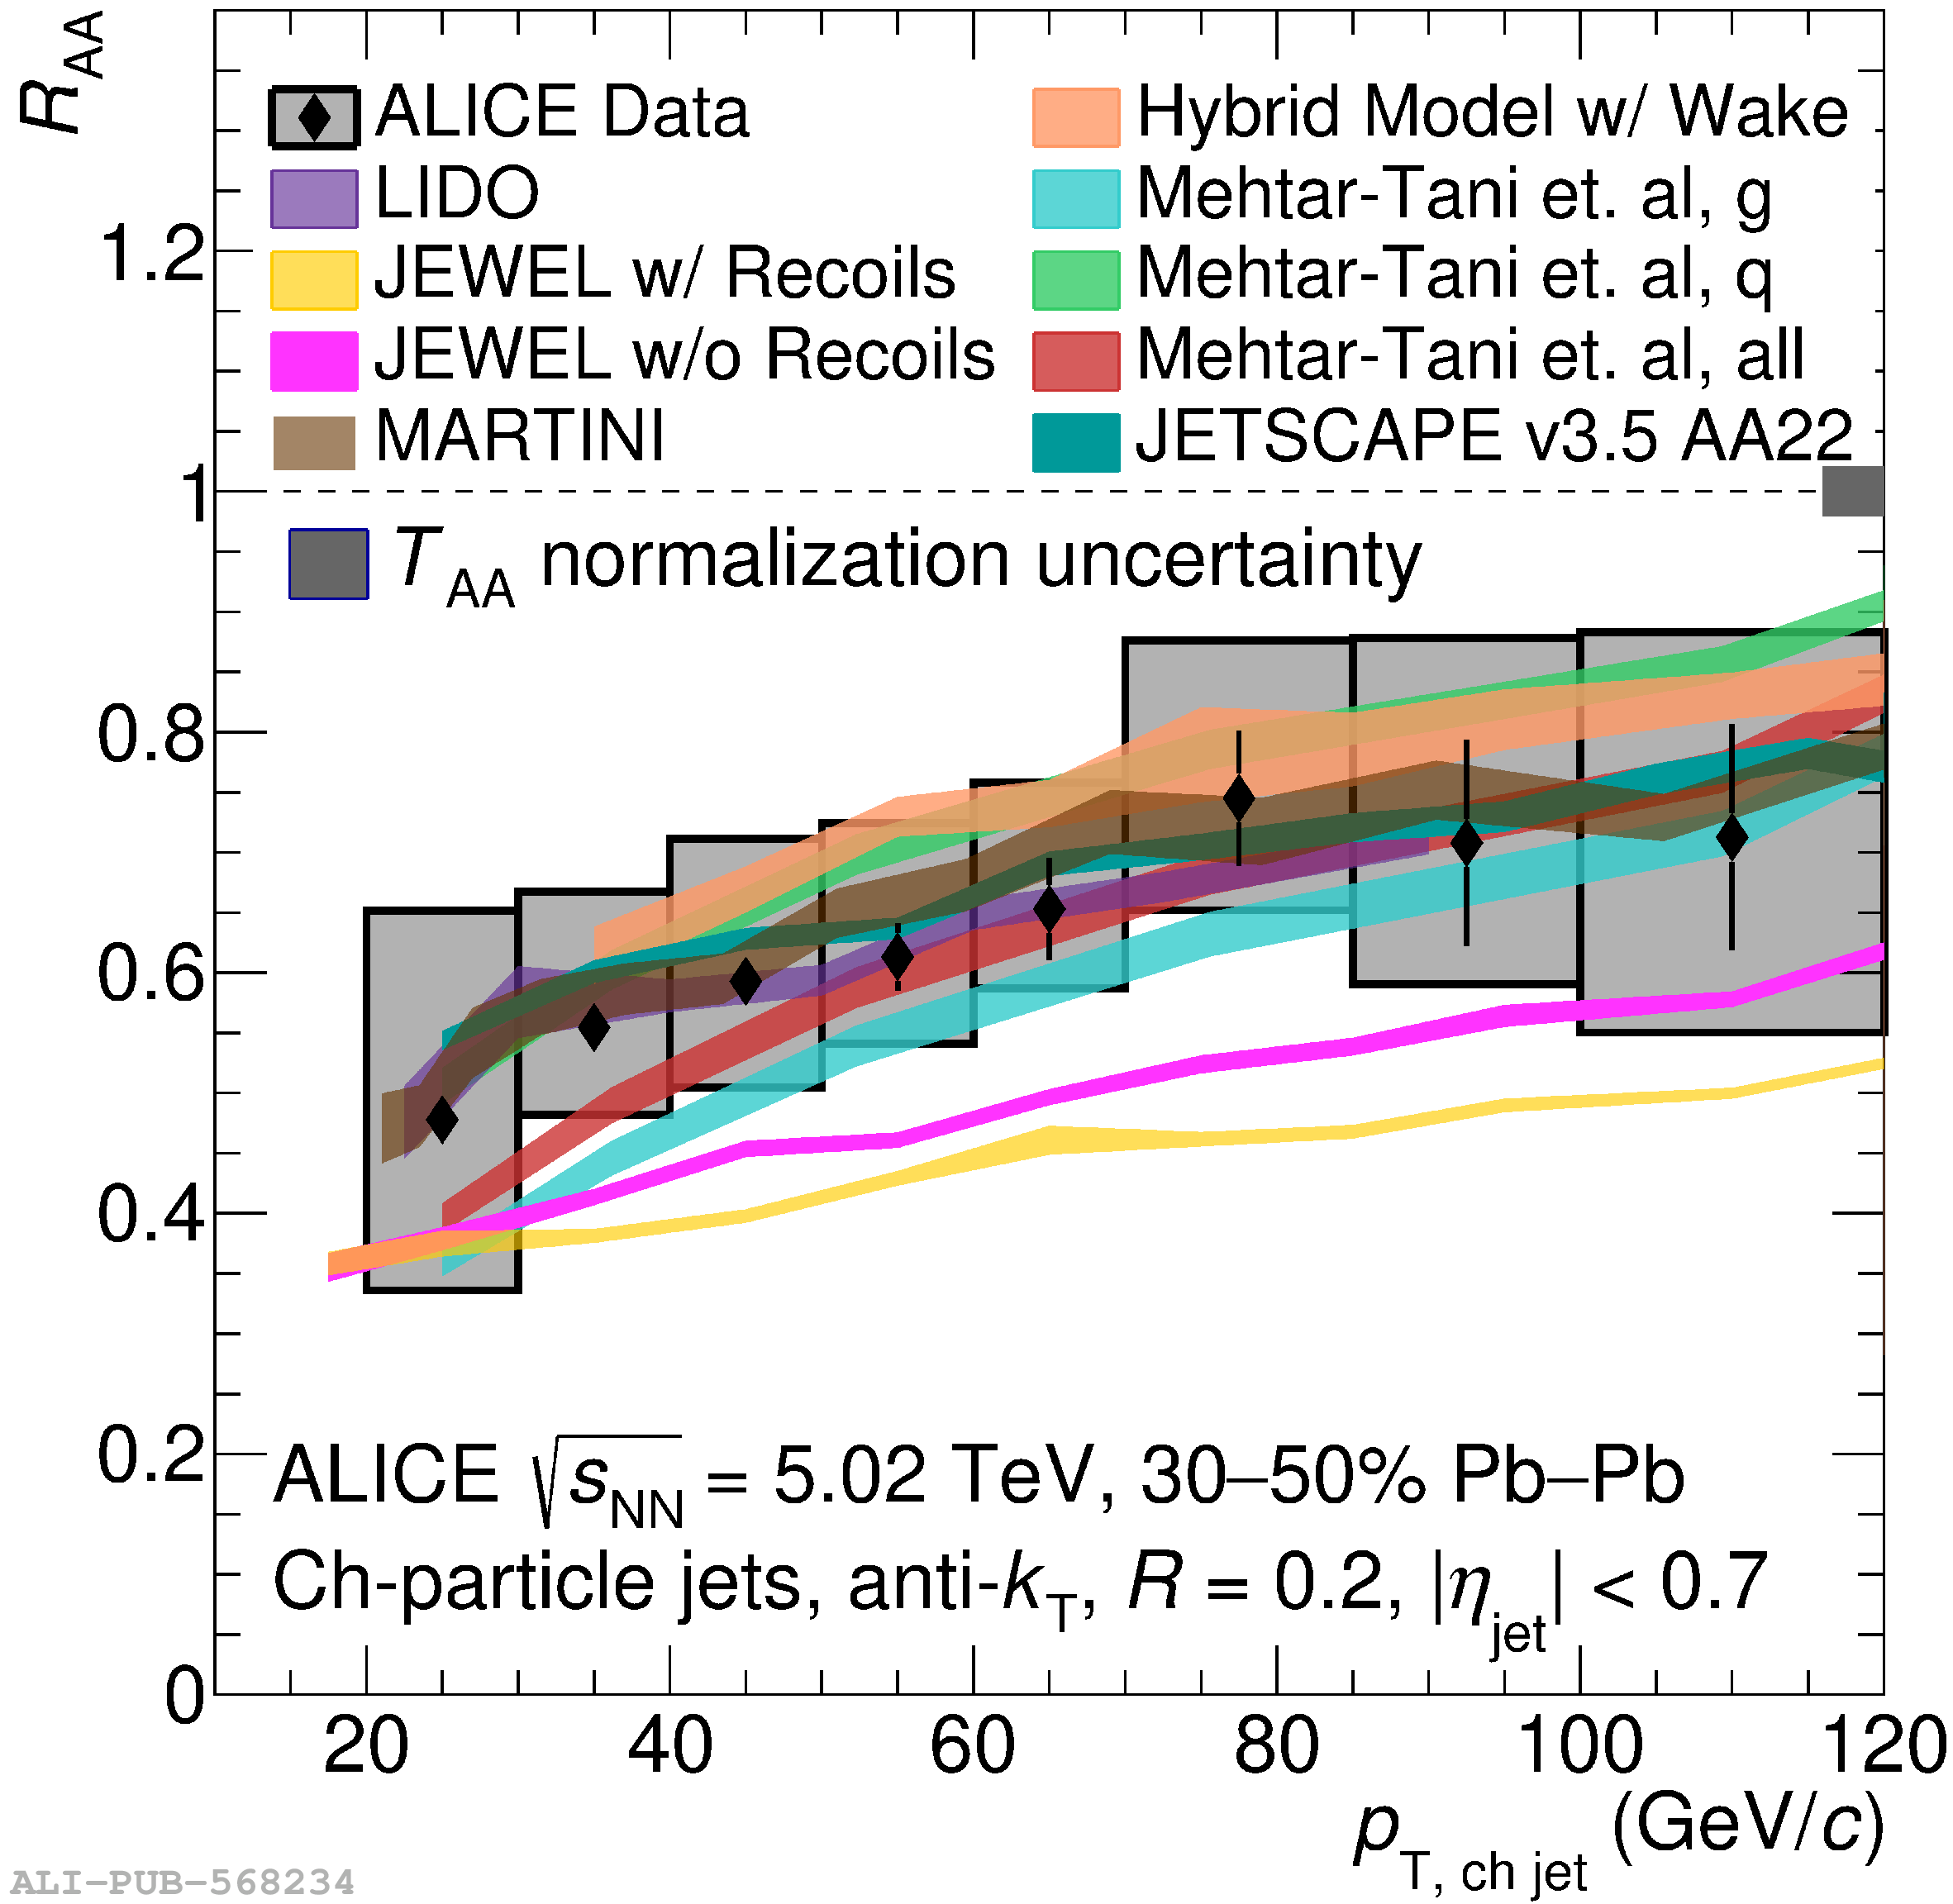 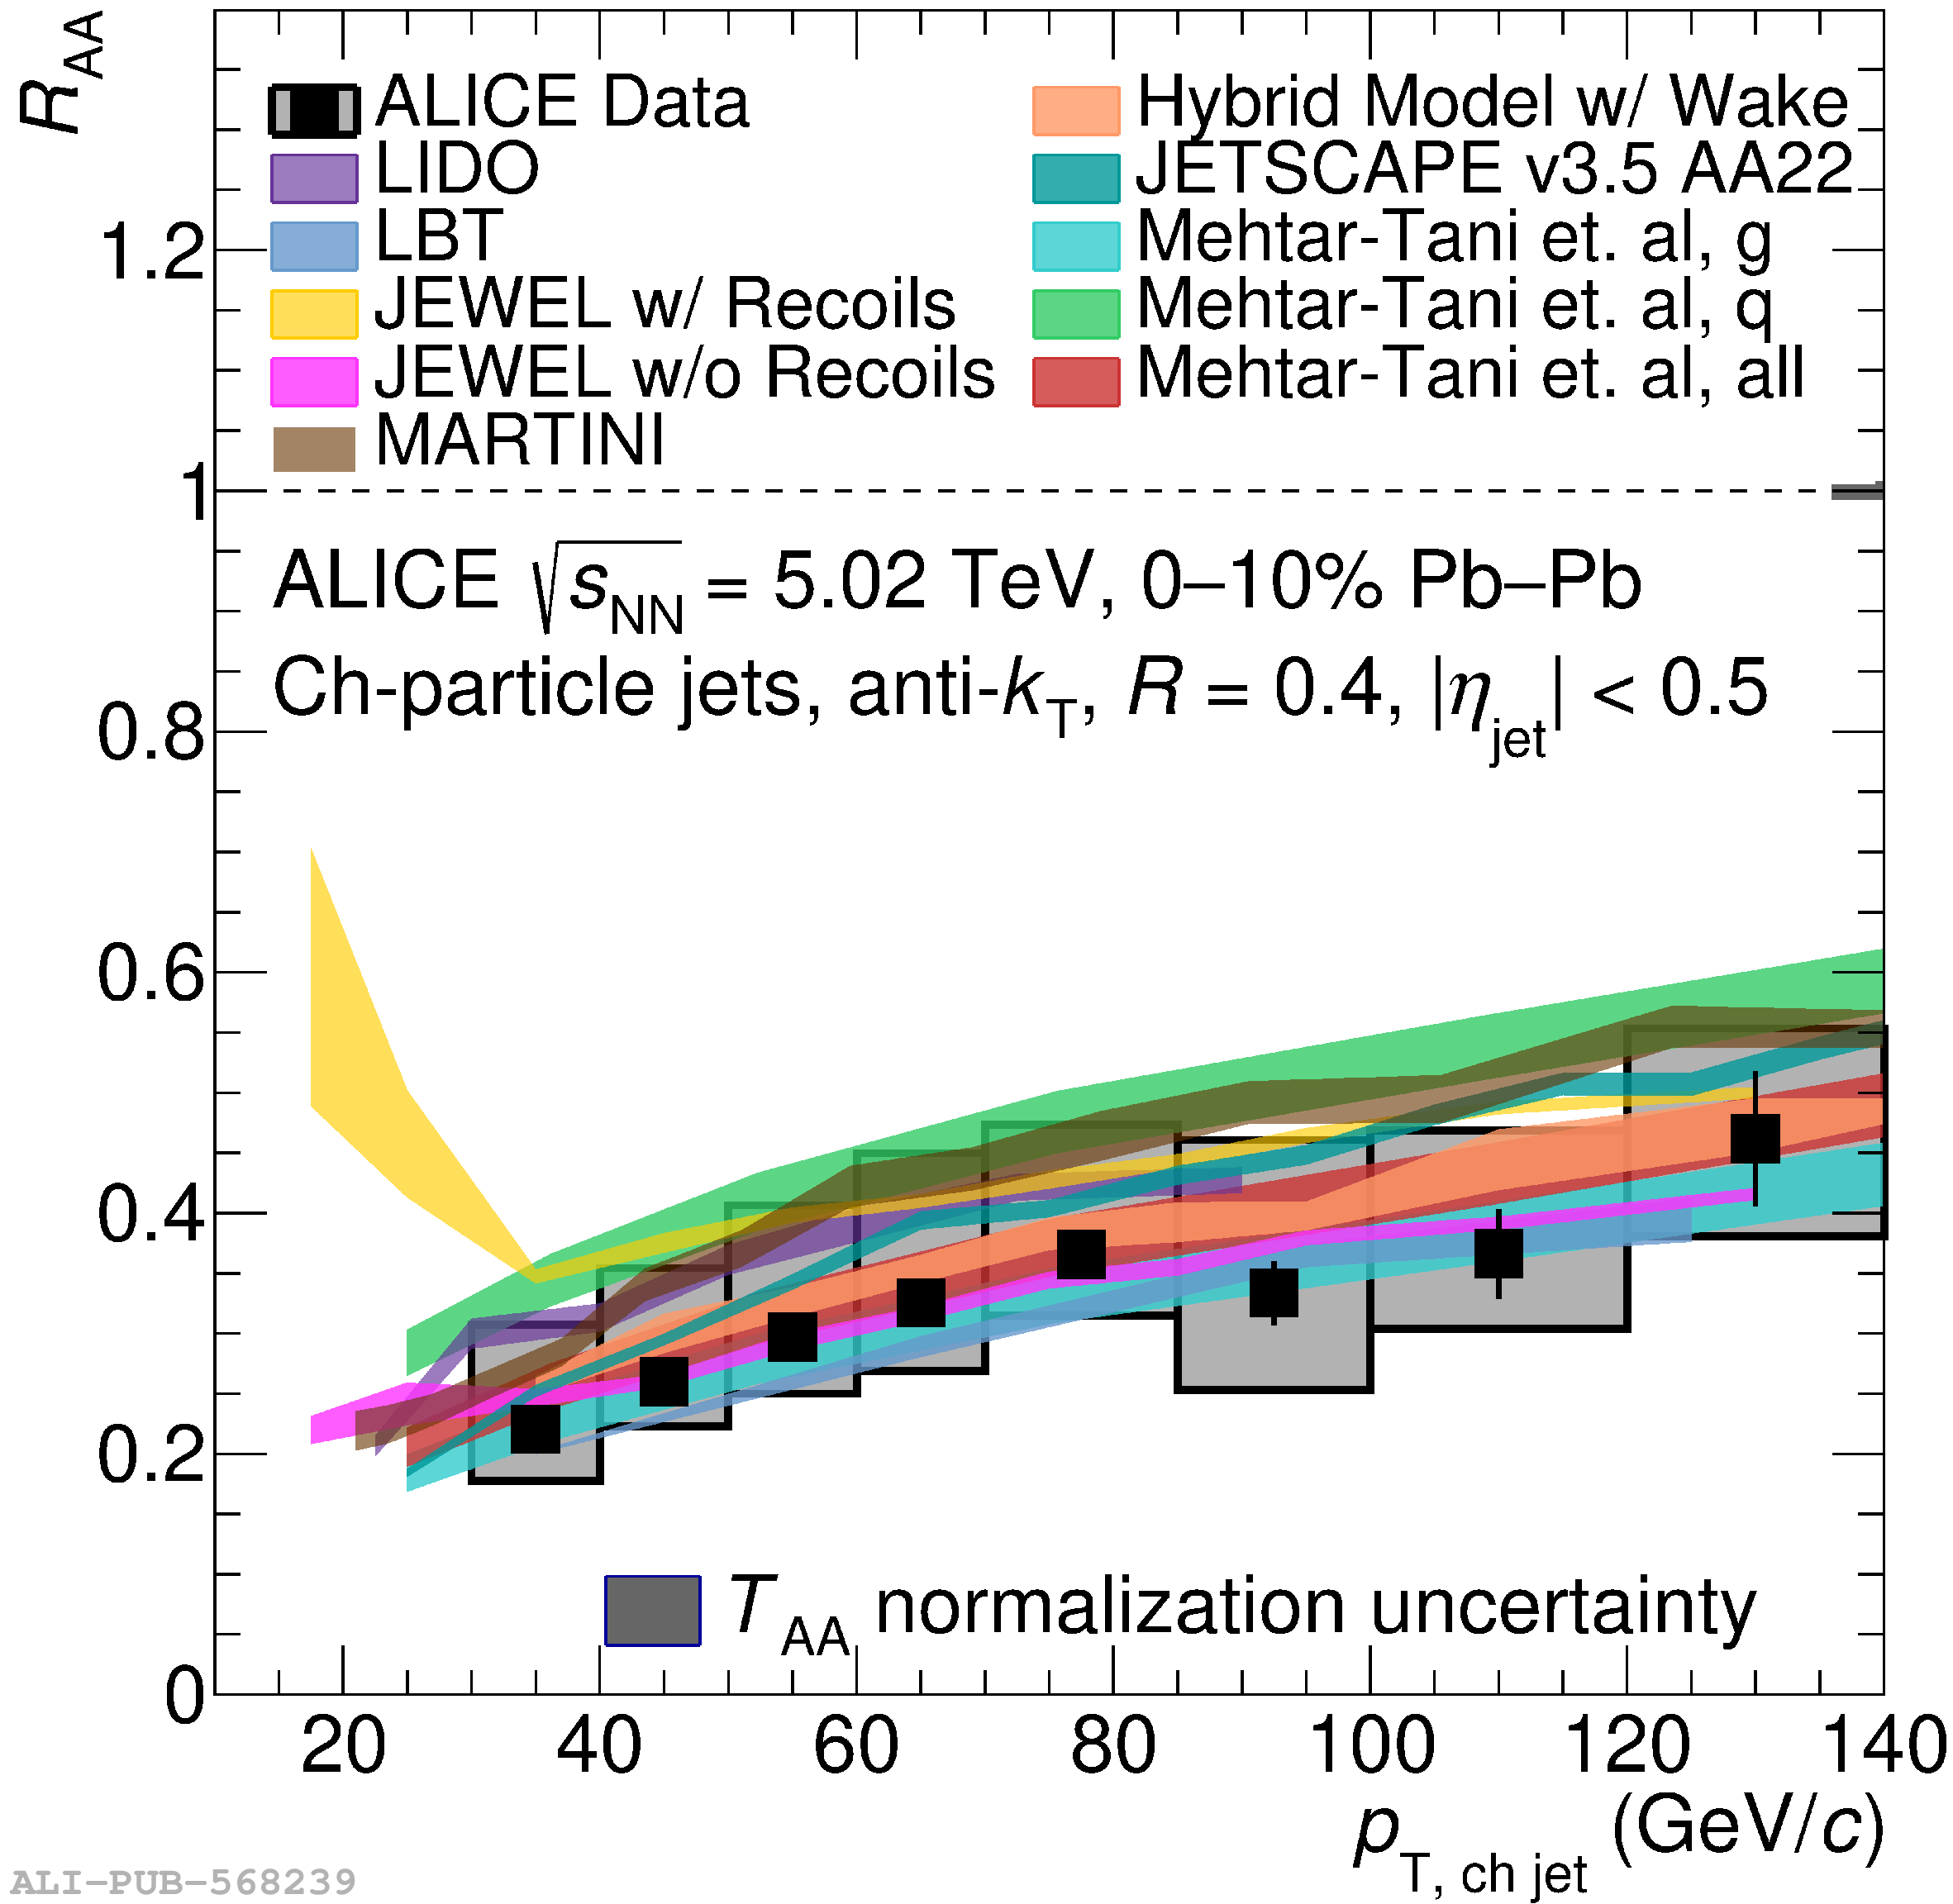 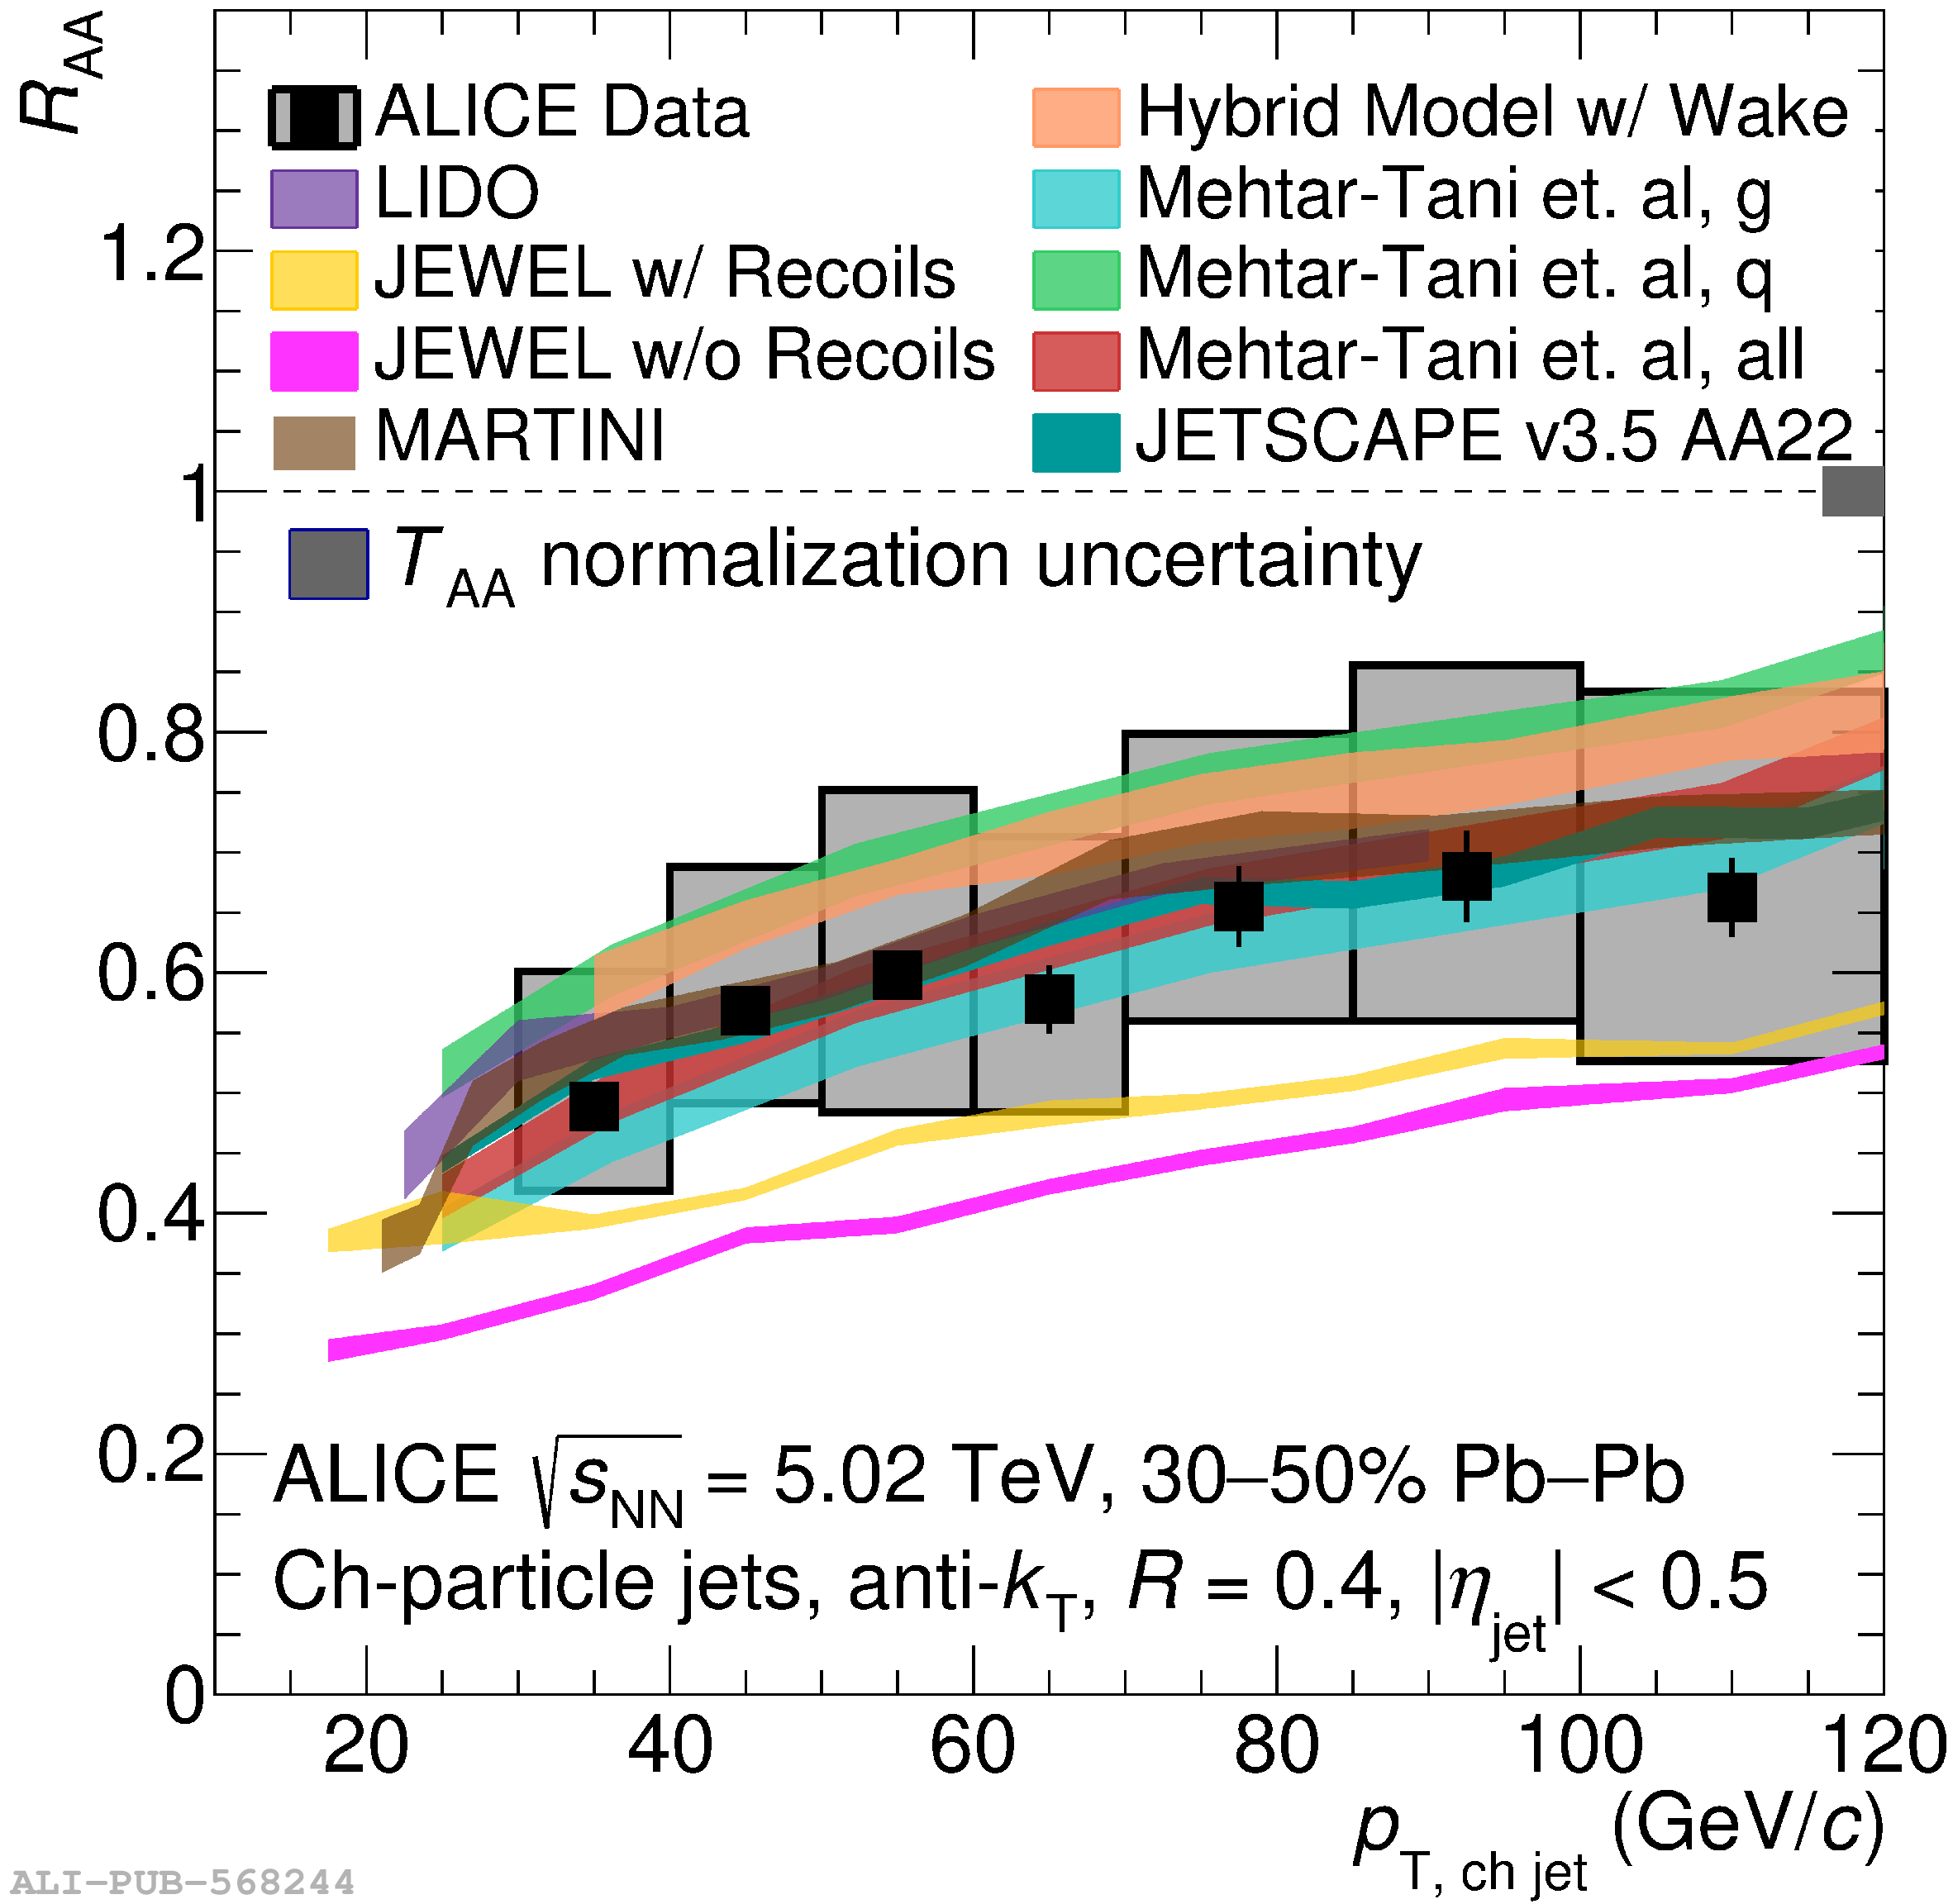 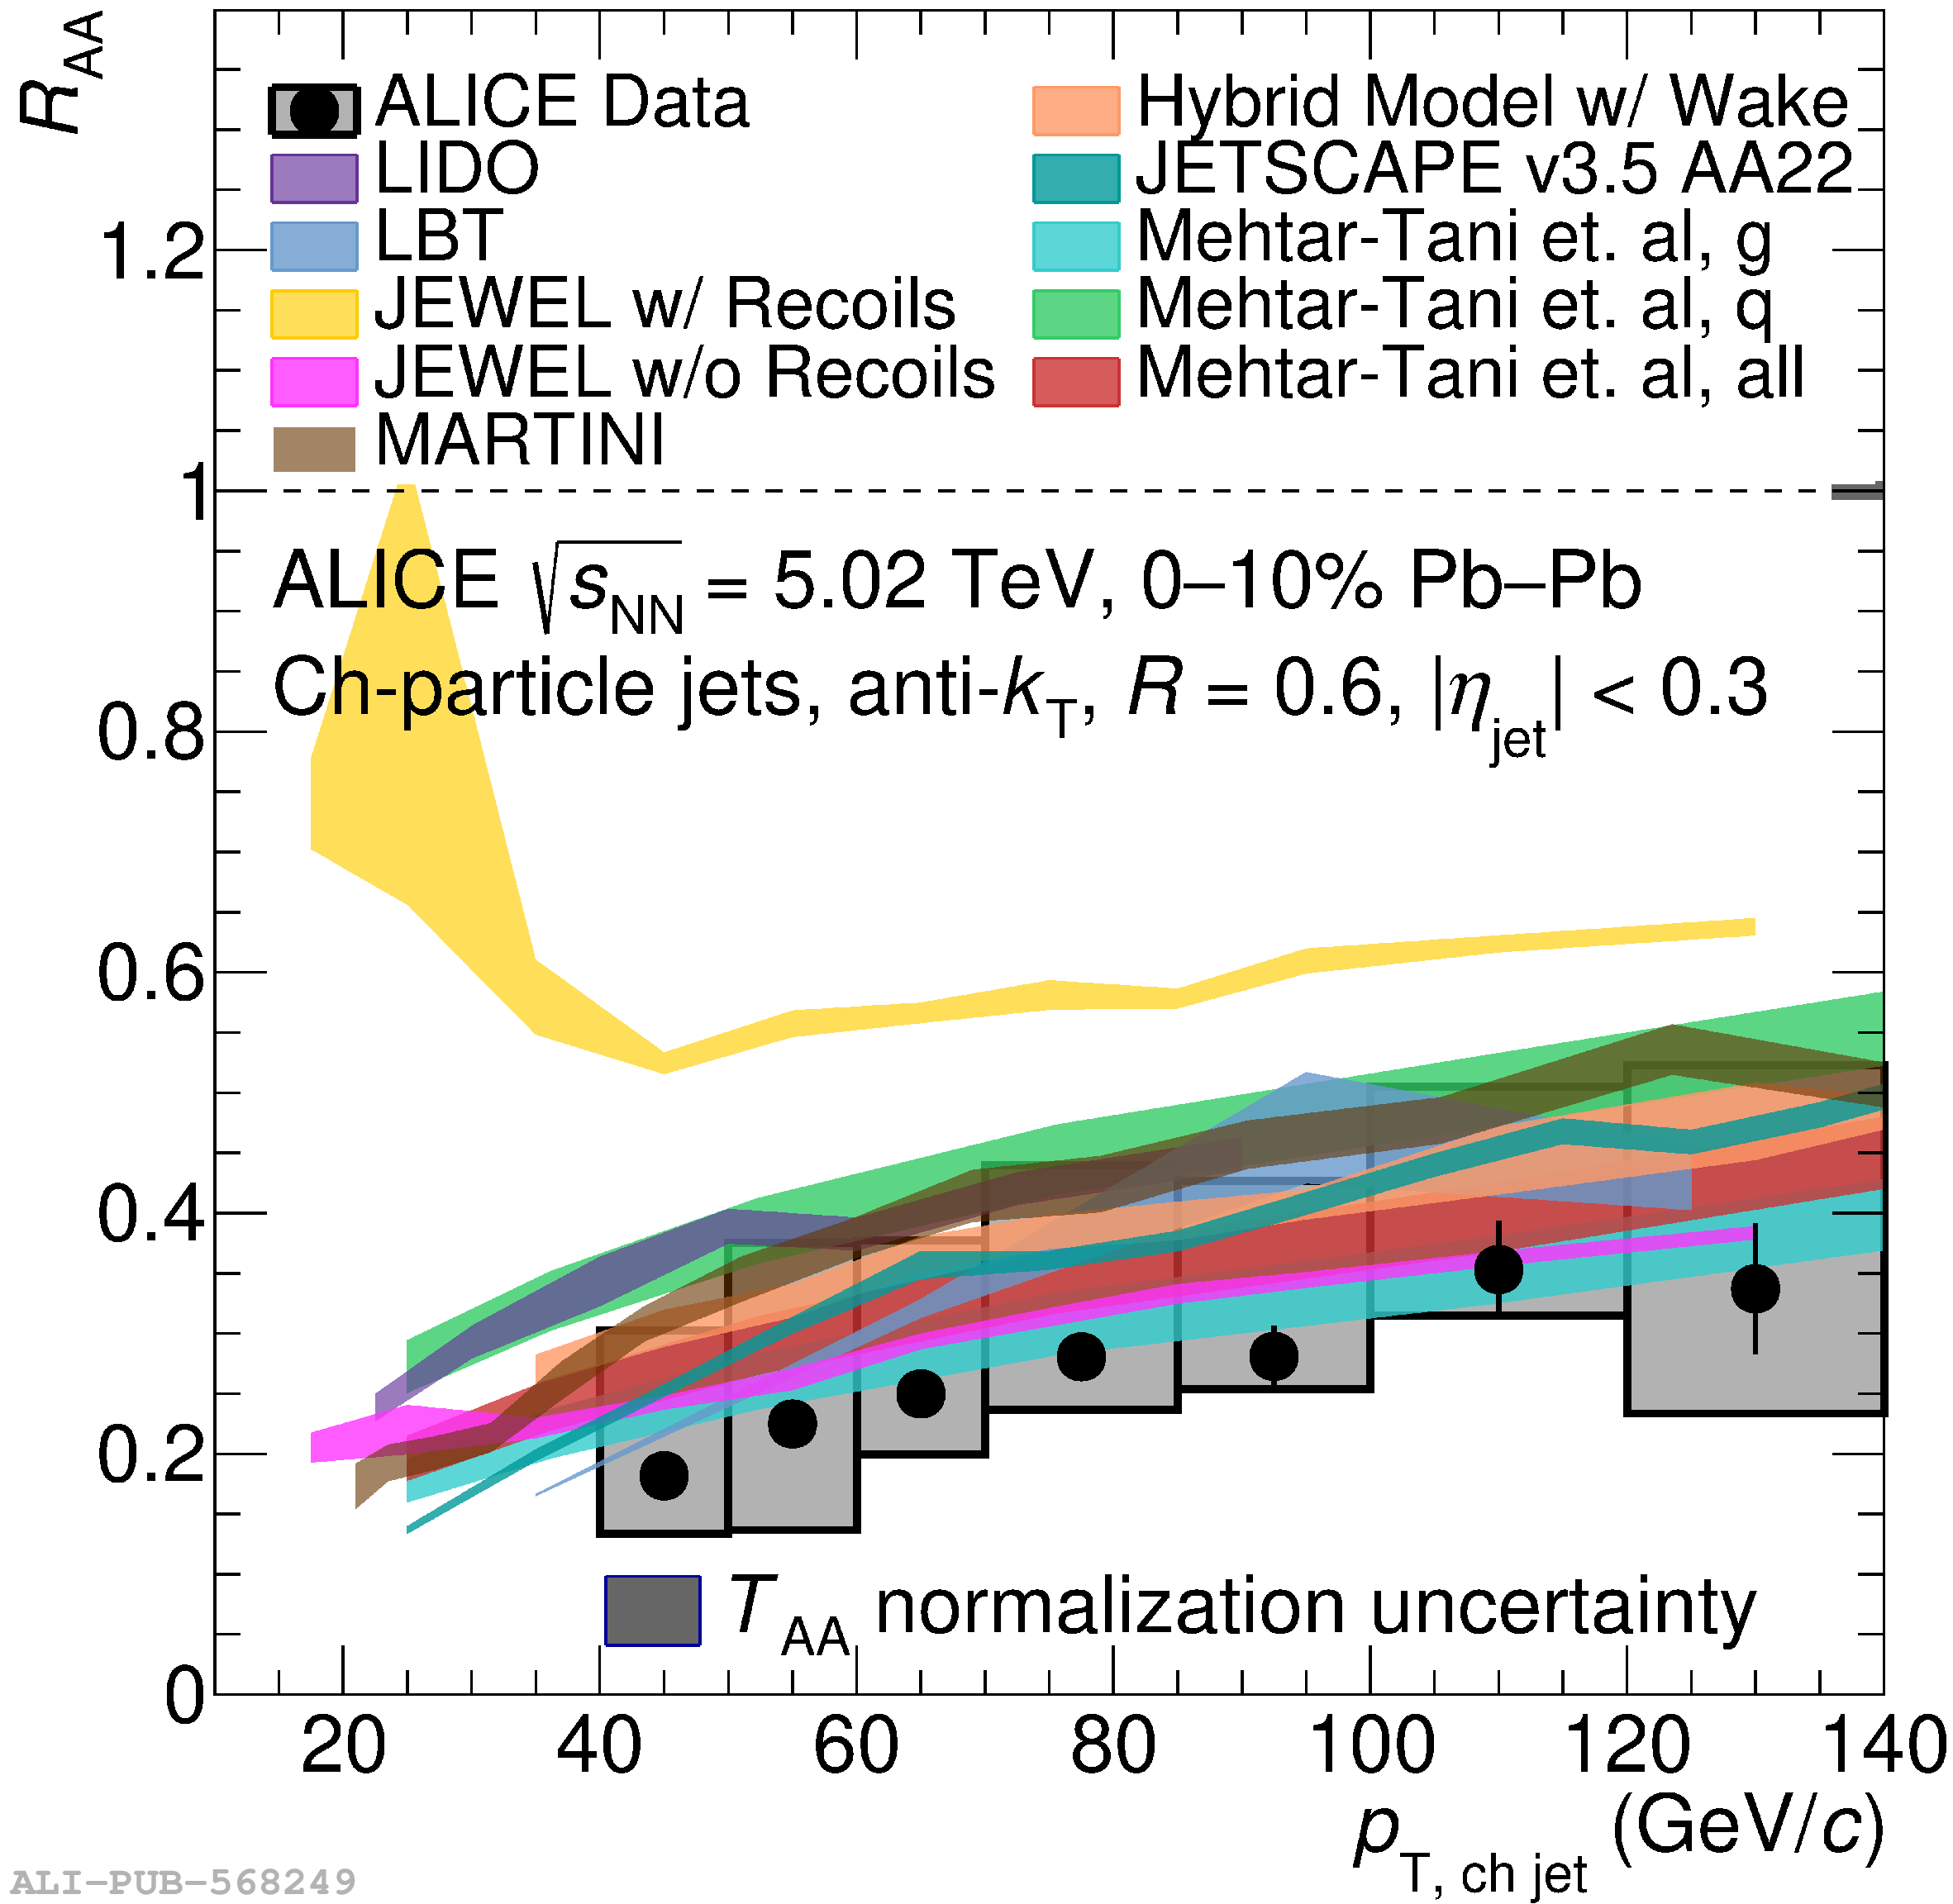 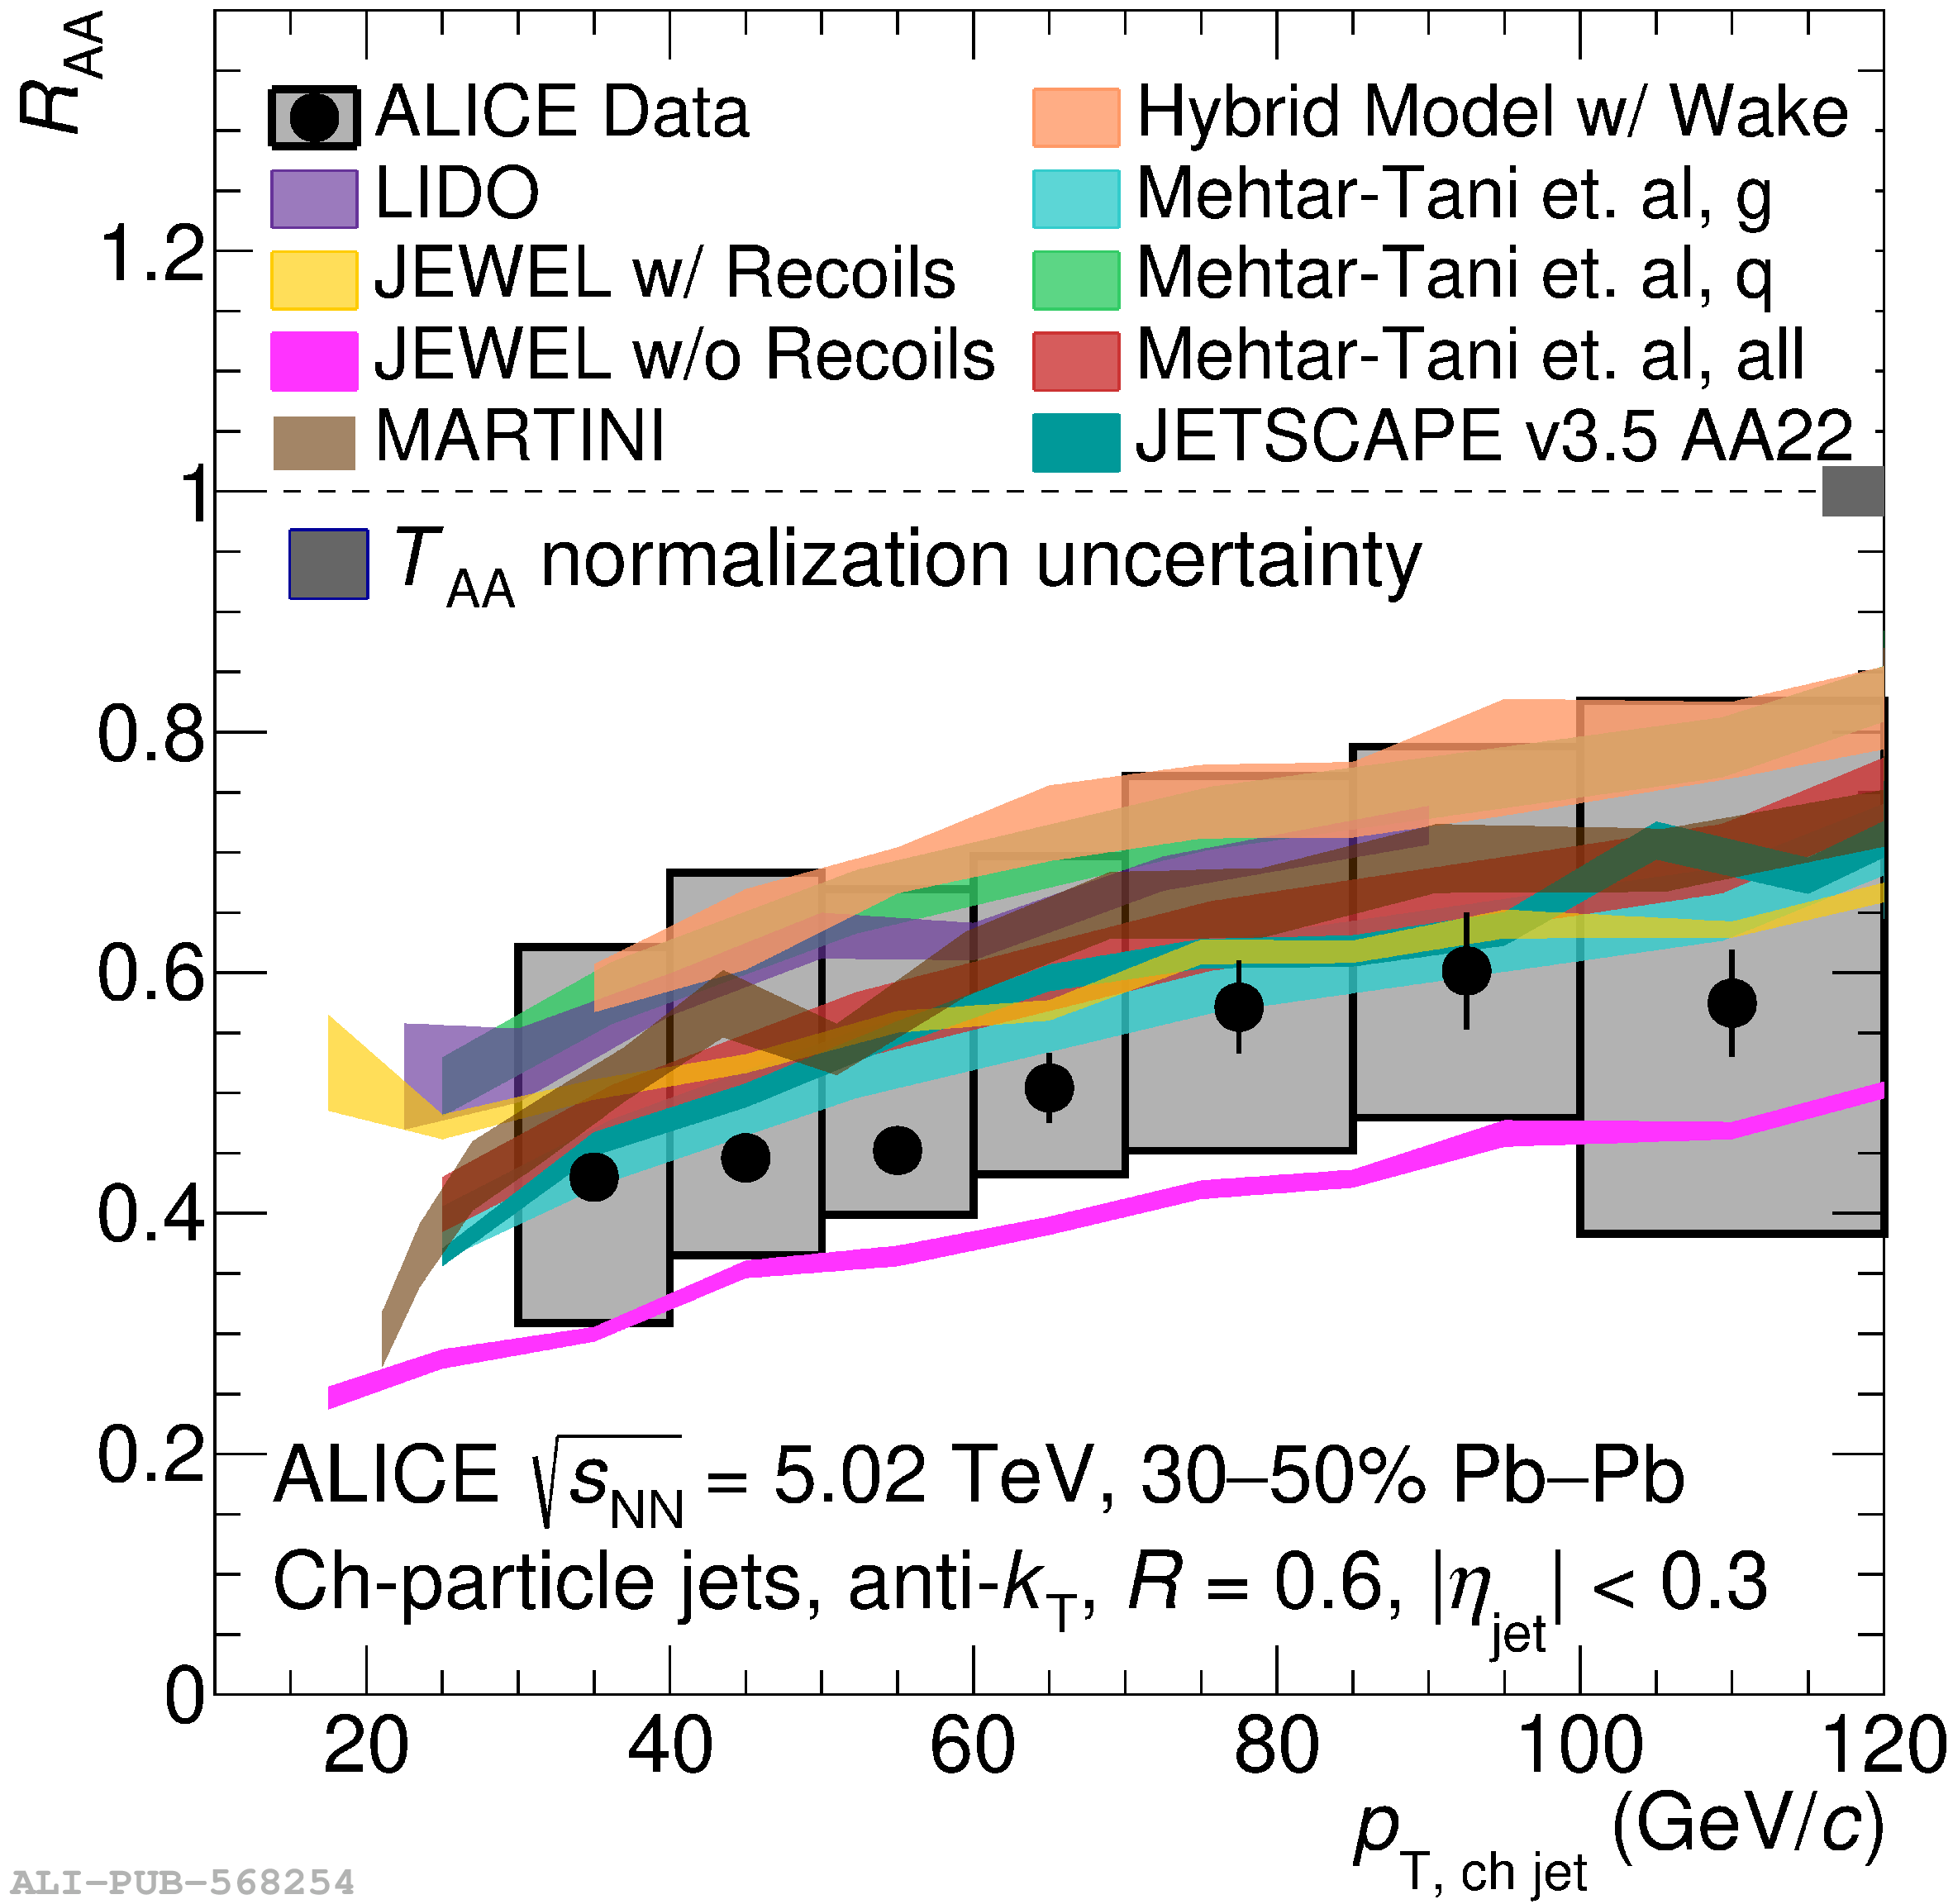 |
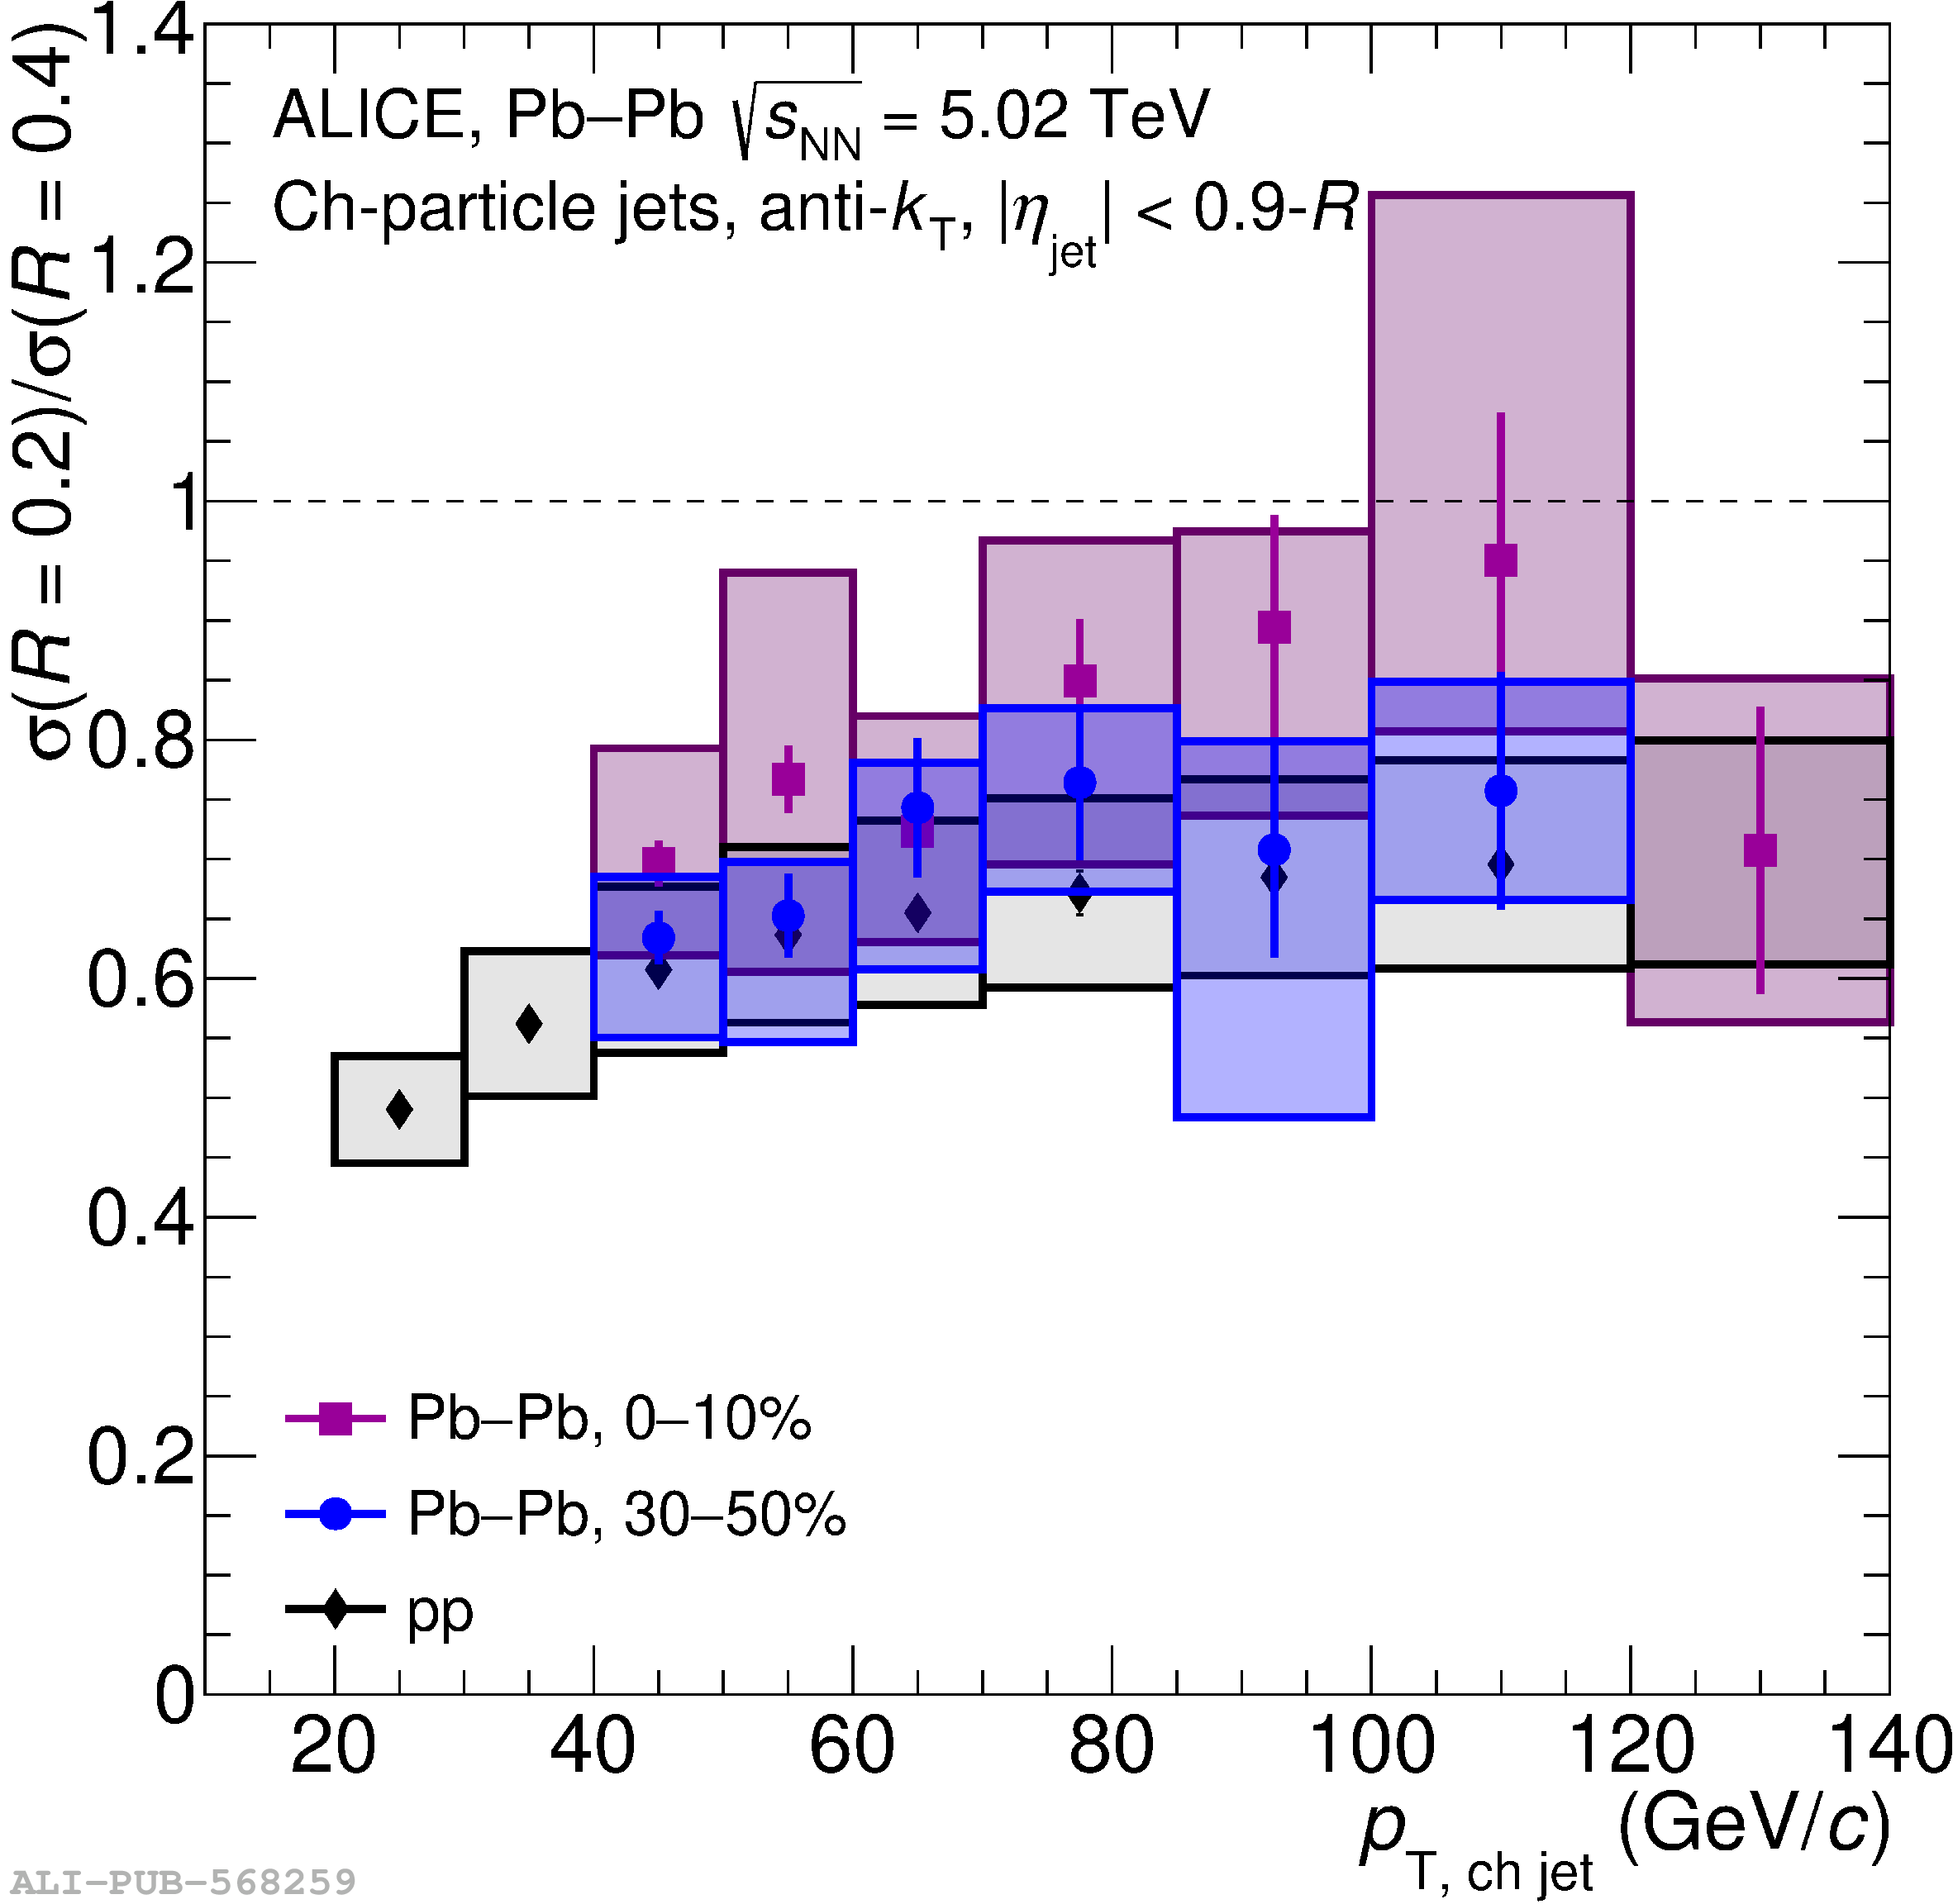
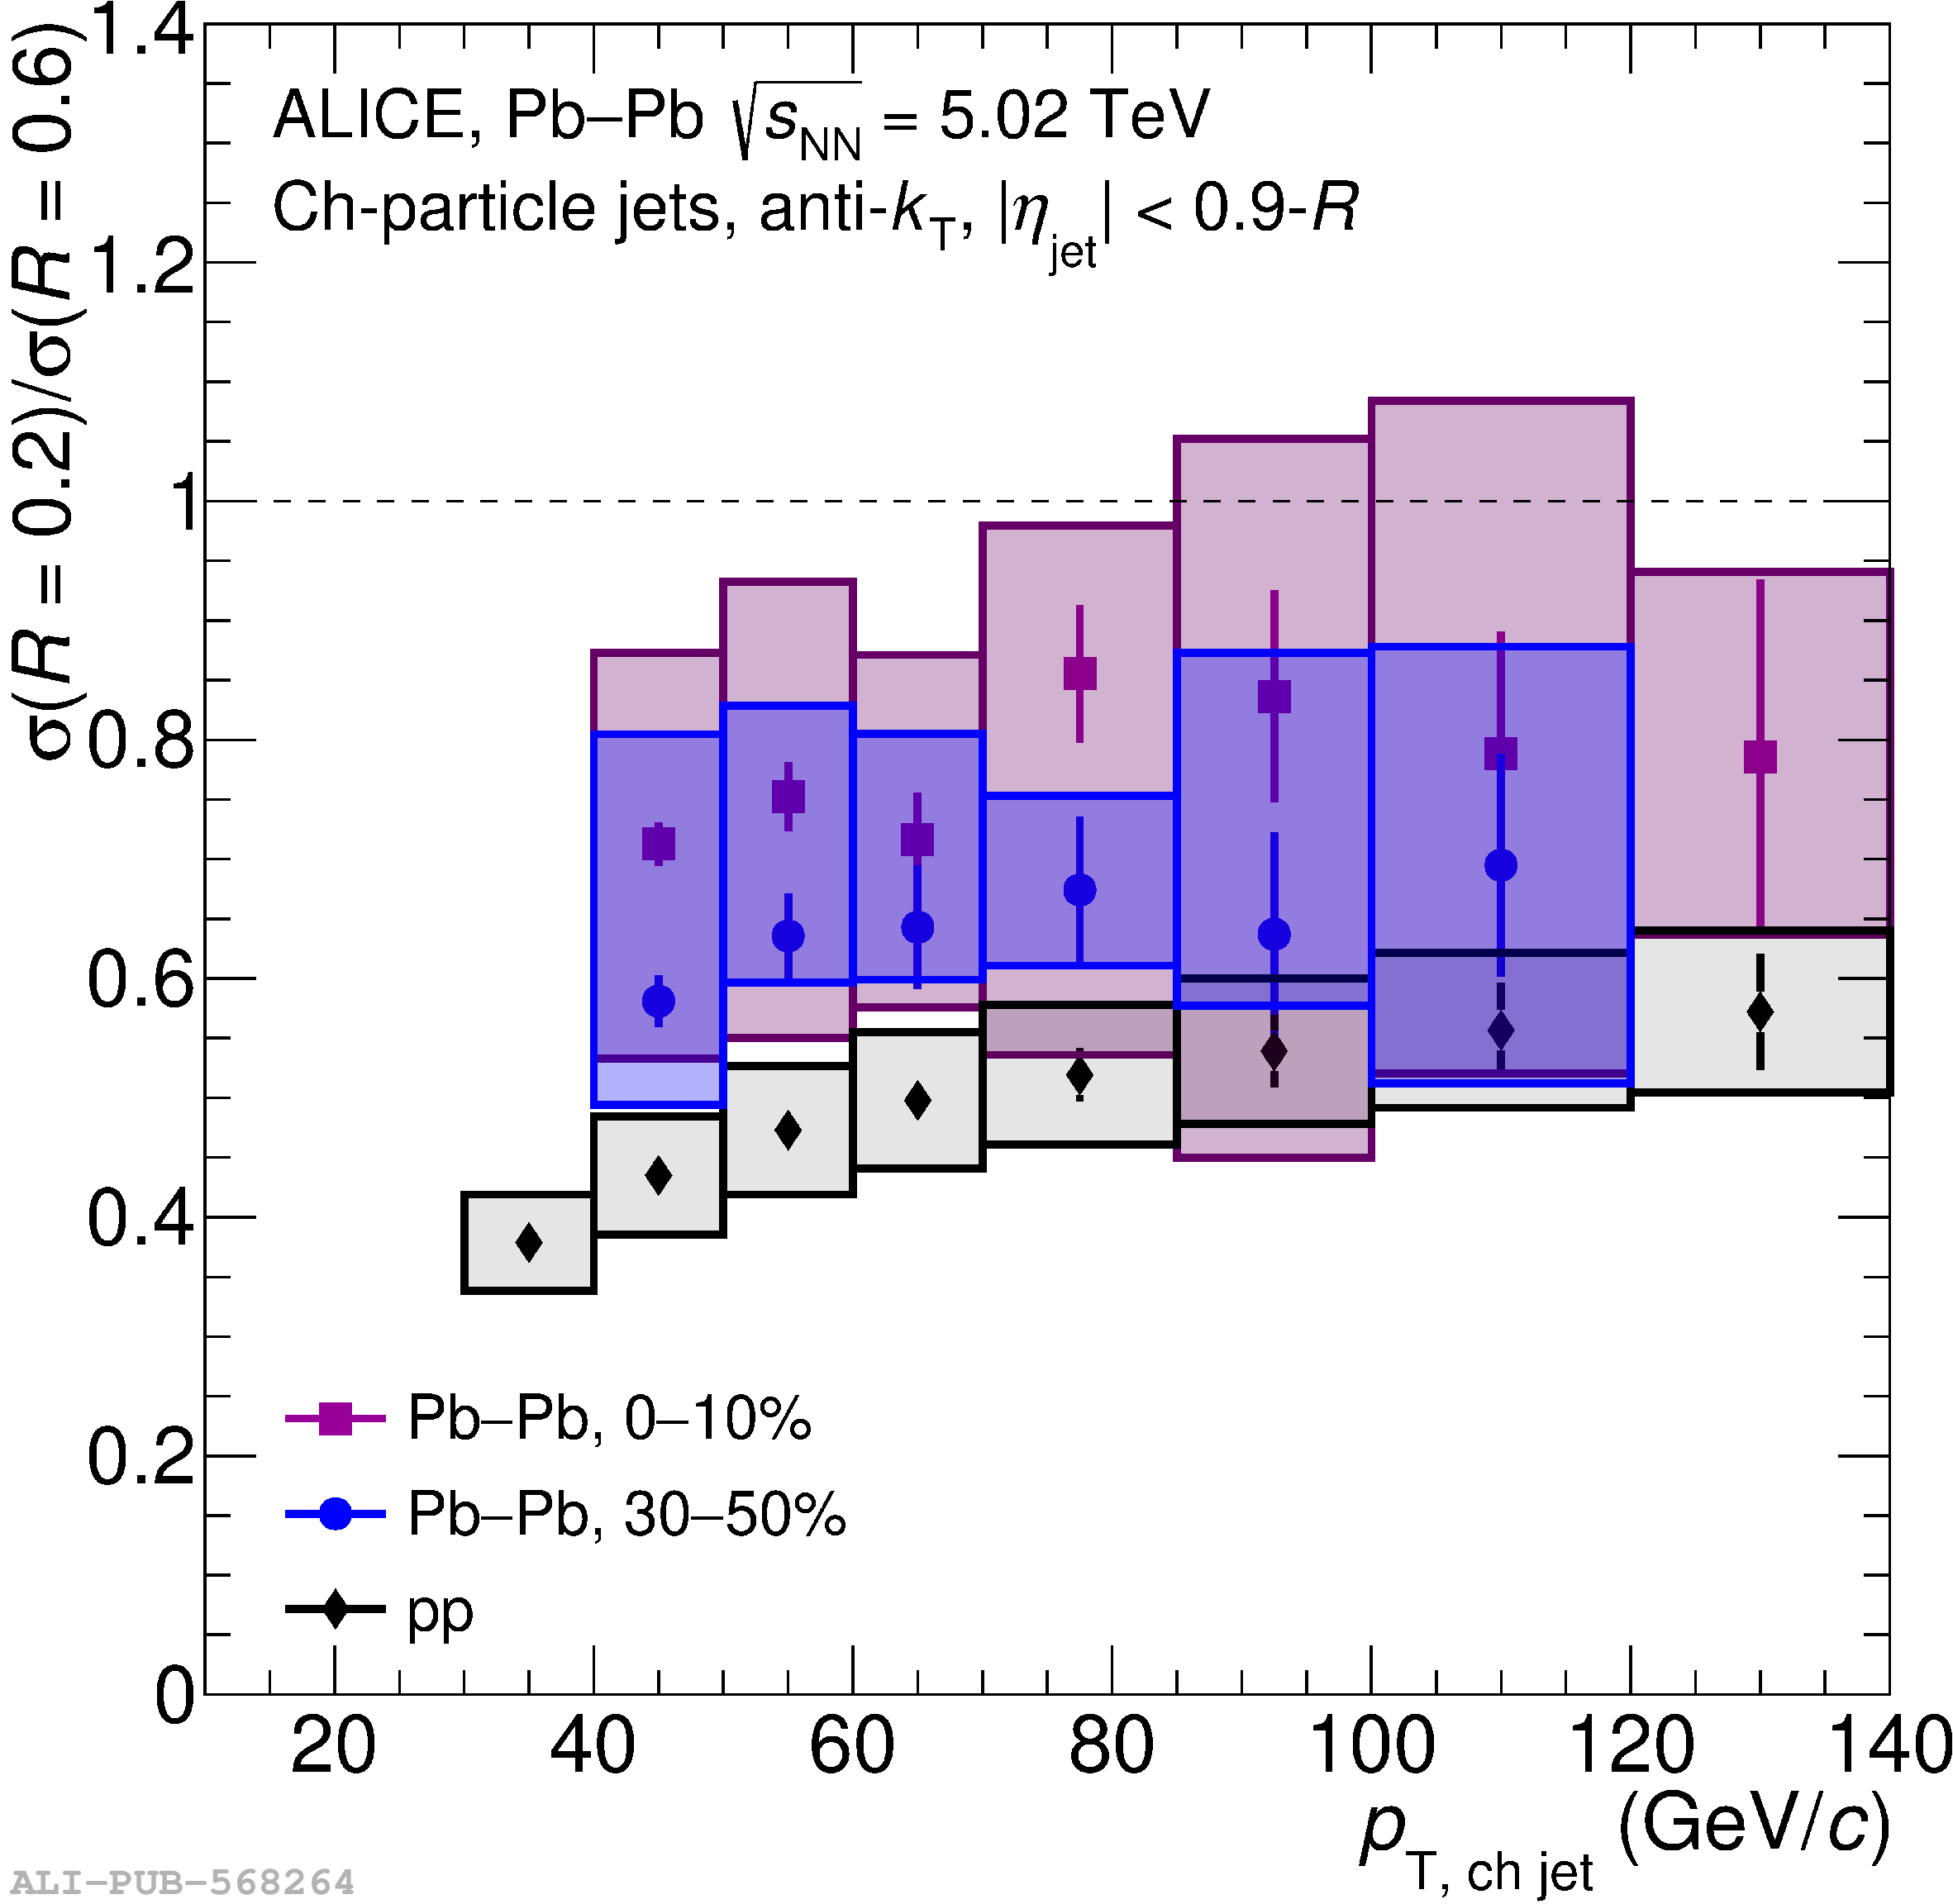
Figure 8
Double ratio of jet nuclear modification factors using $R_\mathrm{AA}^{R=0.2}$ as the denominator and using $R = 0.4$ (left) and $R = 0.6$ (right) as the numerator compared to model predictions for central (top row) and semi-central (bottom row) collisions. Note that a comparison to JEWEL with recoils was omitted from the top right plot as its prediction is out of scale. | 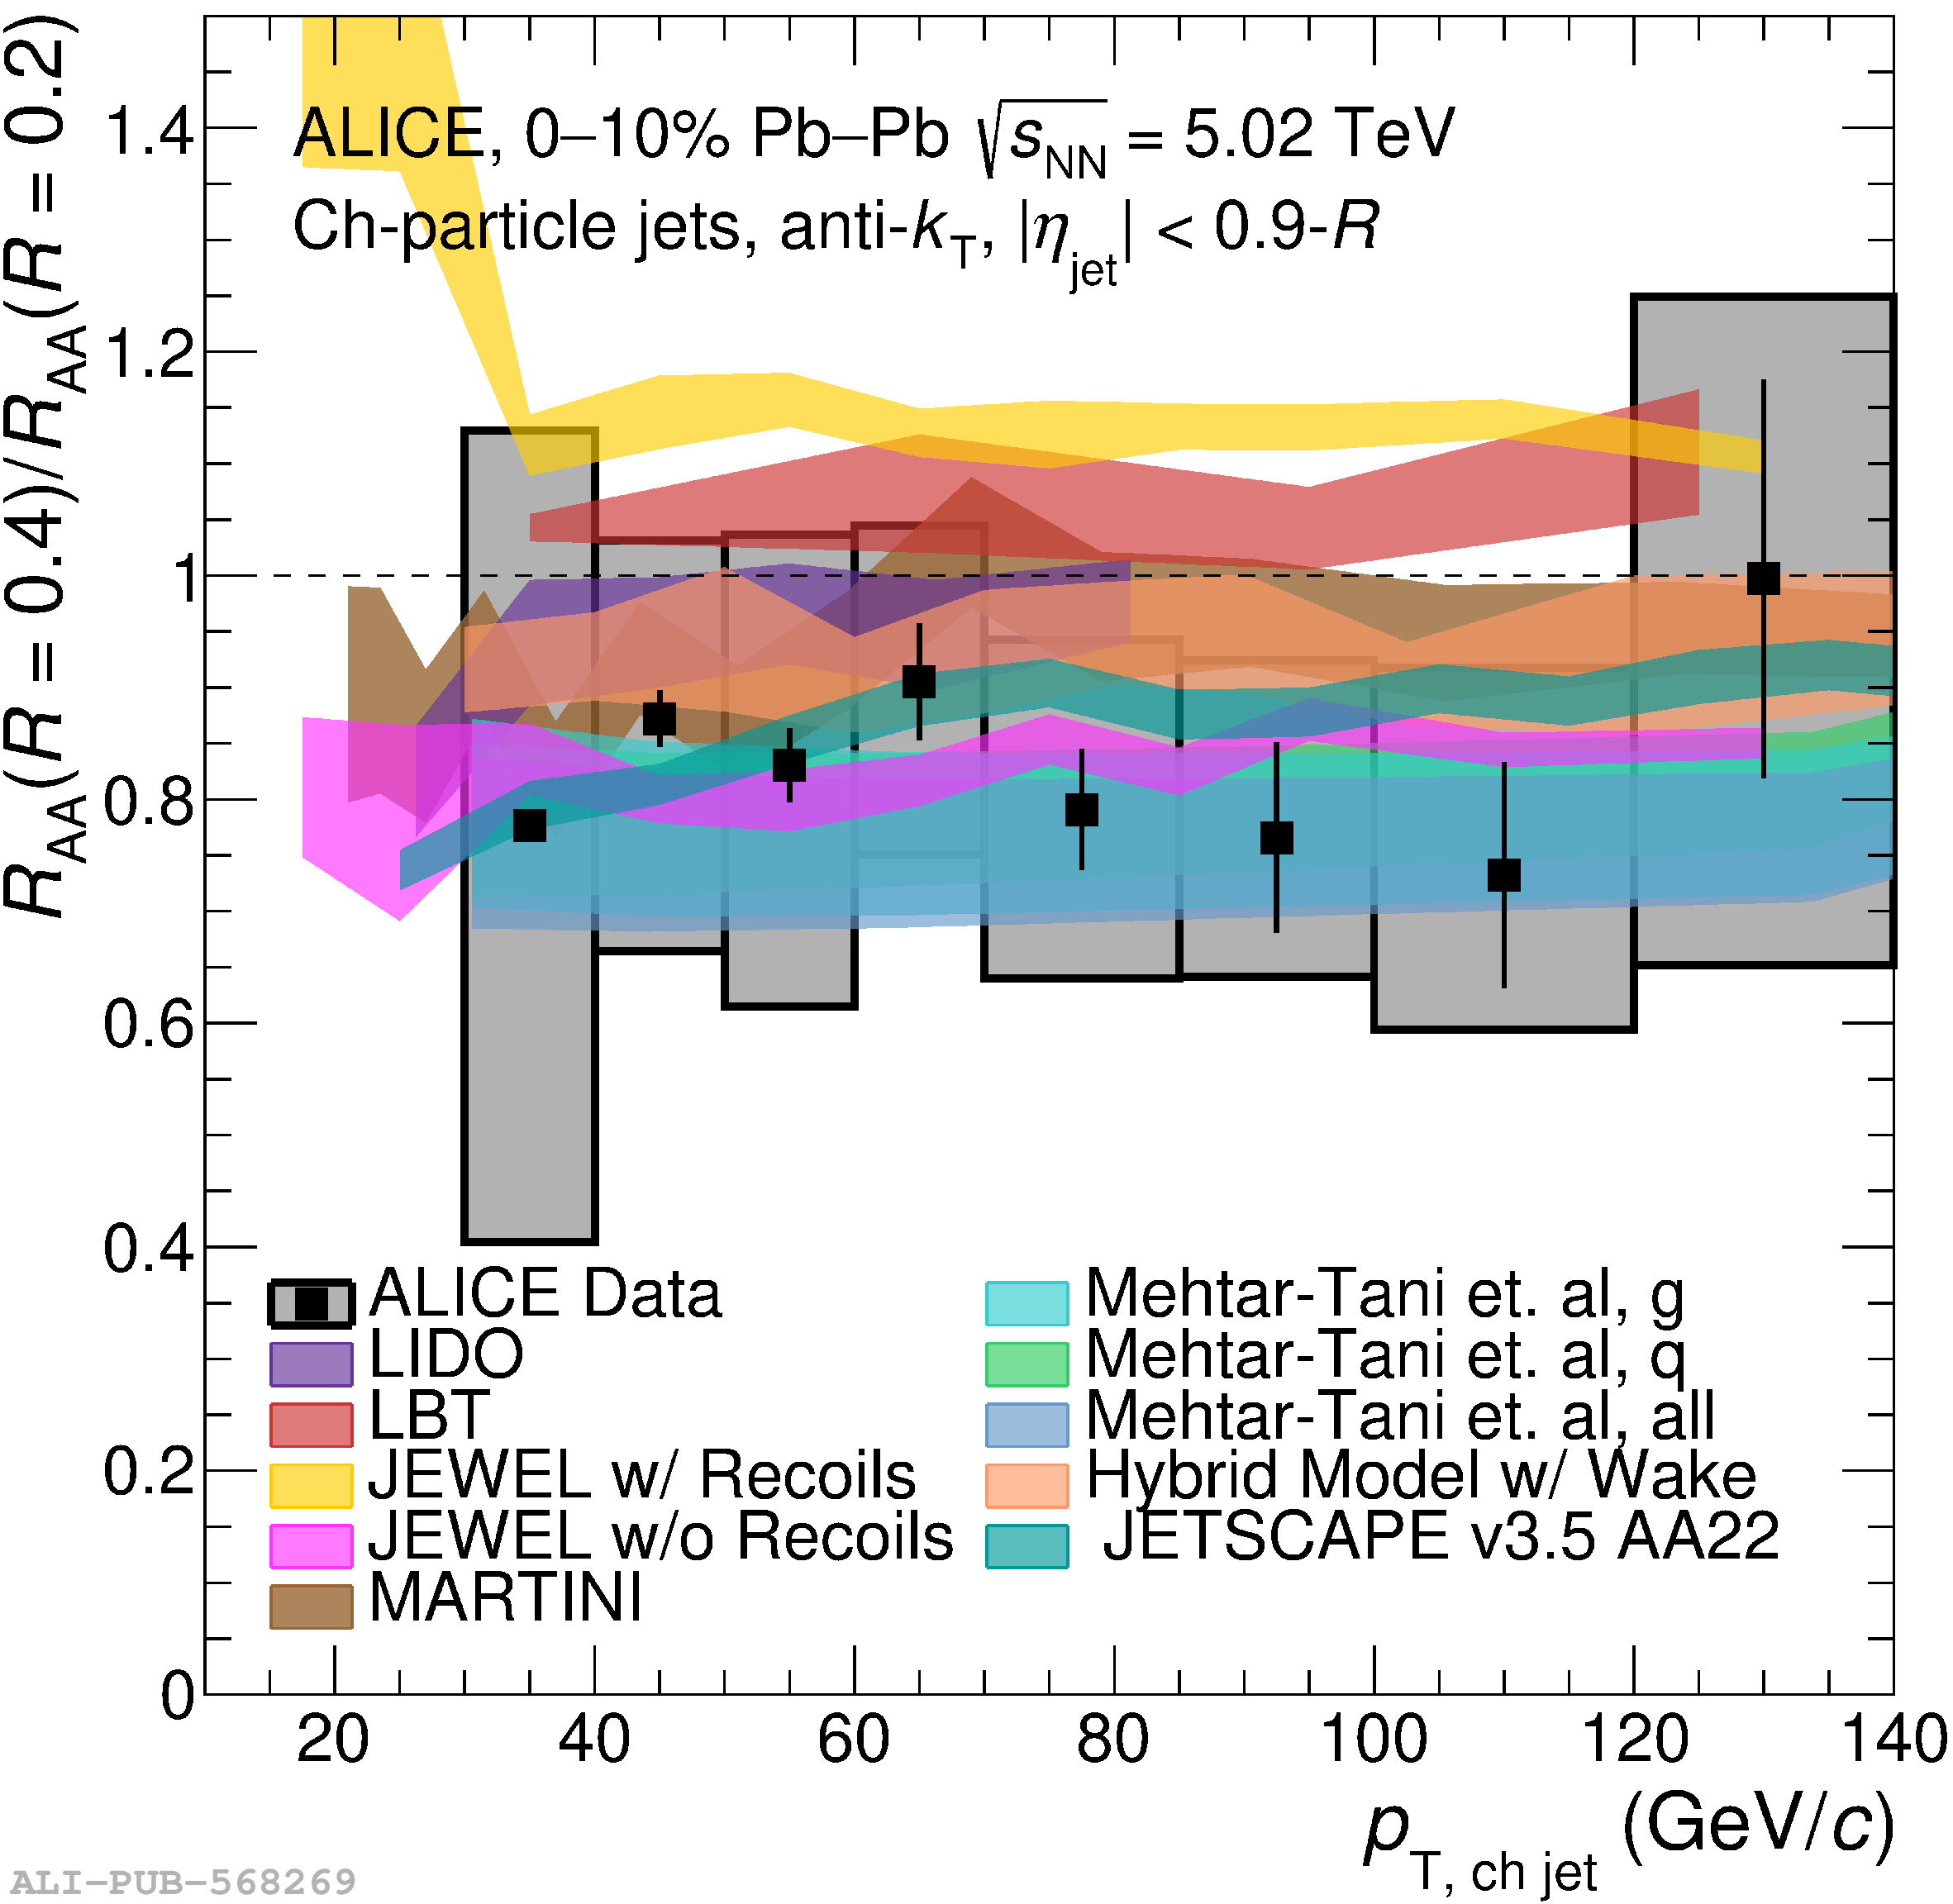  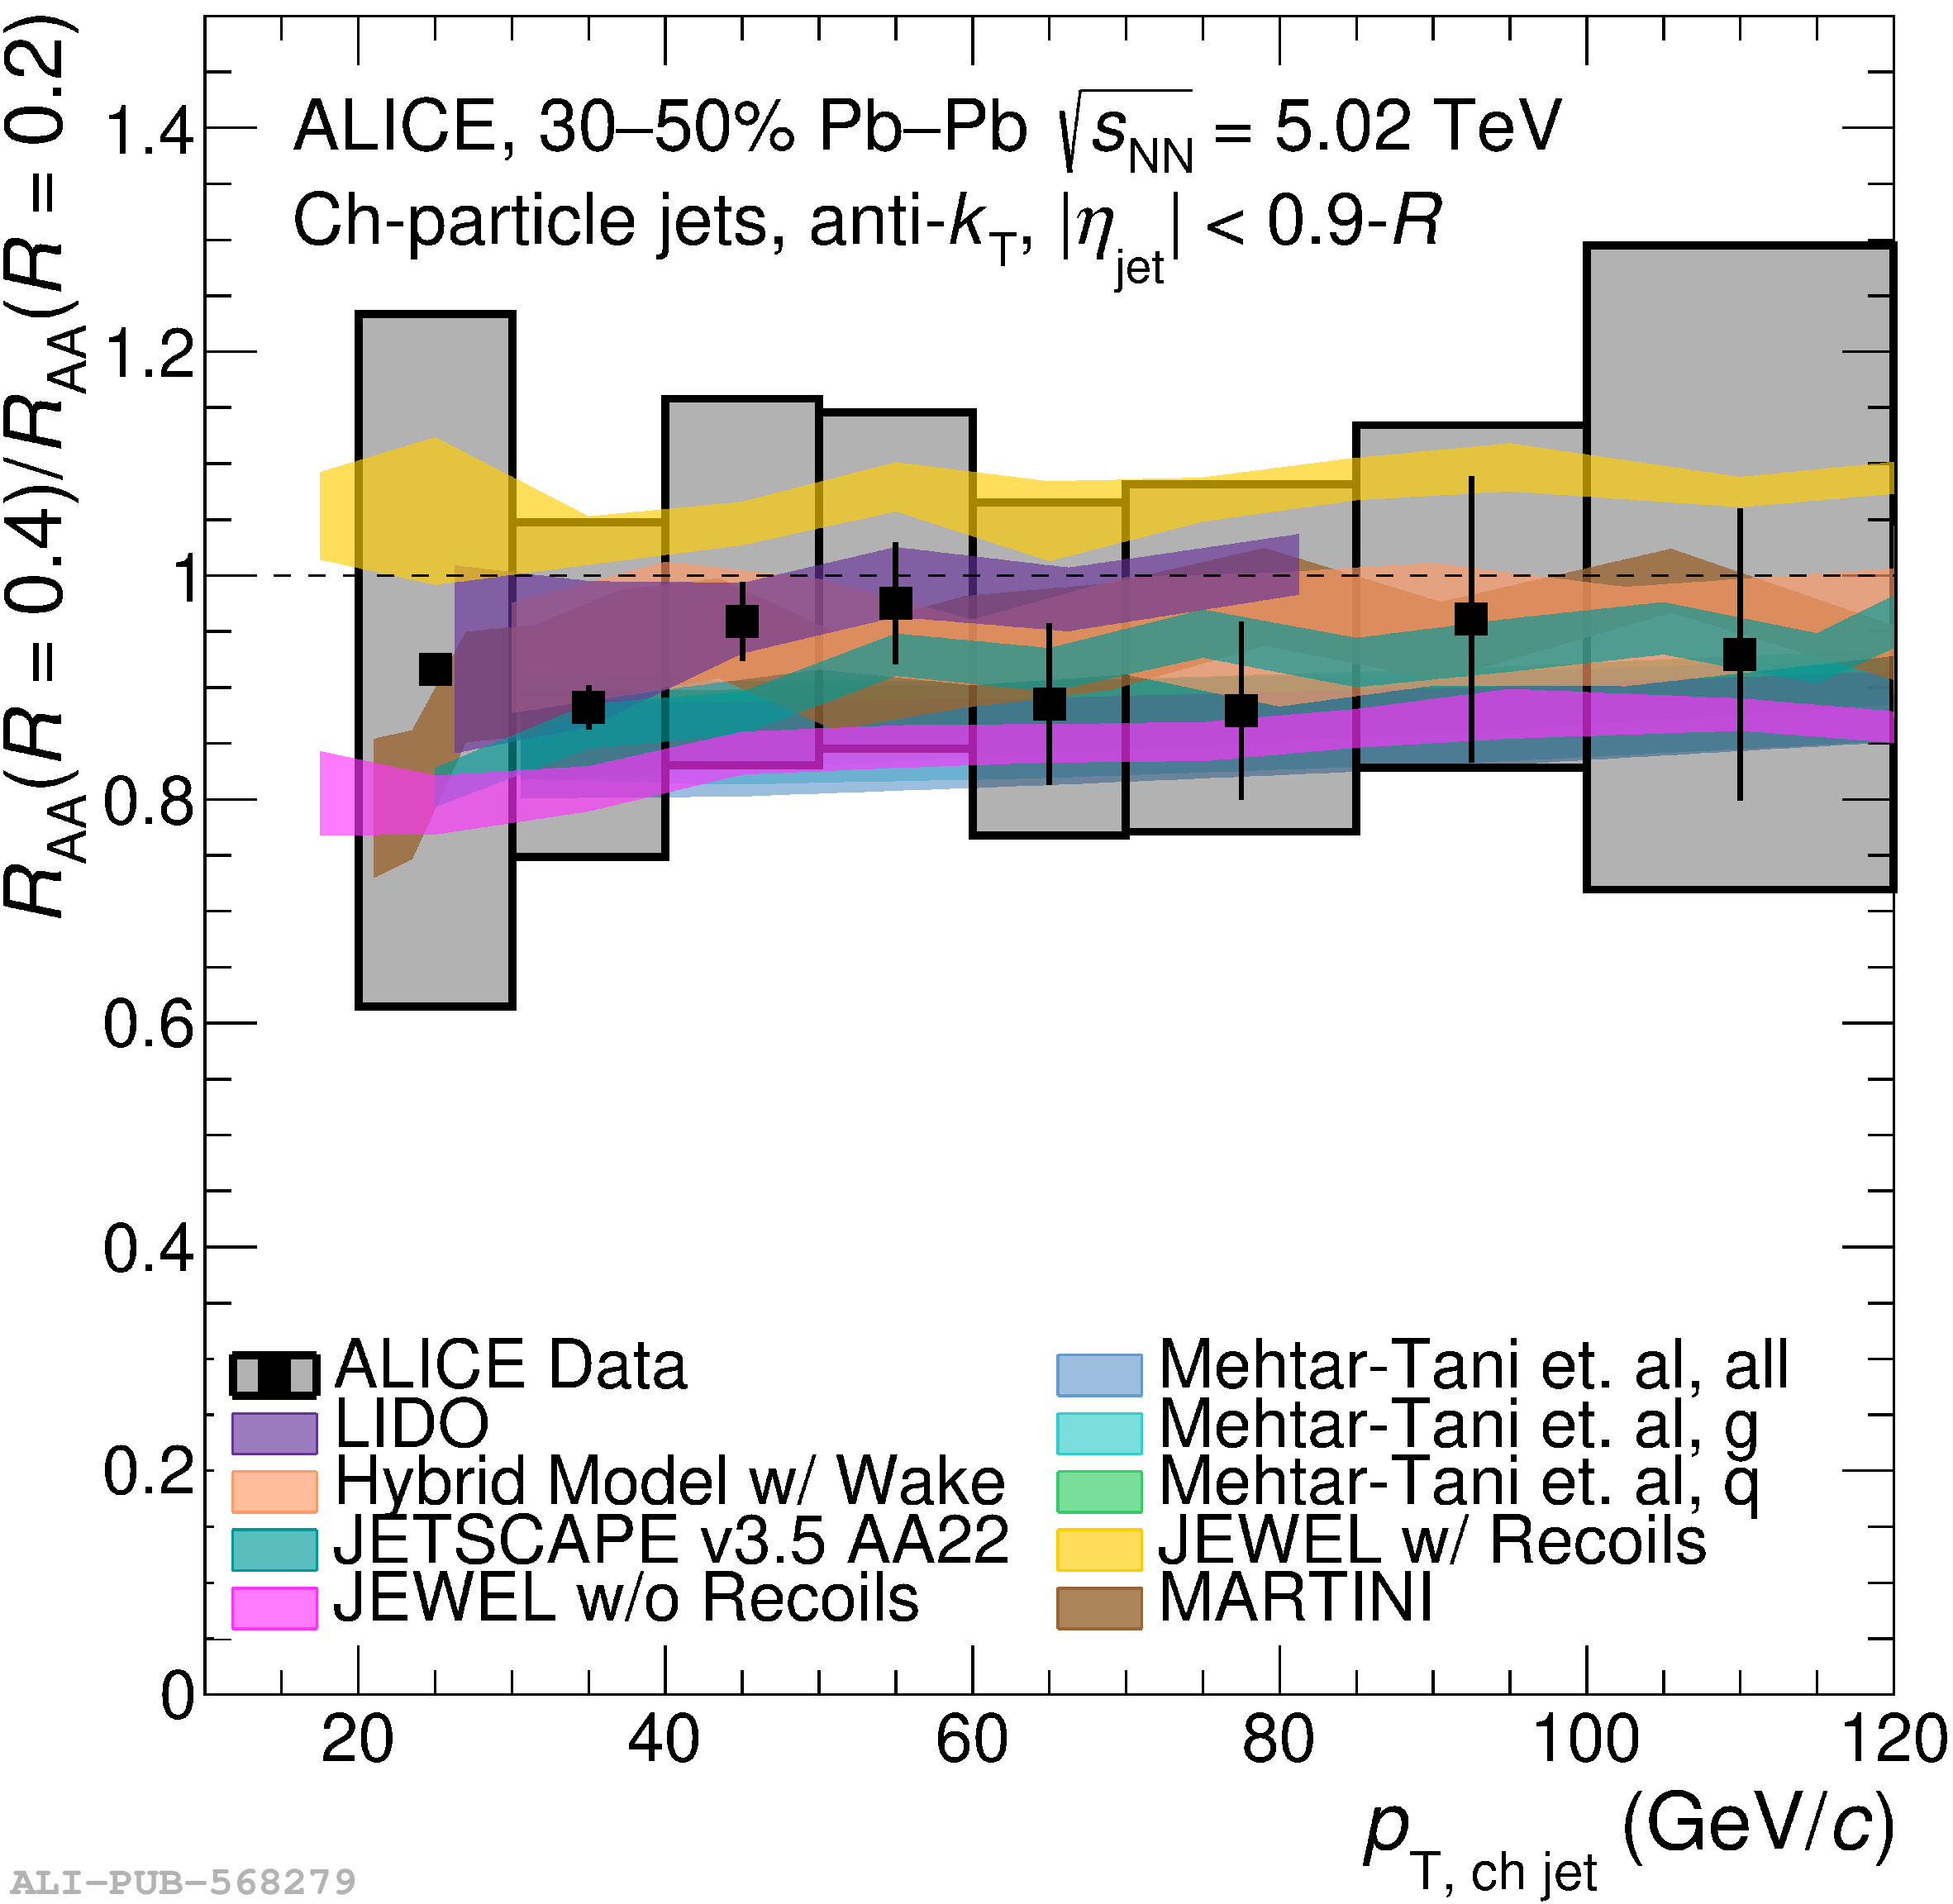  |