Deuterons are atomic nuclei composed of a neutron and a proton held together by the strong interaction. Unbound ensembles composed of a deuteron and a third nucleon have been investigated in the past using scattering experiments and they constitute a fundamental reference in nuclear physics to constrain nuclear interactions and the properties of nuclei. In this work, K$^{+}-$d and p$-$d femtoscopic correlations measured by the ALICE Collaboration in proton$-$proton (pp) collisions at $\sqrt{s}=13$ TeV at the Large Hadron Collider (LHC) are presented. It is demonstrated that correlations in momentum space between deuterons and kaons or protons allow us to study three-hadron systems at distances comparable with the proton radius. The analysis of the K$^{+}-$d correlation shows that the relative distances at which deuterons and protons or kaons are produced are around 2 fm. The analysis of the p$-$d correlation shows that only a full three-body calculation that accounts for the internal structure of the deuteron can explain the data. In particular, the sensitivity of the observable to the short-range part of the interaction is demonstrated. These results indicate that correlations involving light nuclei in pp collisions at the LHC will also provide access to any three-body systems in the strange and charm sectors.
Phys. Rev. X 14, 031051 (2024)
HEP Data
e-Print: arXiv:2308.16120 | PDF | inSPIRE
CERN-EP-2023-181
Figure group
Figure 1
Measured K$^+$$-$d (left) and p$-$d (right) correlation functions. The data are shown by the black symbols, the bars and the colored boxes represent the statistical and systematic uncertainties, respectively. The square brackets show the bin width of the measurement, while the horizontal black lines represent the statistical uncertainty in the determination of the mean $k^*$ for each bin. Data are compared with theoretical correlation functions, shown by colored bands, obtained using the LL approximation. The bandwidths represent the uncertainties in the determination of the radius and the residual contributions. See text for details. | 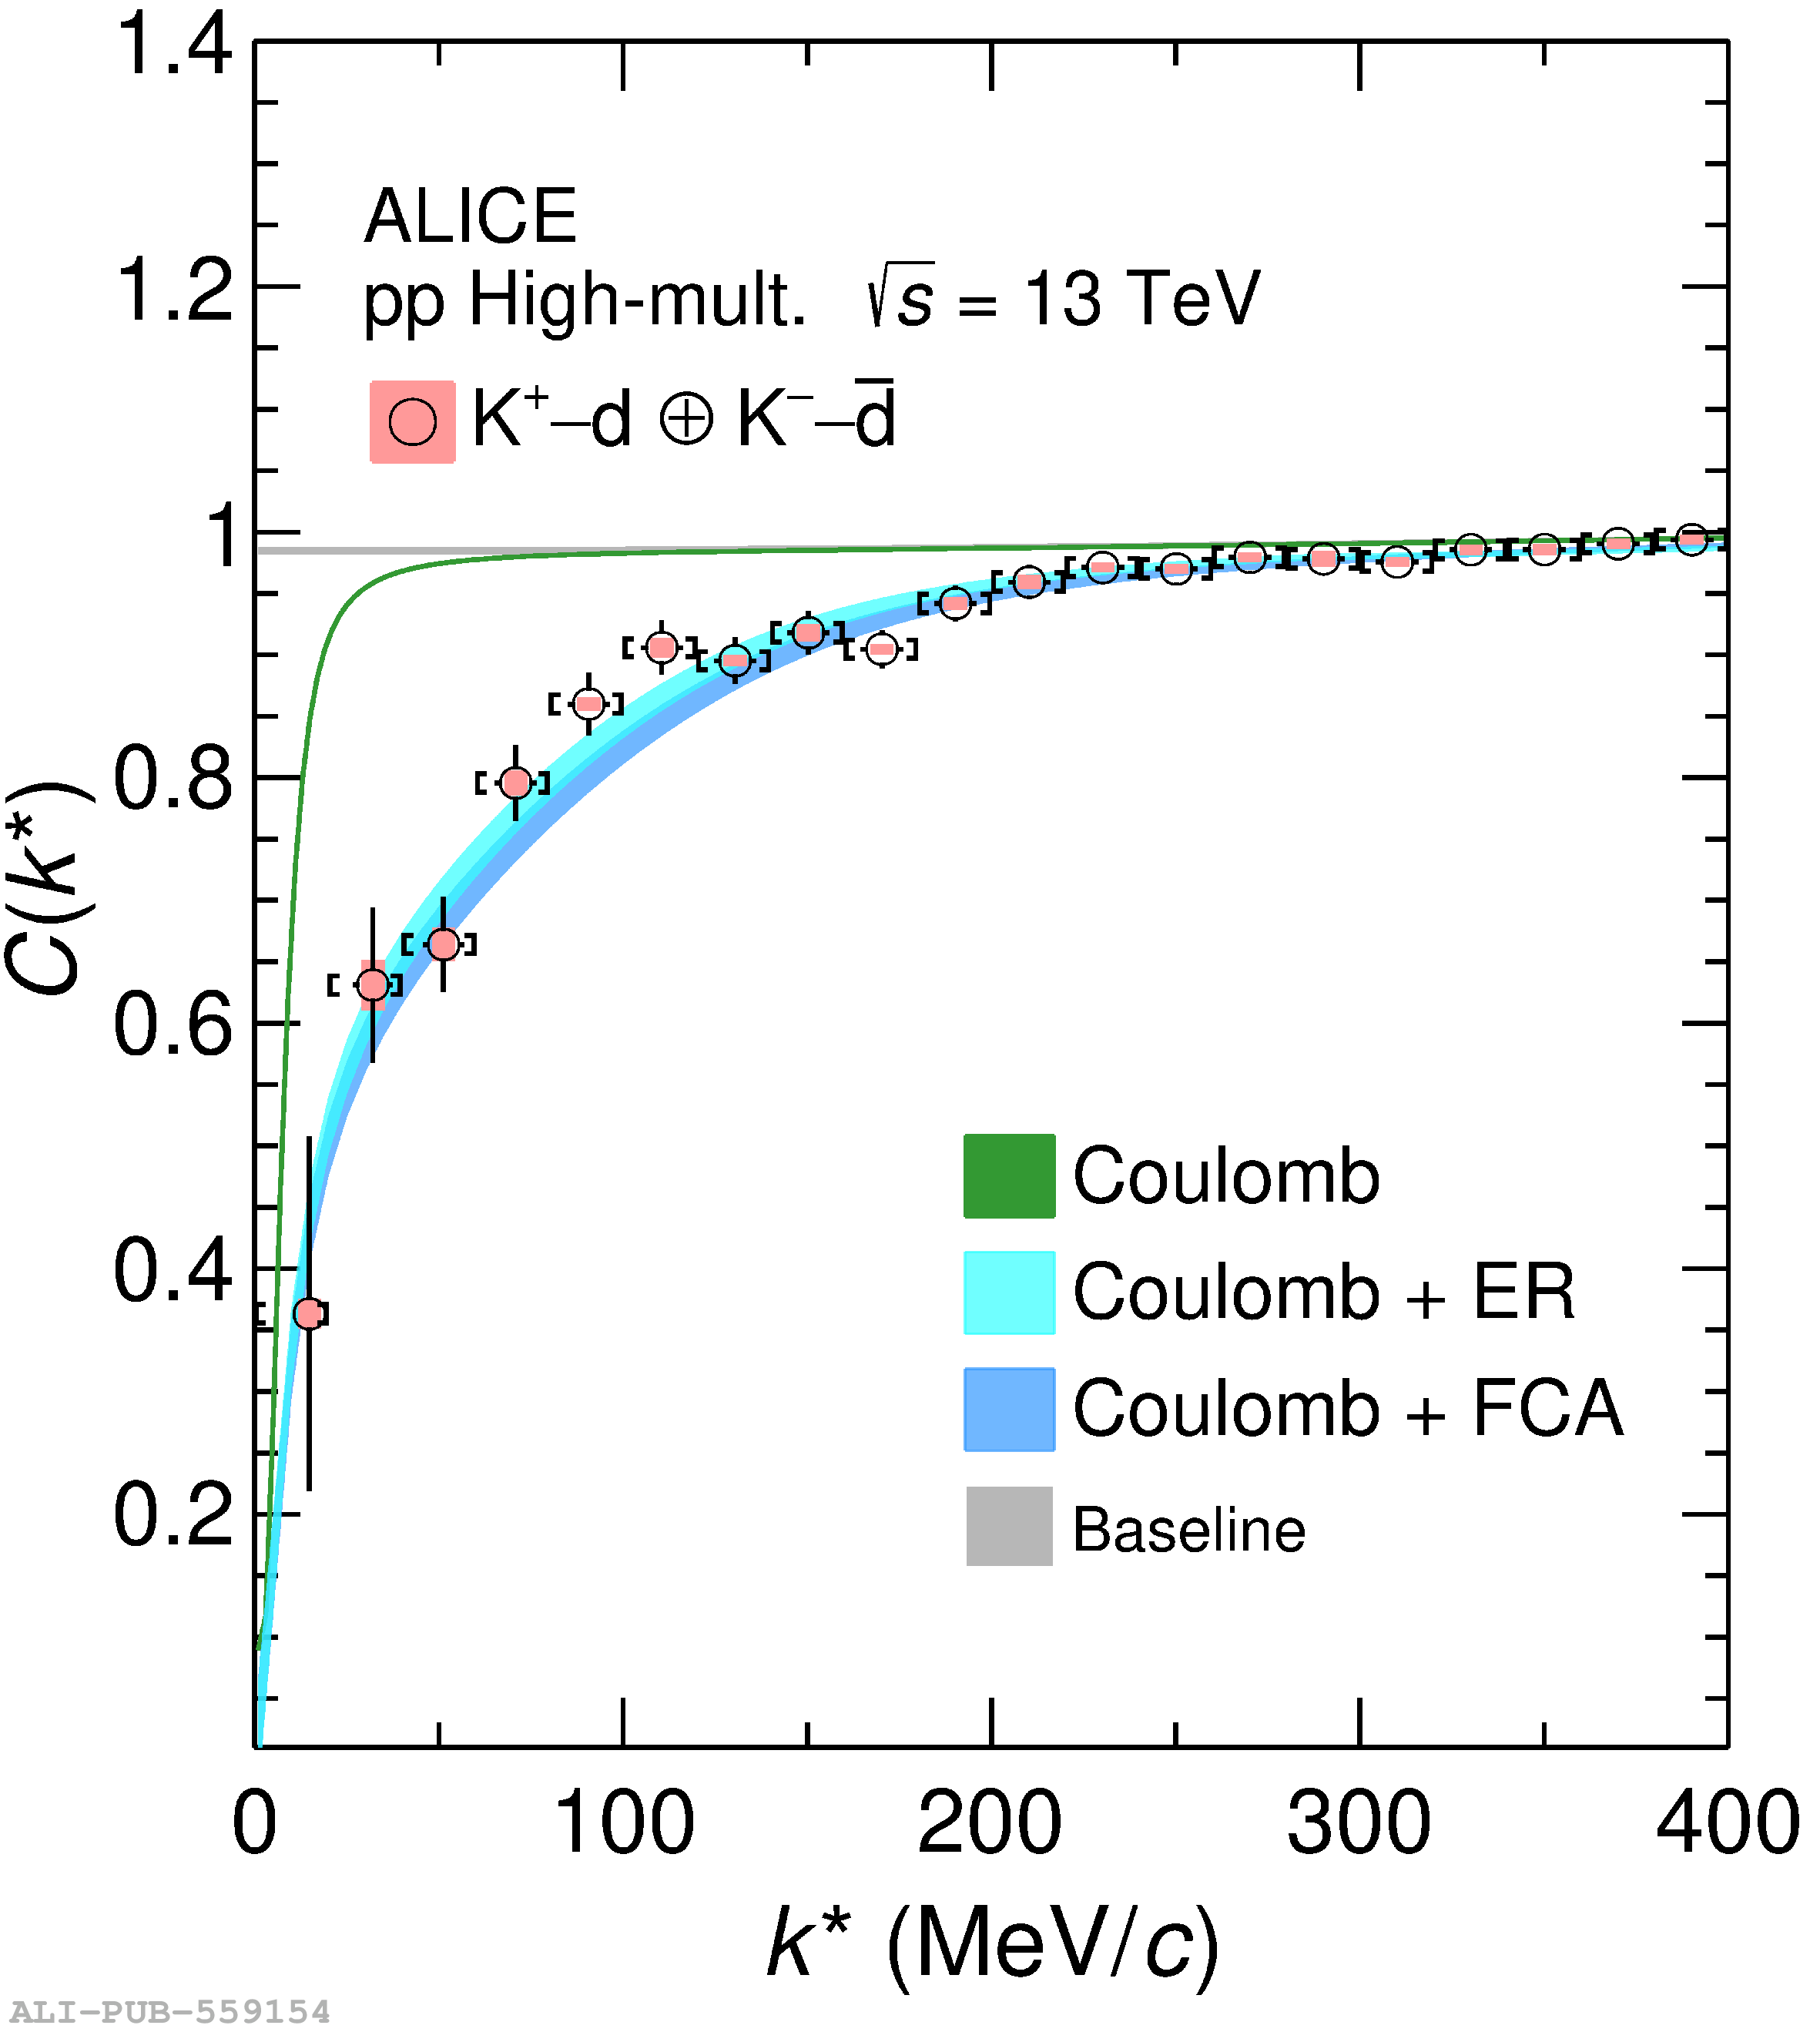  |
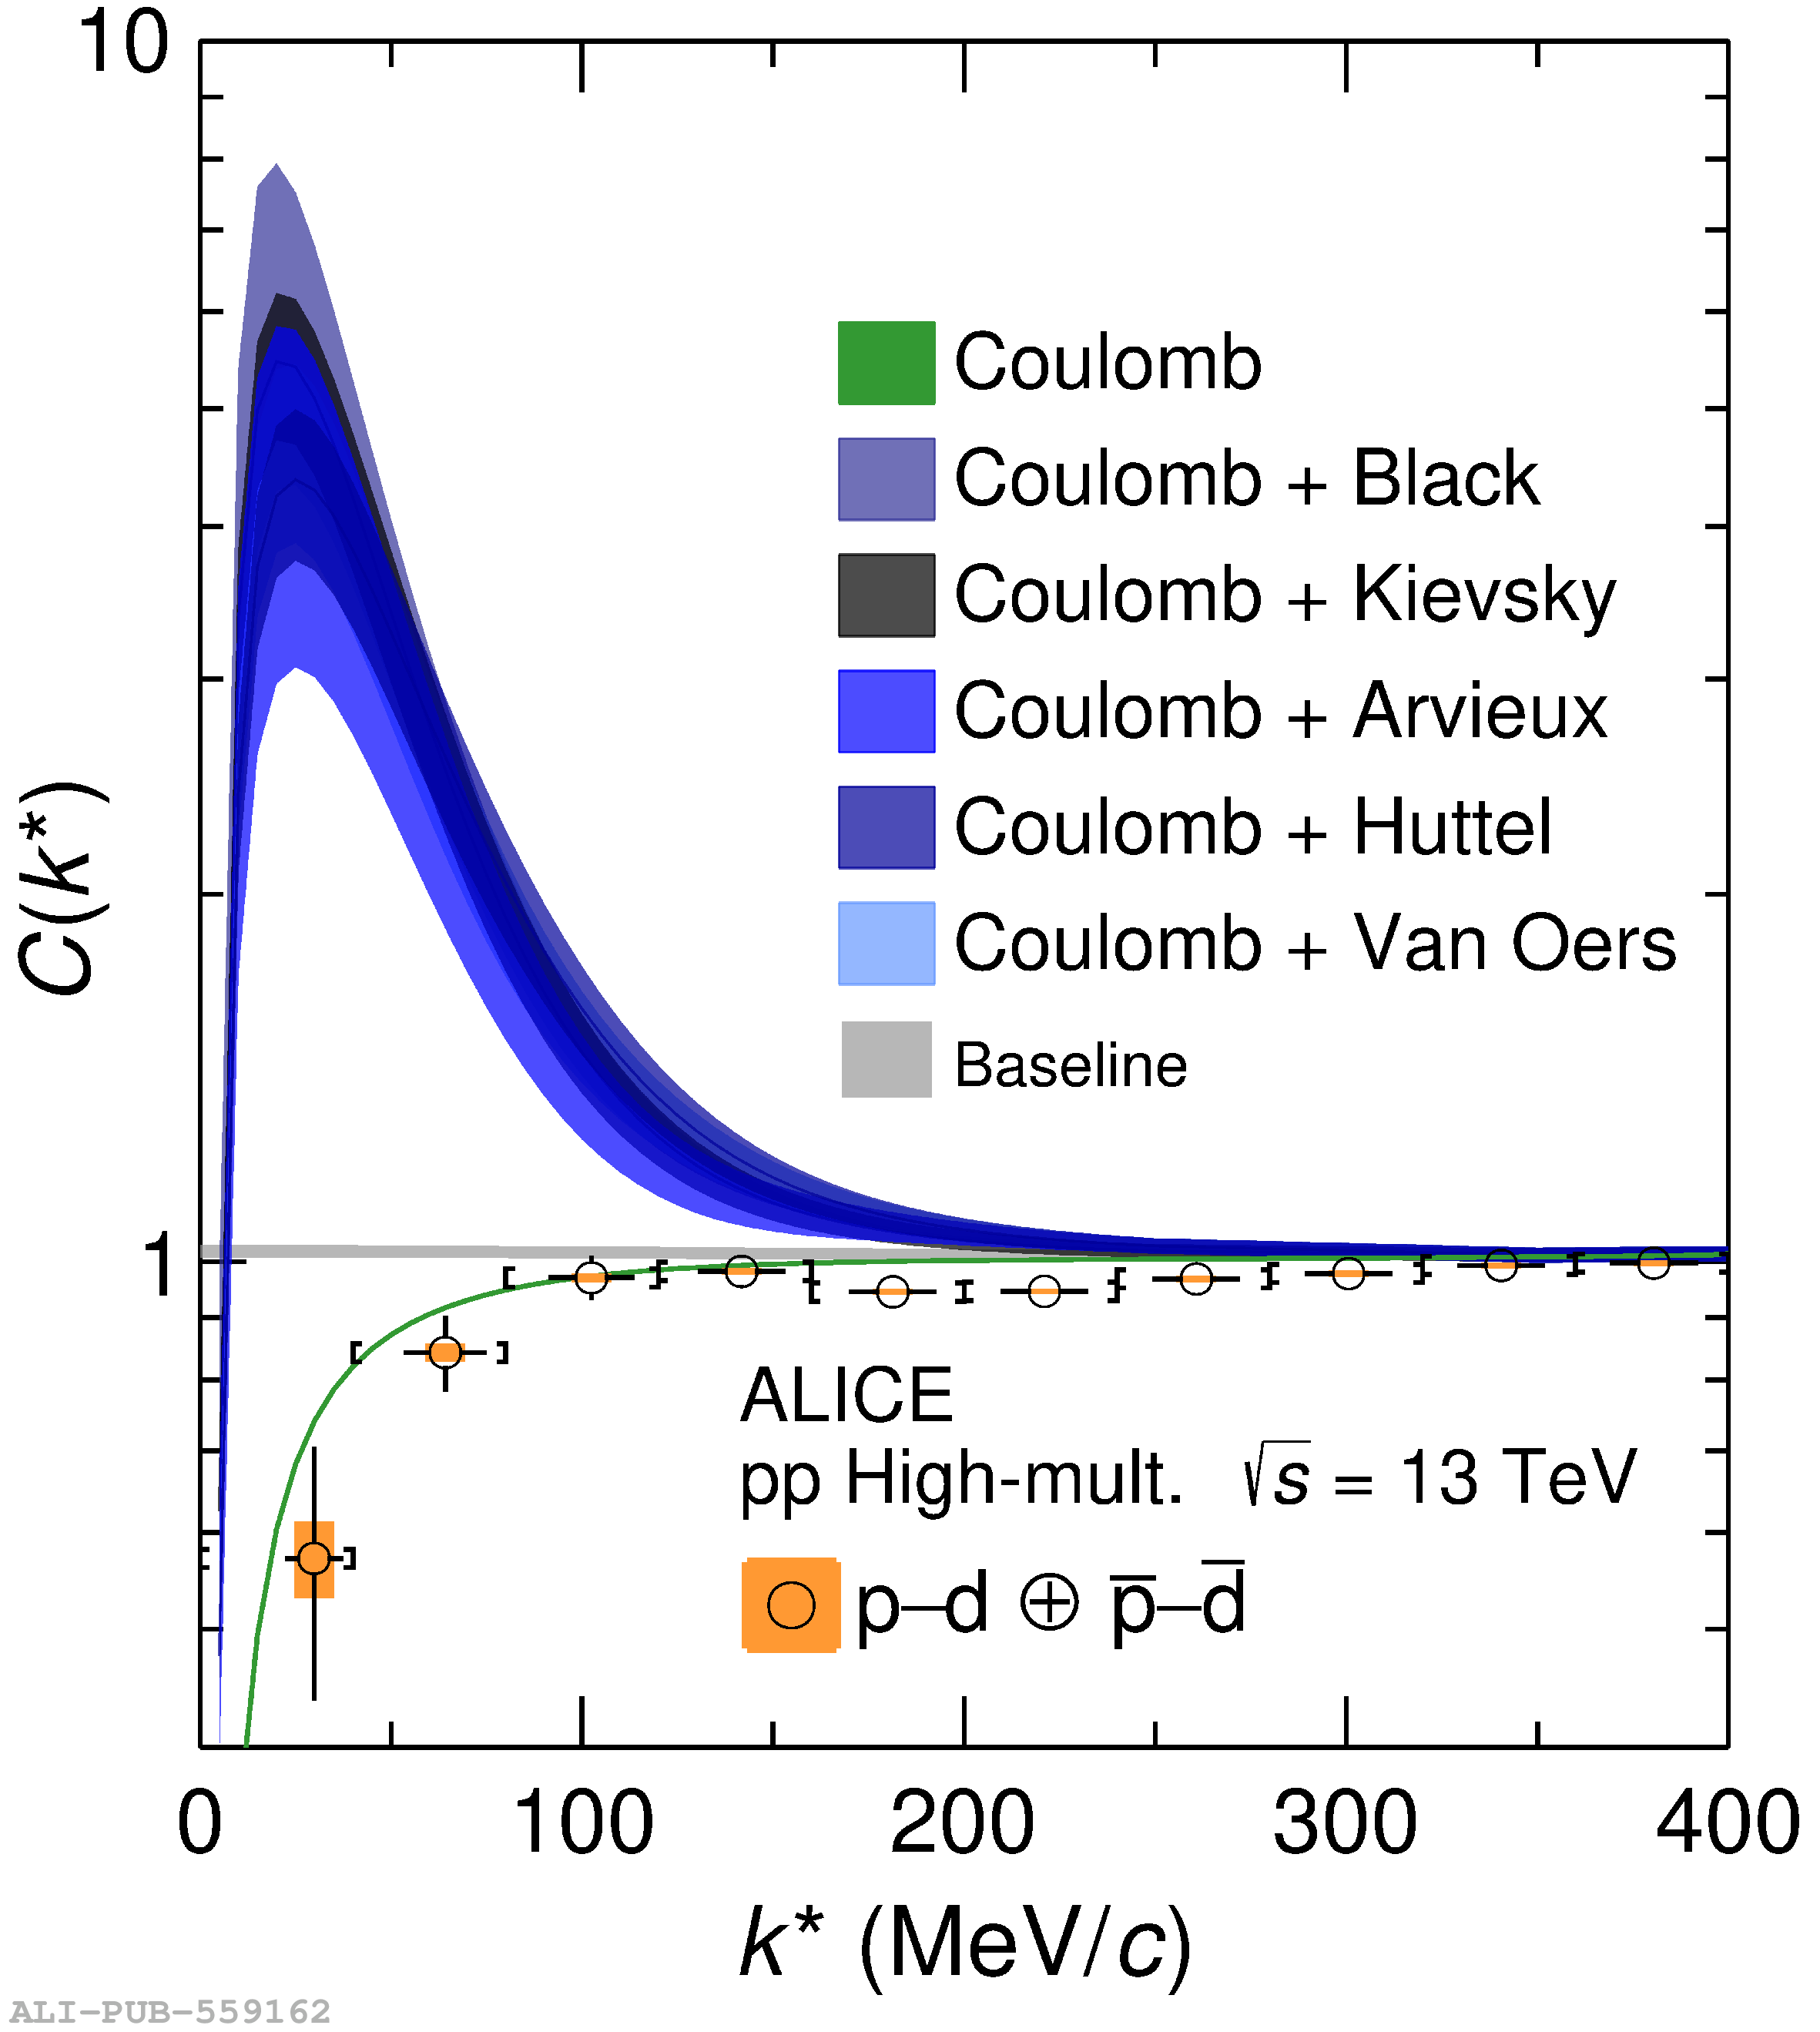

Figure 2
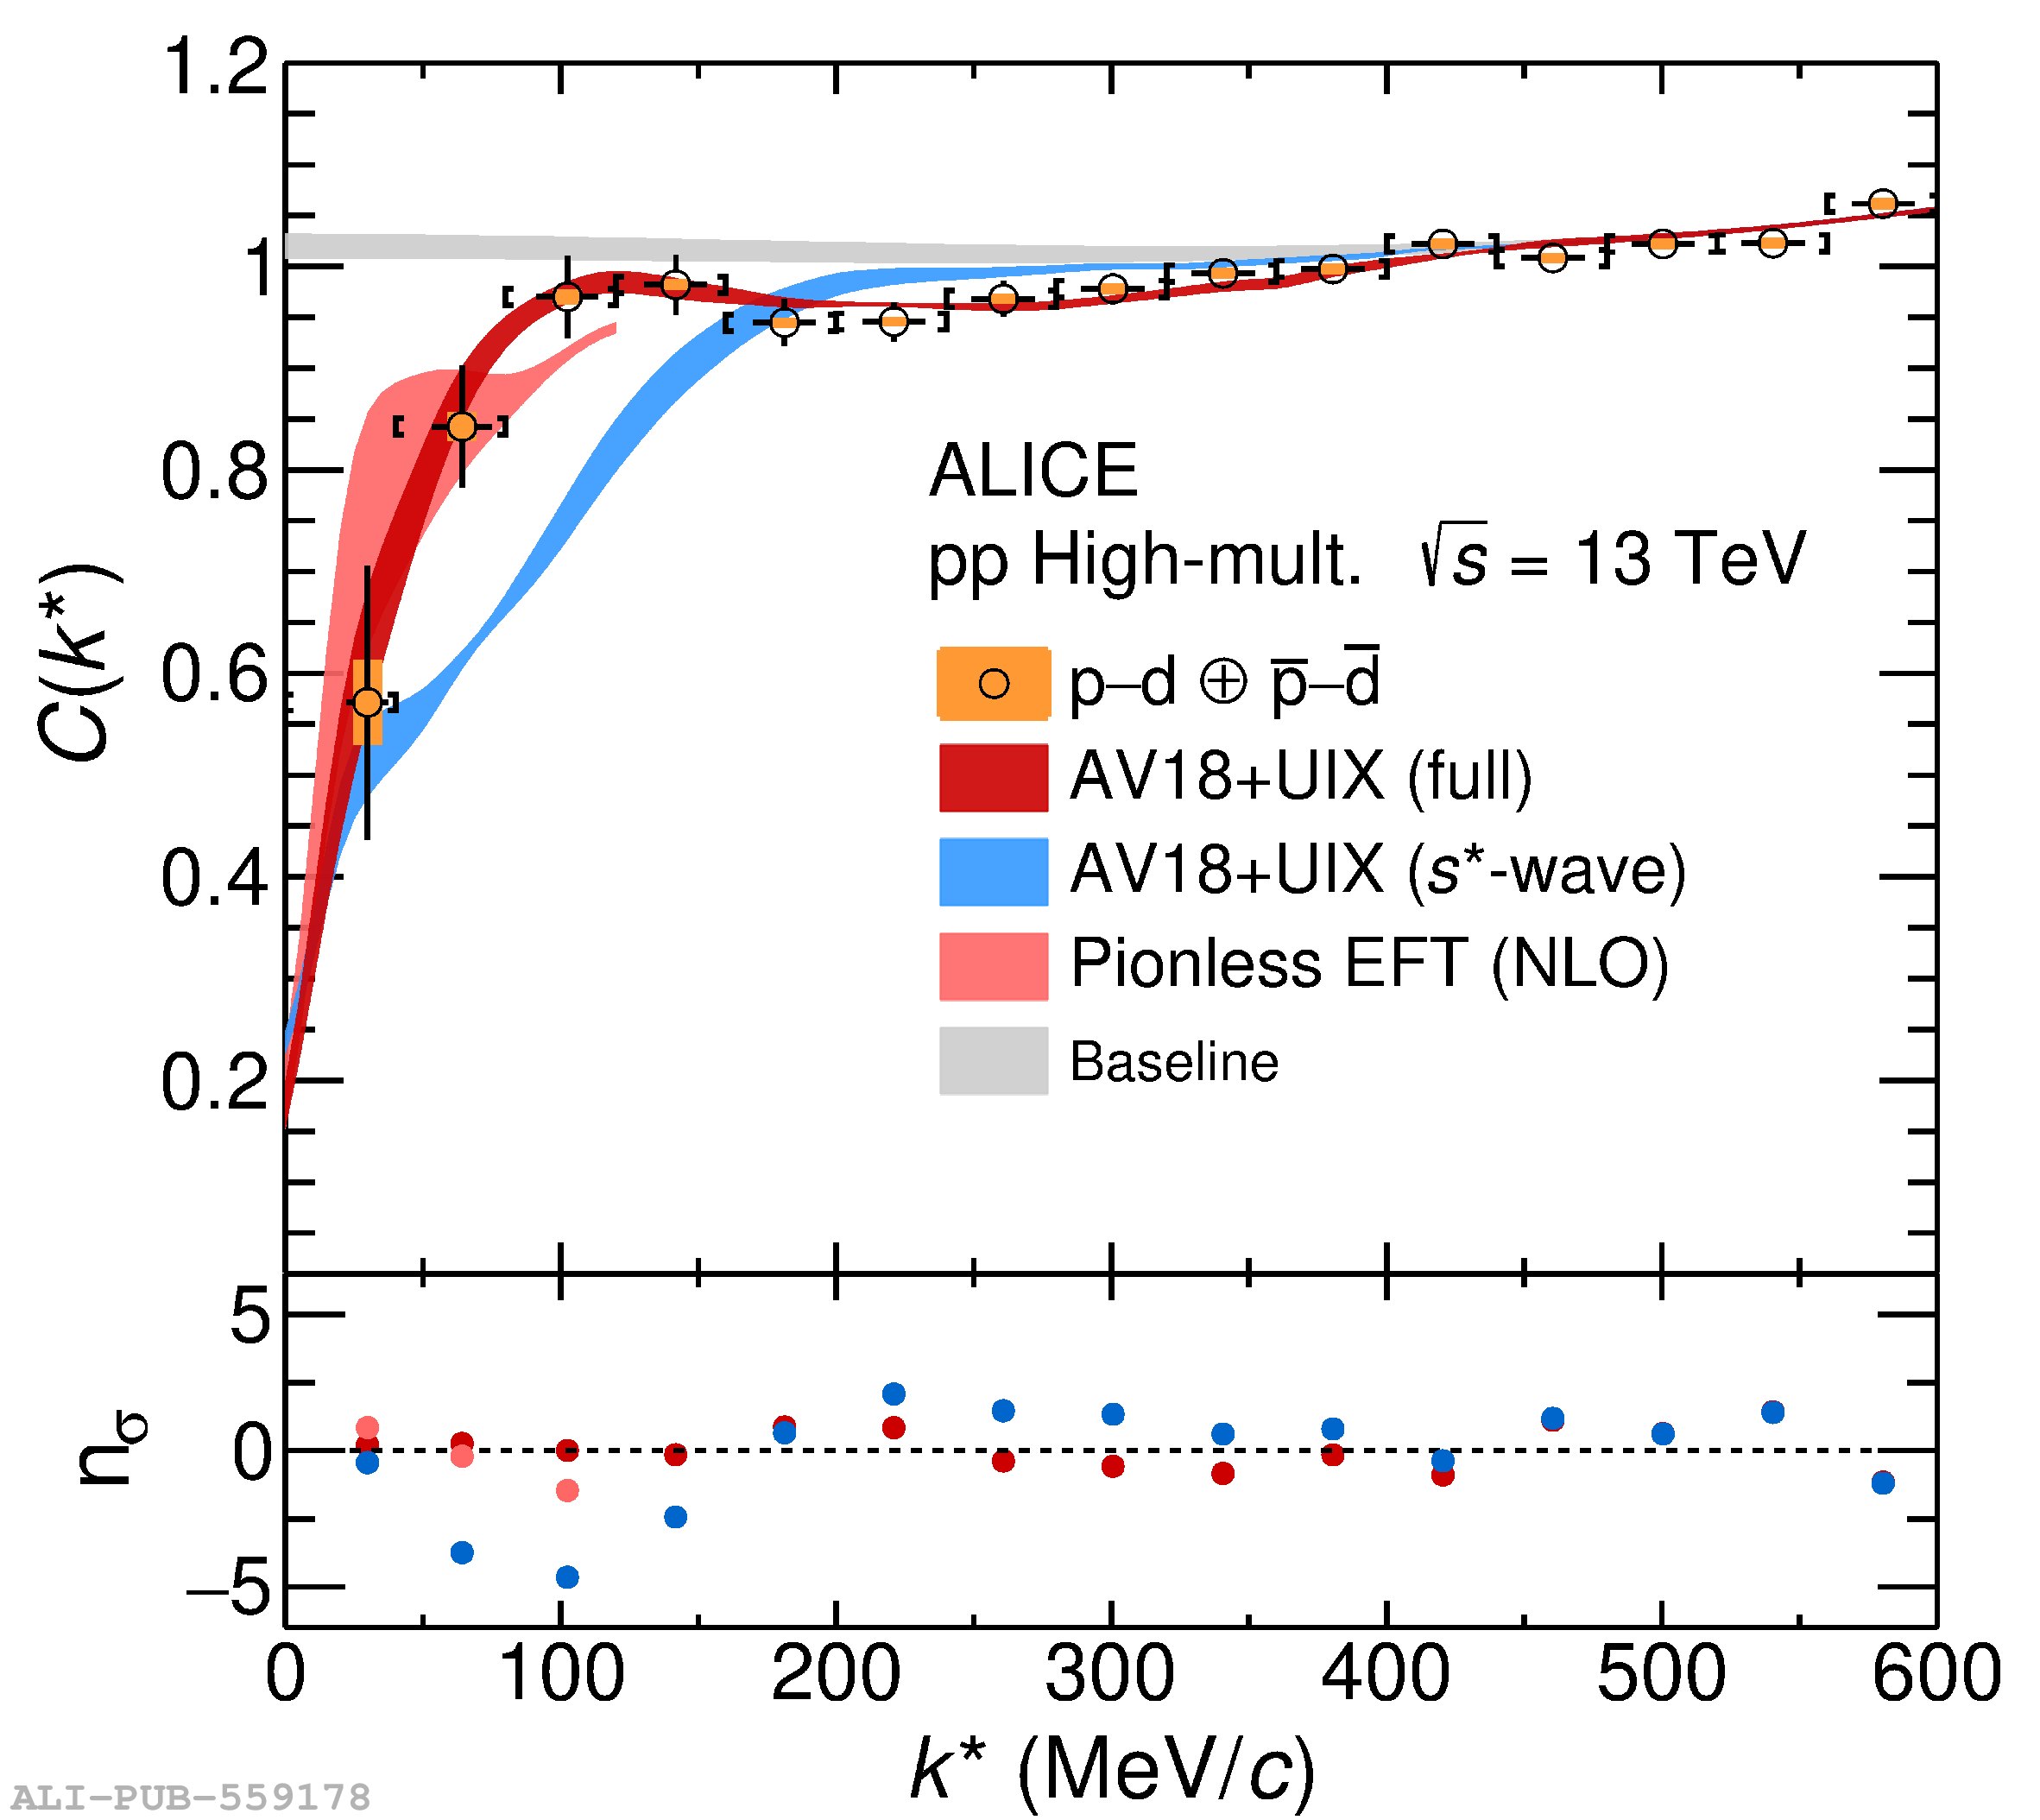
Measured p$-$d correlation function plotted as a function of the p$-$d relative momentum $k^*$ alongside theoretical calculations. The experimental data are represented by circular symbols. The black vertical bars and orange boxes correspond to the statistical and systematic uncertainties, respectively. The square brackets indicate the measurement bin width and the horizontal black lines represent the statistical uncertainty in the determination of the mean $k^*$ for each bin. The non-femtoscopic background contributions are represented by the gray band of the cubic baseline. Left panel: the orange and turquoise bands depict calculations obtained using an optimized Born approximation and Coulomb + antisymmetrization of the three-particle wave function, respectively. Right panel: the dark red band represents a fit of the modeled correlation calculated considering p$-$d as a three-body system with all relevant partial waves (see text). The blue-colored band corresponds to a calculation that includes only $J^\pi = \frac{1}{2}^+,\frac{3}{2}^+$ partial waves relative to the p$-$d system, which are dominated by the $s$-wave contributions and thus labeled with $s^*$. The light red band represents a calculation of the correlation function using Pionless EFT at NLO (see text). All calculations are multiplied by the cubic baseline, and the bandwidths of all calculations account for uncertainties in the determination of the radius and residual contributions. The lower panels present the difference between the measured and calculated correlation function, expressed as the number of standard deviations, $\text{n}_\sigma$, taking into account the statistical uncertainties of the data and the model uncertainties. | 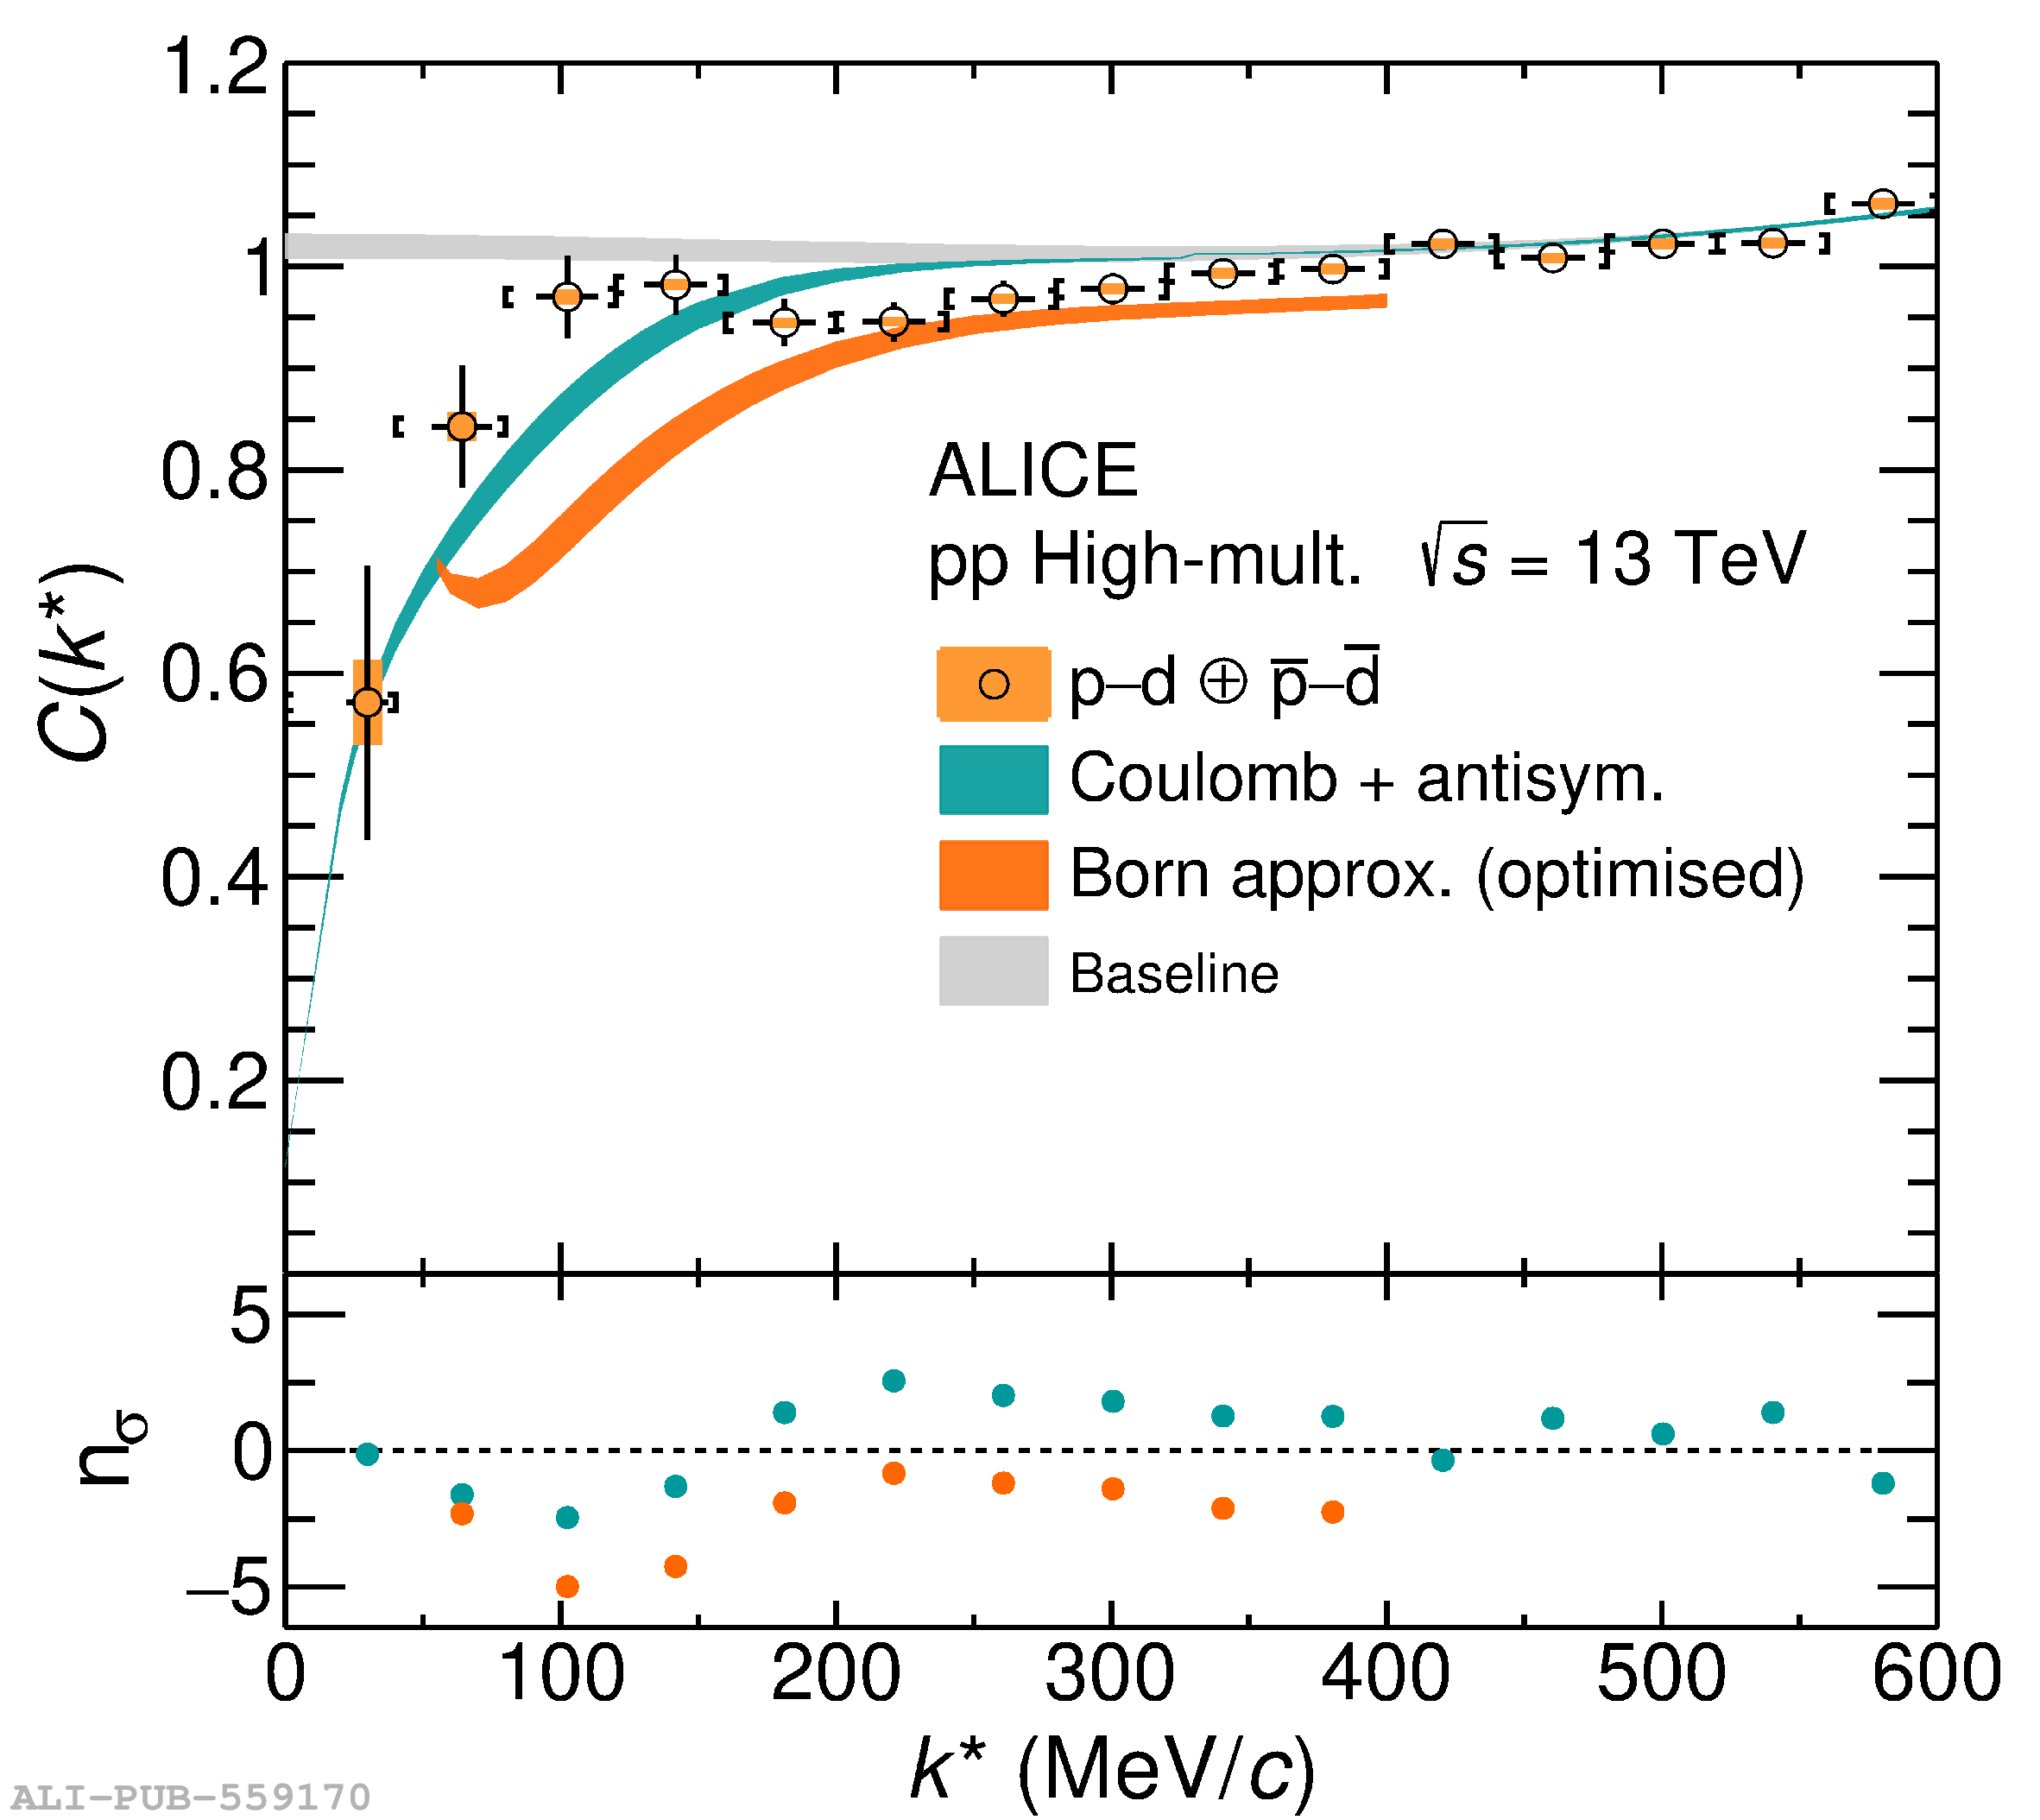  |