Left: ZN spectrum in pp collisions at $\sqrt{s}=$13 TeV for the MB sample (blue circles) and in three multiplicity intervals: high (magenta squares), intermediate (orange squares) and low (azure squares) multiplicity. Right: ratio of the spectra, normalised to the number of events in each bin, in the three multiplicity intervals to the MB spectrum. | 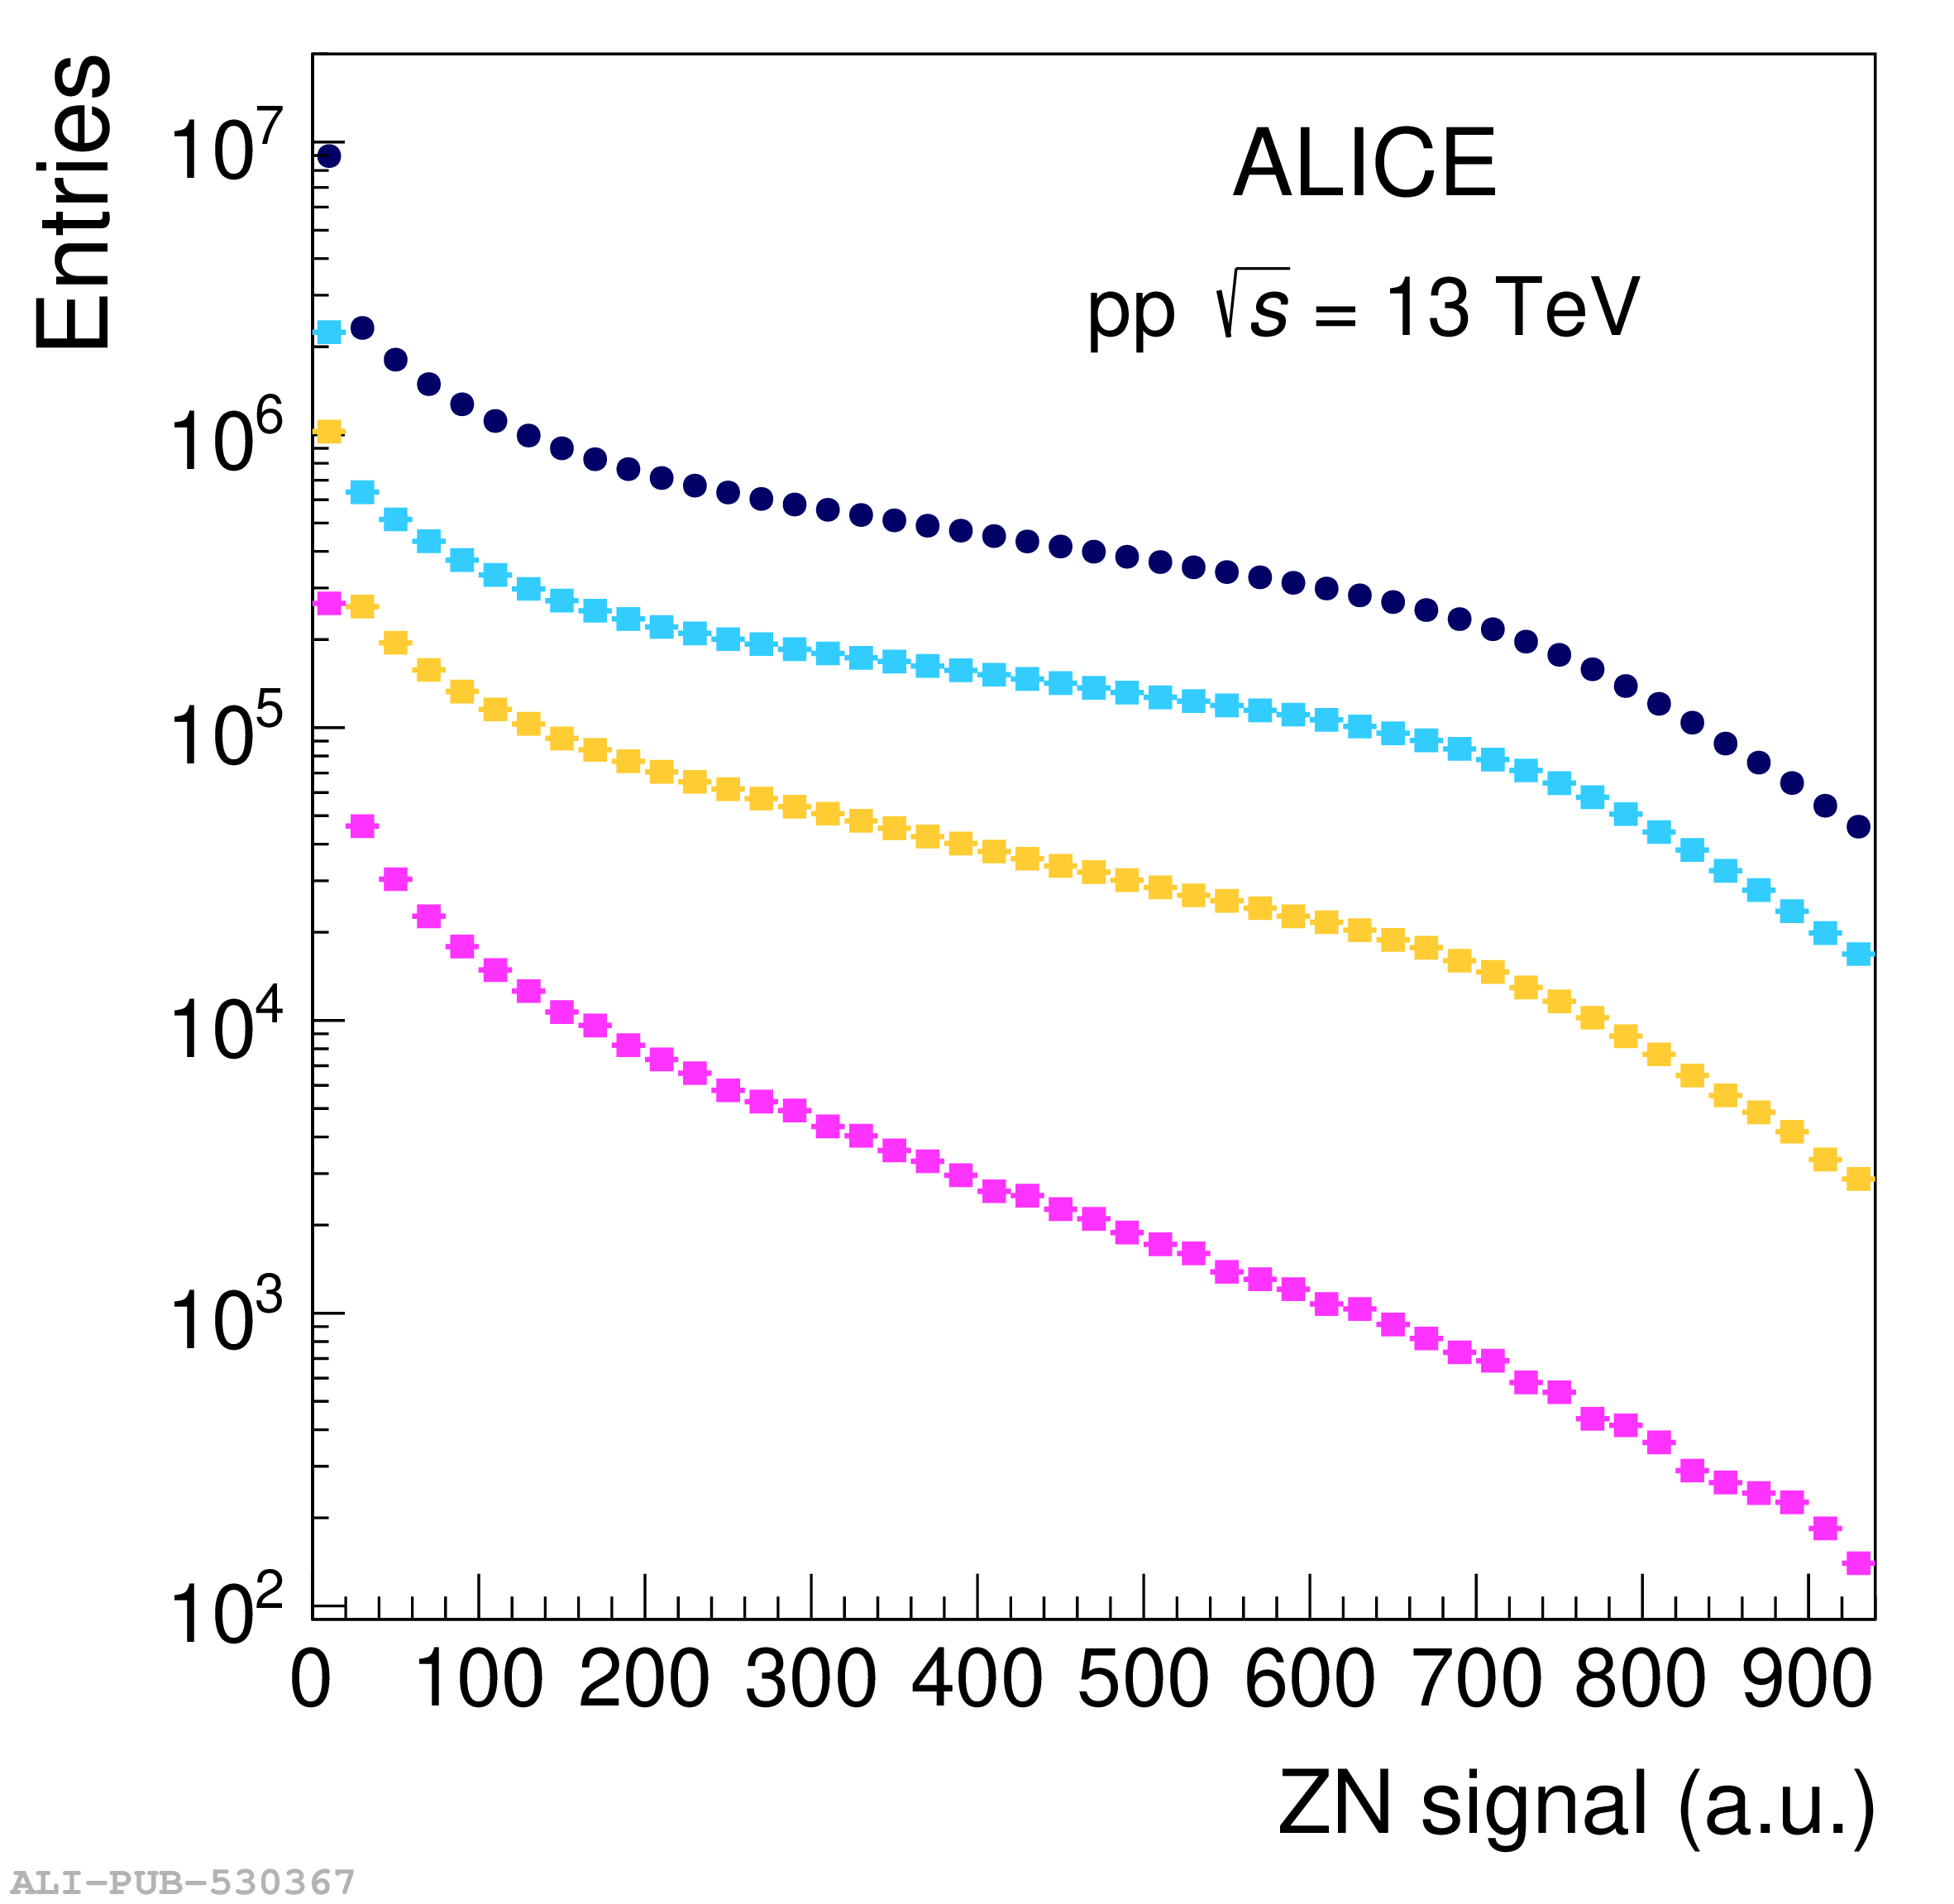 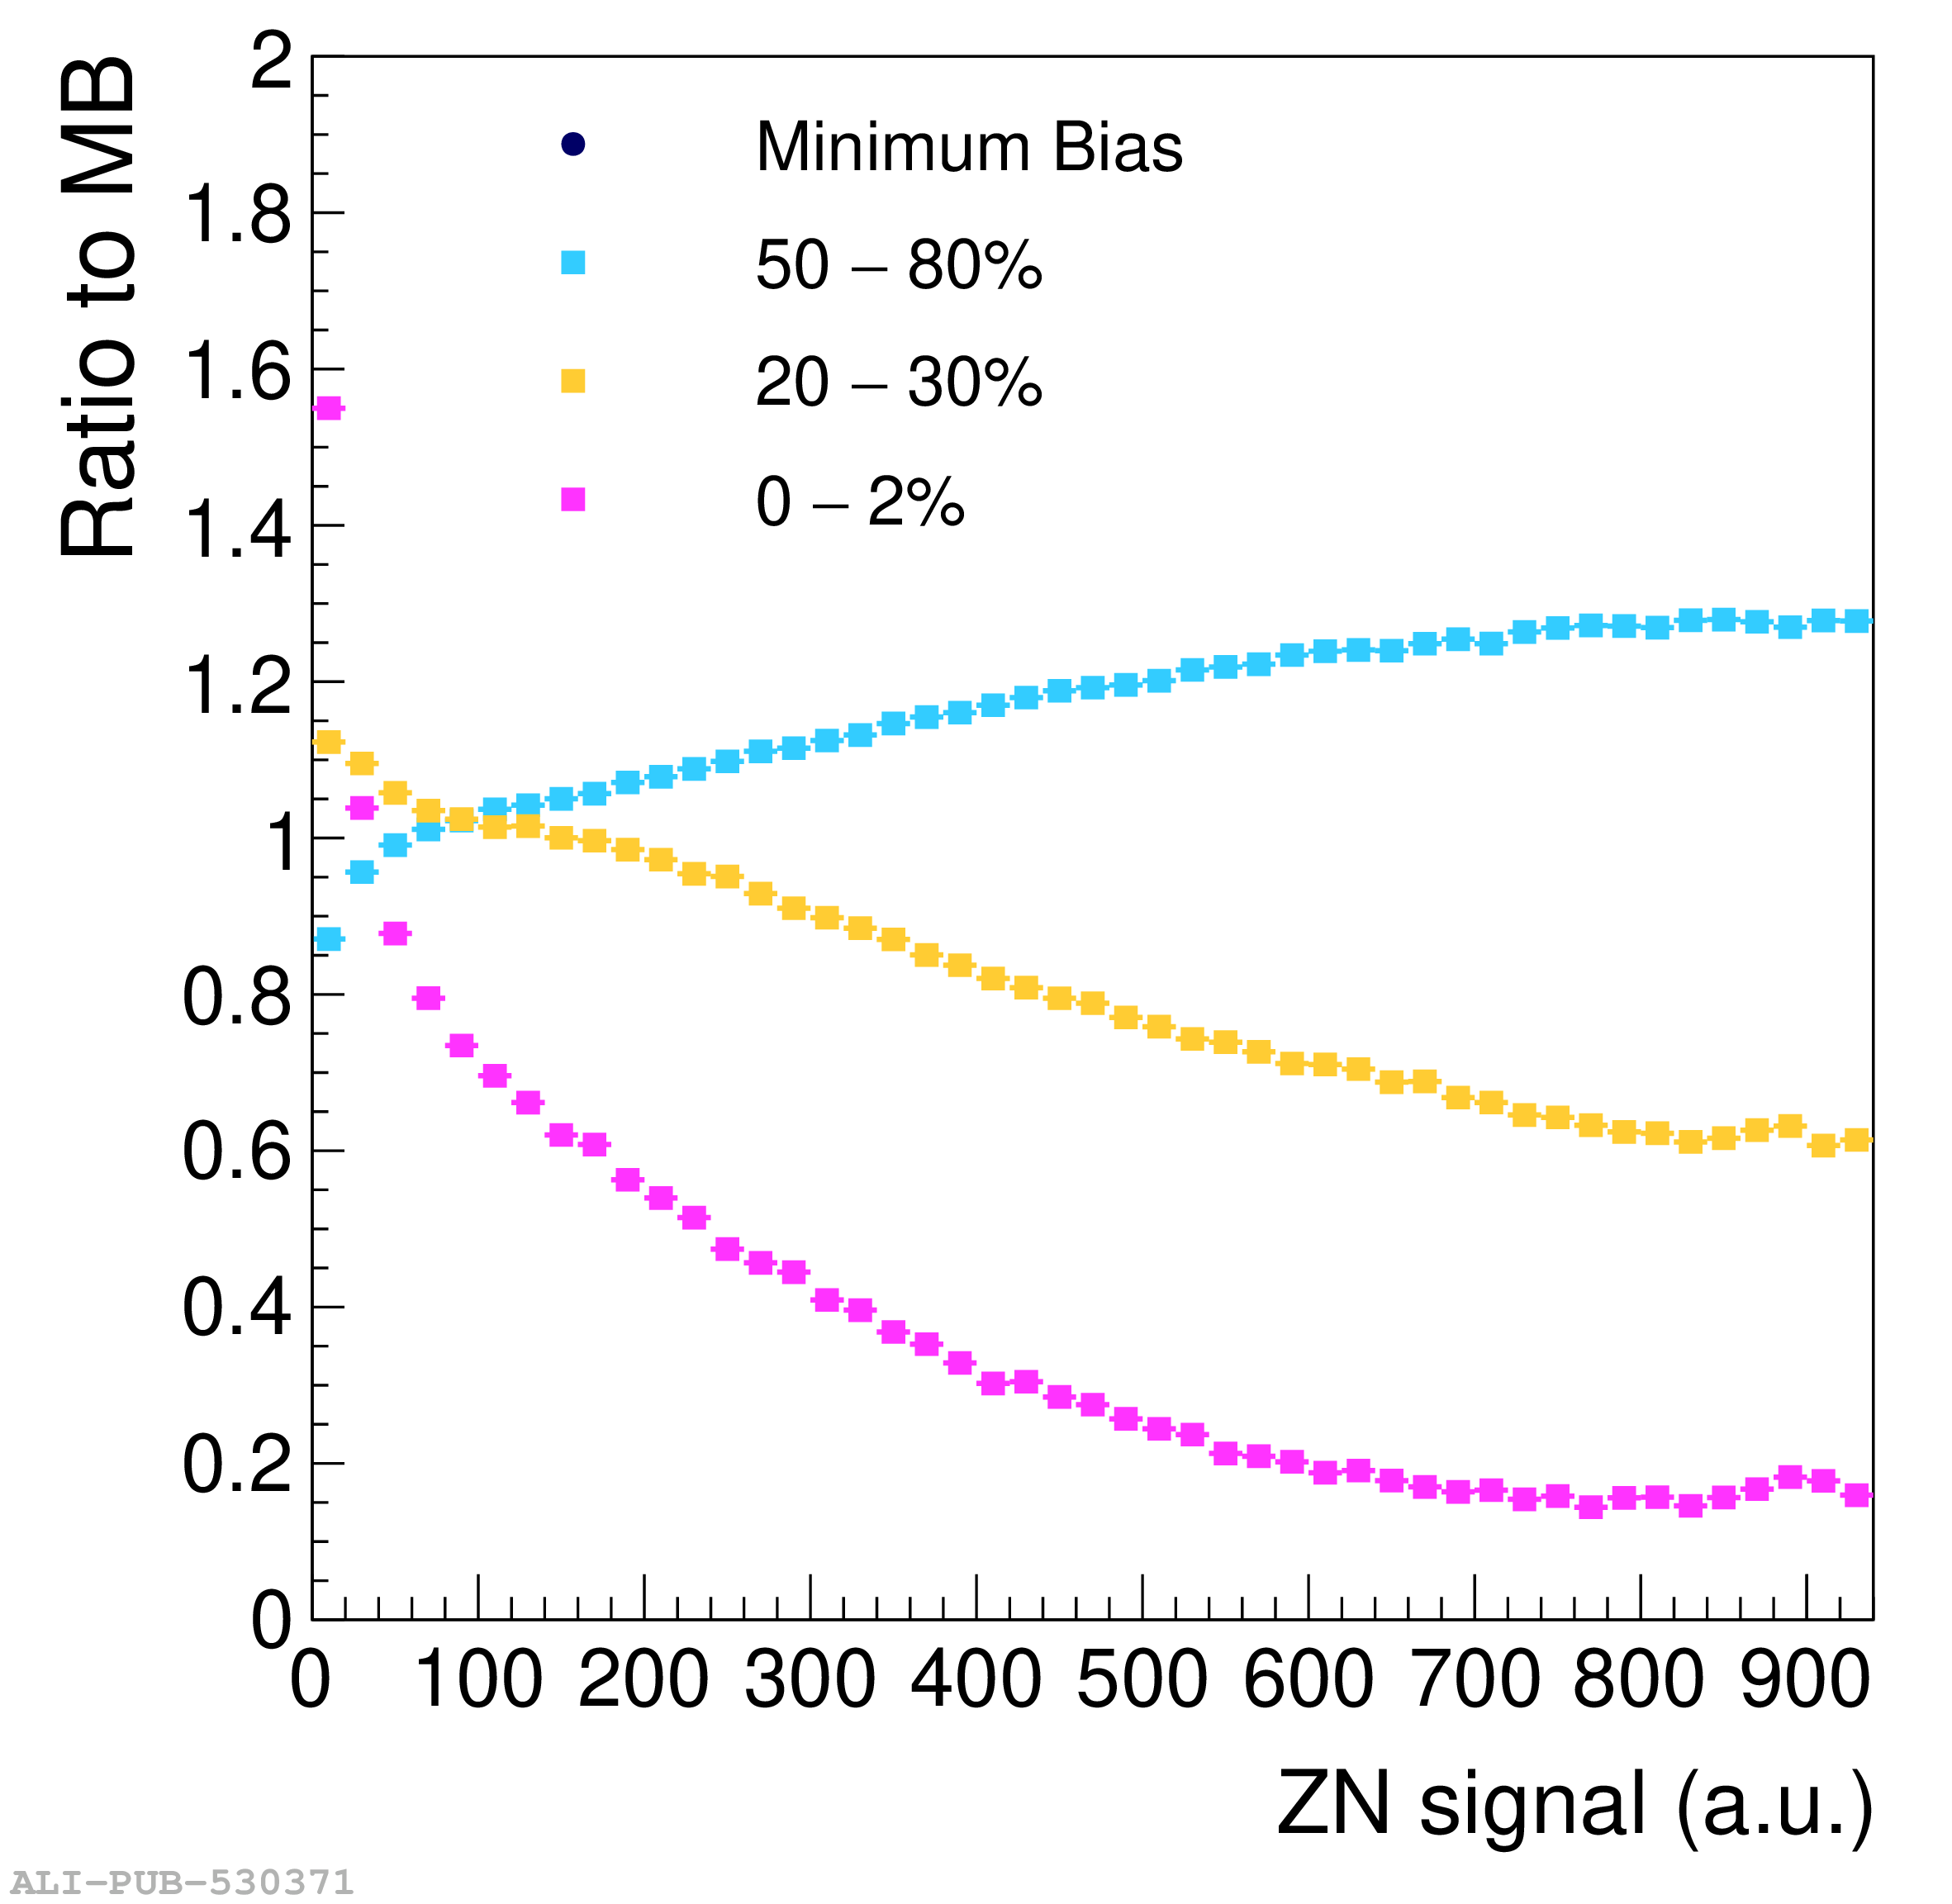 |