Invariant mass distribution of the $\Hee + \pi^{-}$ and charge conjugate pairs passing the analysis selections. Vertical lines represent the statistical Poissonian uncertainties. The invariant mass spectrum is fitted with a two-component model: the blue line represents the total fit while the orange dashed line shows the background component only. | 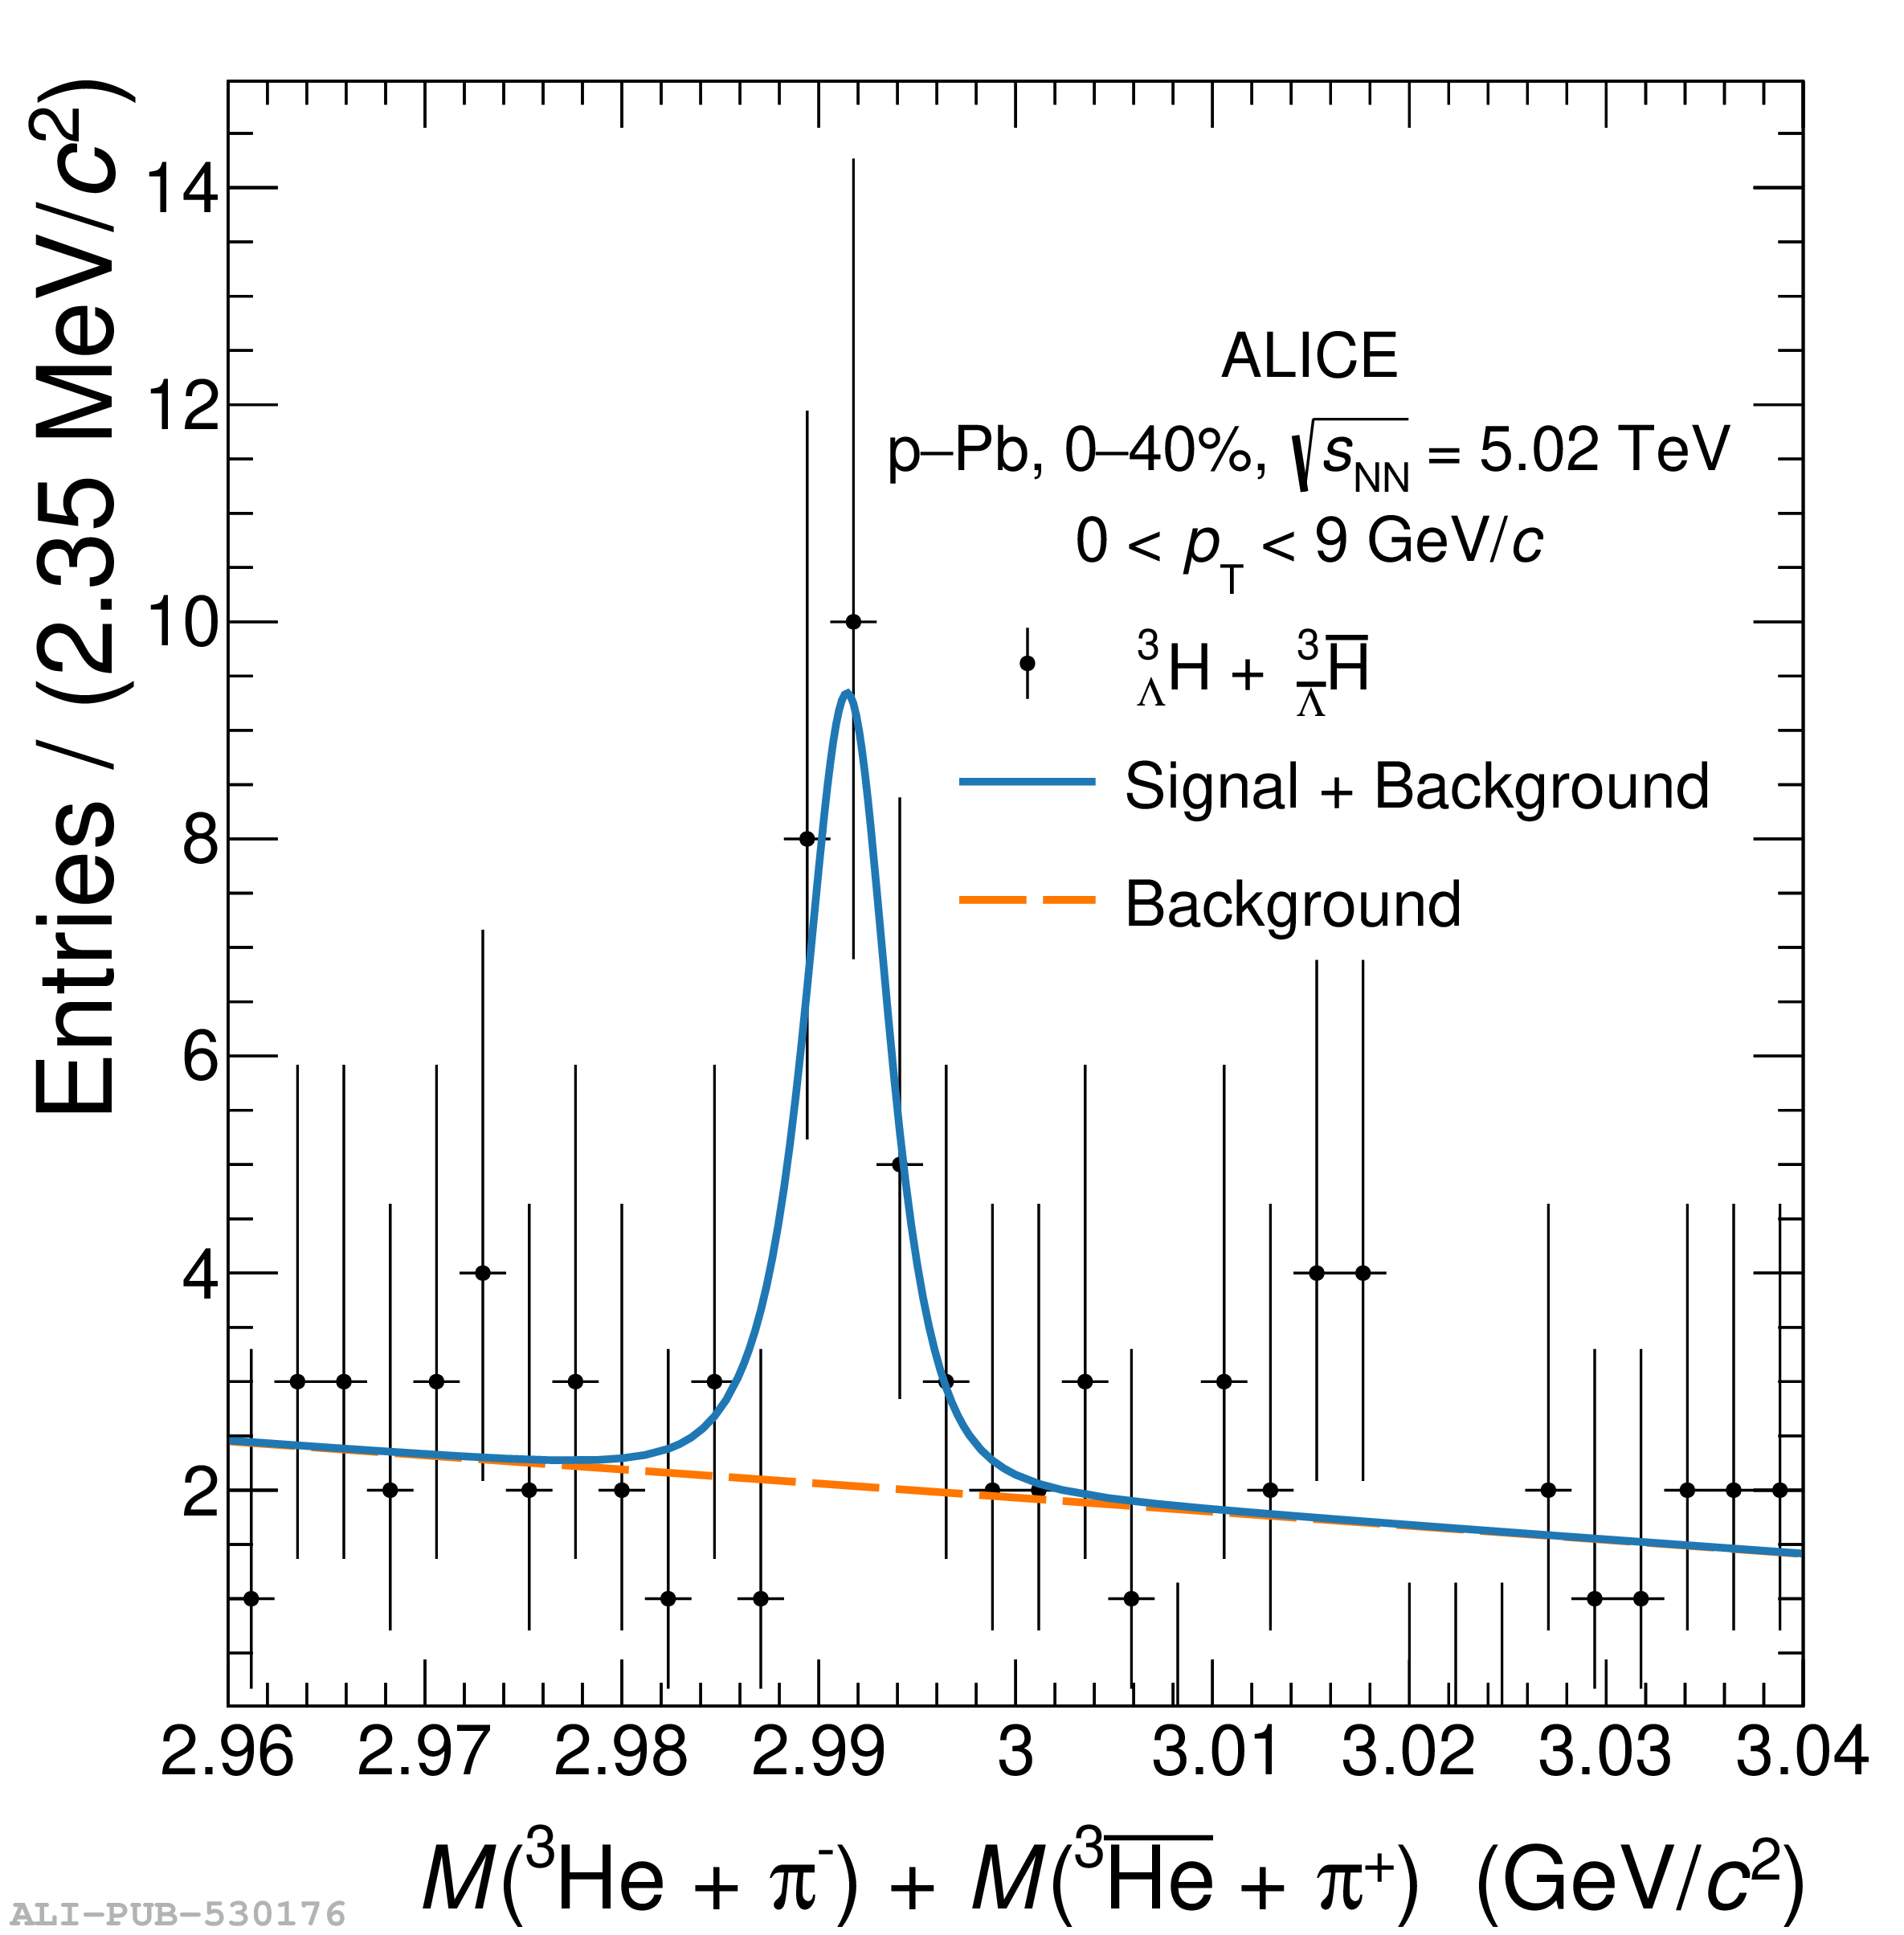 |