A study of strange hadron production associated with hard scattering processes and with the underlying event is conducted to investigate the origin of the enhanced production of strange hadrons in small collision systems characterised by large charged-particle multiplicities. For this purpose, the production of the single-strange meson ${\rm K^0_S}$ and the double-strange baryon $\Xi^{\pm}$ is measured, in each event, in the azimuthal direction of the highest-$p_{\rm T}$ particle (``trigger" particle), related to hard scattering processes, and in the direction transverse to it in azimuth, associated with the underlying event, in pp collisions at $\sqrt{s}=5.02$ TeV and $\sqrt{s}=13$ TeV using the ALICE detector at the LHC. The per-trigger yields of ${\rm K^0_S}$ and $\Xi^{\pm}$ are dominated by the transverse-to-leading production (i.e., in the direction transverse to the trigger particle), whose contribution relative to the toward-leading production is observed to increase with the event charged-particle multiplicity. The transverse-to-leading and the toward-leading $\Xi^{\pm}$/${\rm K^0_S}$ yield ratios increase with the multiplicity of charged particles, suggesting that strangeness enhancement with multiplicity is associated with both hard scattering processes and the underlying event. The relative production of $\Xi^{\pm}$ with respect to ${\rm K^0_S}$ is higher in transverse-to-leading processes over the whole multiplicity interval covered by the measurement. The ${\rm K}^{0}_{\rm{S}}$ and $\Xi^{\pm}$ per-trigger yields and yield ratios are compared with predictions of three different phenomenological models, namely PYTHIA 8.2 with the Monash tune, PYTHIA 8.2 with ropes and EPOS LHC. The comparison shows that none of them can quantitatively describe either the transverse-to-leading or the toward-leading yields of ${\rm K}^{0}_{\rm{S}}$ and $\Xi^{\pm}$.
JHEP 09 (2024) 204
HEP Data
e-Print: arXiv:2405.14511 | PDF | inSPIRE
CERN-EP-2024-133
Figure group

Figure 3
Transverse momentum distributions of $\mathrm{K^0_S}$ per unit $\Delta\eta\Delta\varphi$ area in pp collisions at $\sqrt{s}=13$ TeV. The left, central and right panels refer to full, transverse-to-leading and toward-leading production, respectively. Different colours refer to different multiplicity classes selected using the V0 detector, as indicated in the legend. The spectra are scaled by different factors to improve the visibility The bottom panels display the ratios to the spectra measured in the 0-100% multiplicity class The statistical errors are represented by the error bars, the systematic uncertainties by the empty boxes Error bars are smaller than the marker size and are therefore not visible. |  |
Figure 4
Transverse momentum distributions of $\Xi^\pm$ per unit $\Delta\eta\Delta\varphi$ area in pp collisions at $\sqrt{s}=13$ TeV. The left, central and right panels refer to full, transverse-to-leading and toward-leading production, respectively. Different colours refer to different multiplicity classes selected using the V0 detector, as indicated in the legend. The spectra are scaled by different factors to improve the visibility The bottom panels display the ratios to the spectra measured in the 0-100% multiplicity class The statistical errors are represented by the error bars, the systematic uncertainties by the empty boxes Error bars are smaller than the marker size and are therefore not visible. |  |
Figure 5
Transverse momentum distributions of $\mathrm{K^0_S}$ per unit $\Delta\eta\Delta\varphi$ area in pp collisions at $\sqrt{s}=5.02$ TeV. The left, central and right panels refer to full, transverse-to-leading and toward-leading production, respectively. Different colours refer to different multiplicity classes selected using the V0 detector, as indicated in the legend. The spectra are scaled by different factors to improve the visibility The bottom panels display the ratios to the spectra measured in the 0--00% multiplicity class The statistical errors are represented by the error bars, the systematic uncertainties by the empty boxes Error bars are smaller than the marker size and are therefore not visible. |  |
Figure 6
Transverse momentum distributions of $\Xi^\pm$ per unit $\Delta\eta\Delta\varphi$ area in pp collisions at $\sqrt{s}=5.02$ TeV. The left, central and right panels refer to full, transverse-to-leading and toward-leading production, respectively. Different colours refer to different multiplicity classes selected using the V0 detector, as indicated in the legend. The spectra are scaled by different factors to improve the visibility The bottom panels display the ratios to the spectra measured in the 0-100% multiplicity class The statistical errors are represented by the error bars, the systematic uncertainties by the empty boxes Error bars are smaller than the marker size and are therefore not visible. |  |
Figure 7
Upper panel: full (blue), transverse-to-leading (green) and toward-leading (red) $\mathrm{K^0_S}$ yields per unit $\Delta\eta\Delta\varphi$ area as a function of the charged-particle multiplicity measured in events with a trigger particle. The data points are drawn with markers, the model predictions with lines of different styles, as indicated in the legend. Statistical and systematic uncertainties of the data points are shown by error bars and empty boxes, respectively. Shadowed boxes represent systematic uncertainties uncorrelated across multiplicity. The sum in quadrature of statistical and systematic uncertainties of the model predictions are shown by error bars, too small to be visible in the plot. Bottom panel: ratio between the model predictions and the cubic spline fitted to the data points. The shaded band around one represents the sum in quadrature of the statistical and systematic uncertainties of the data points. | 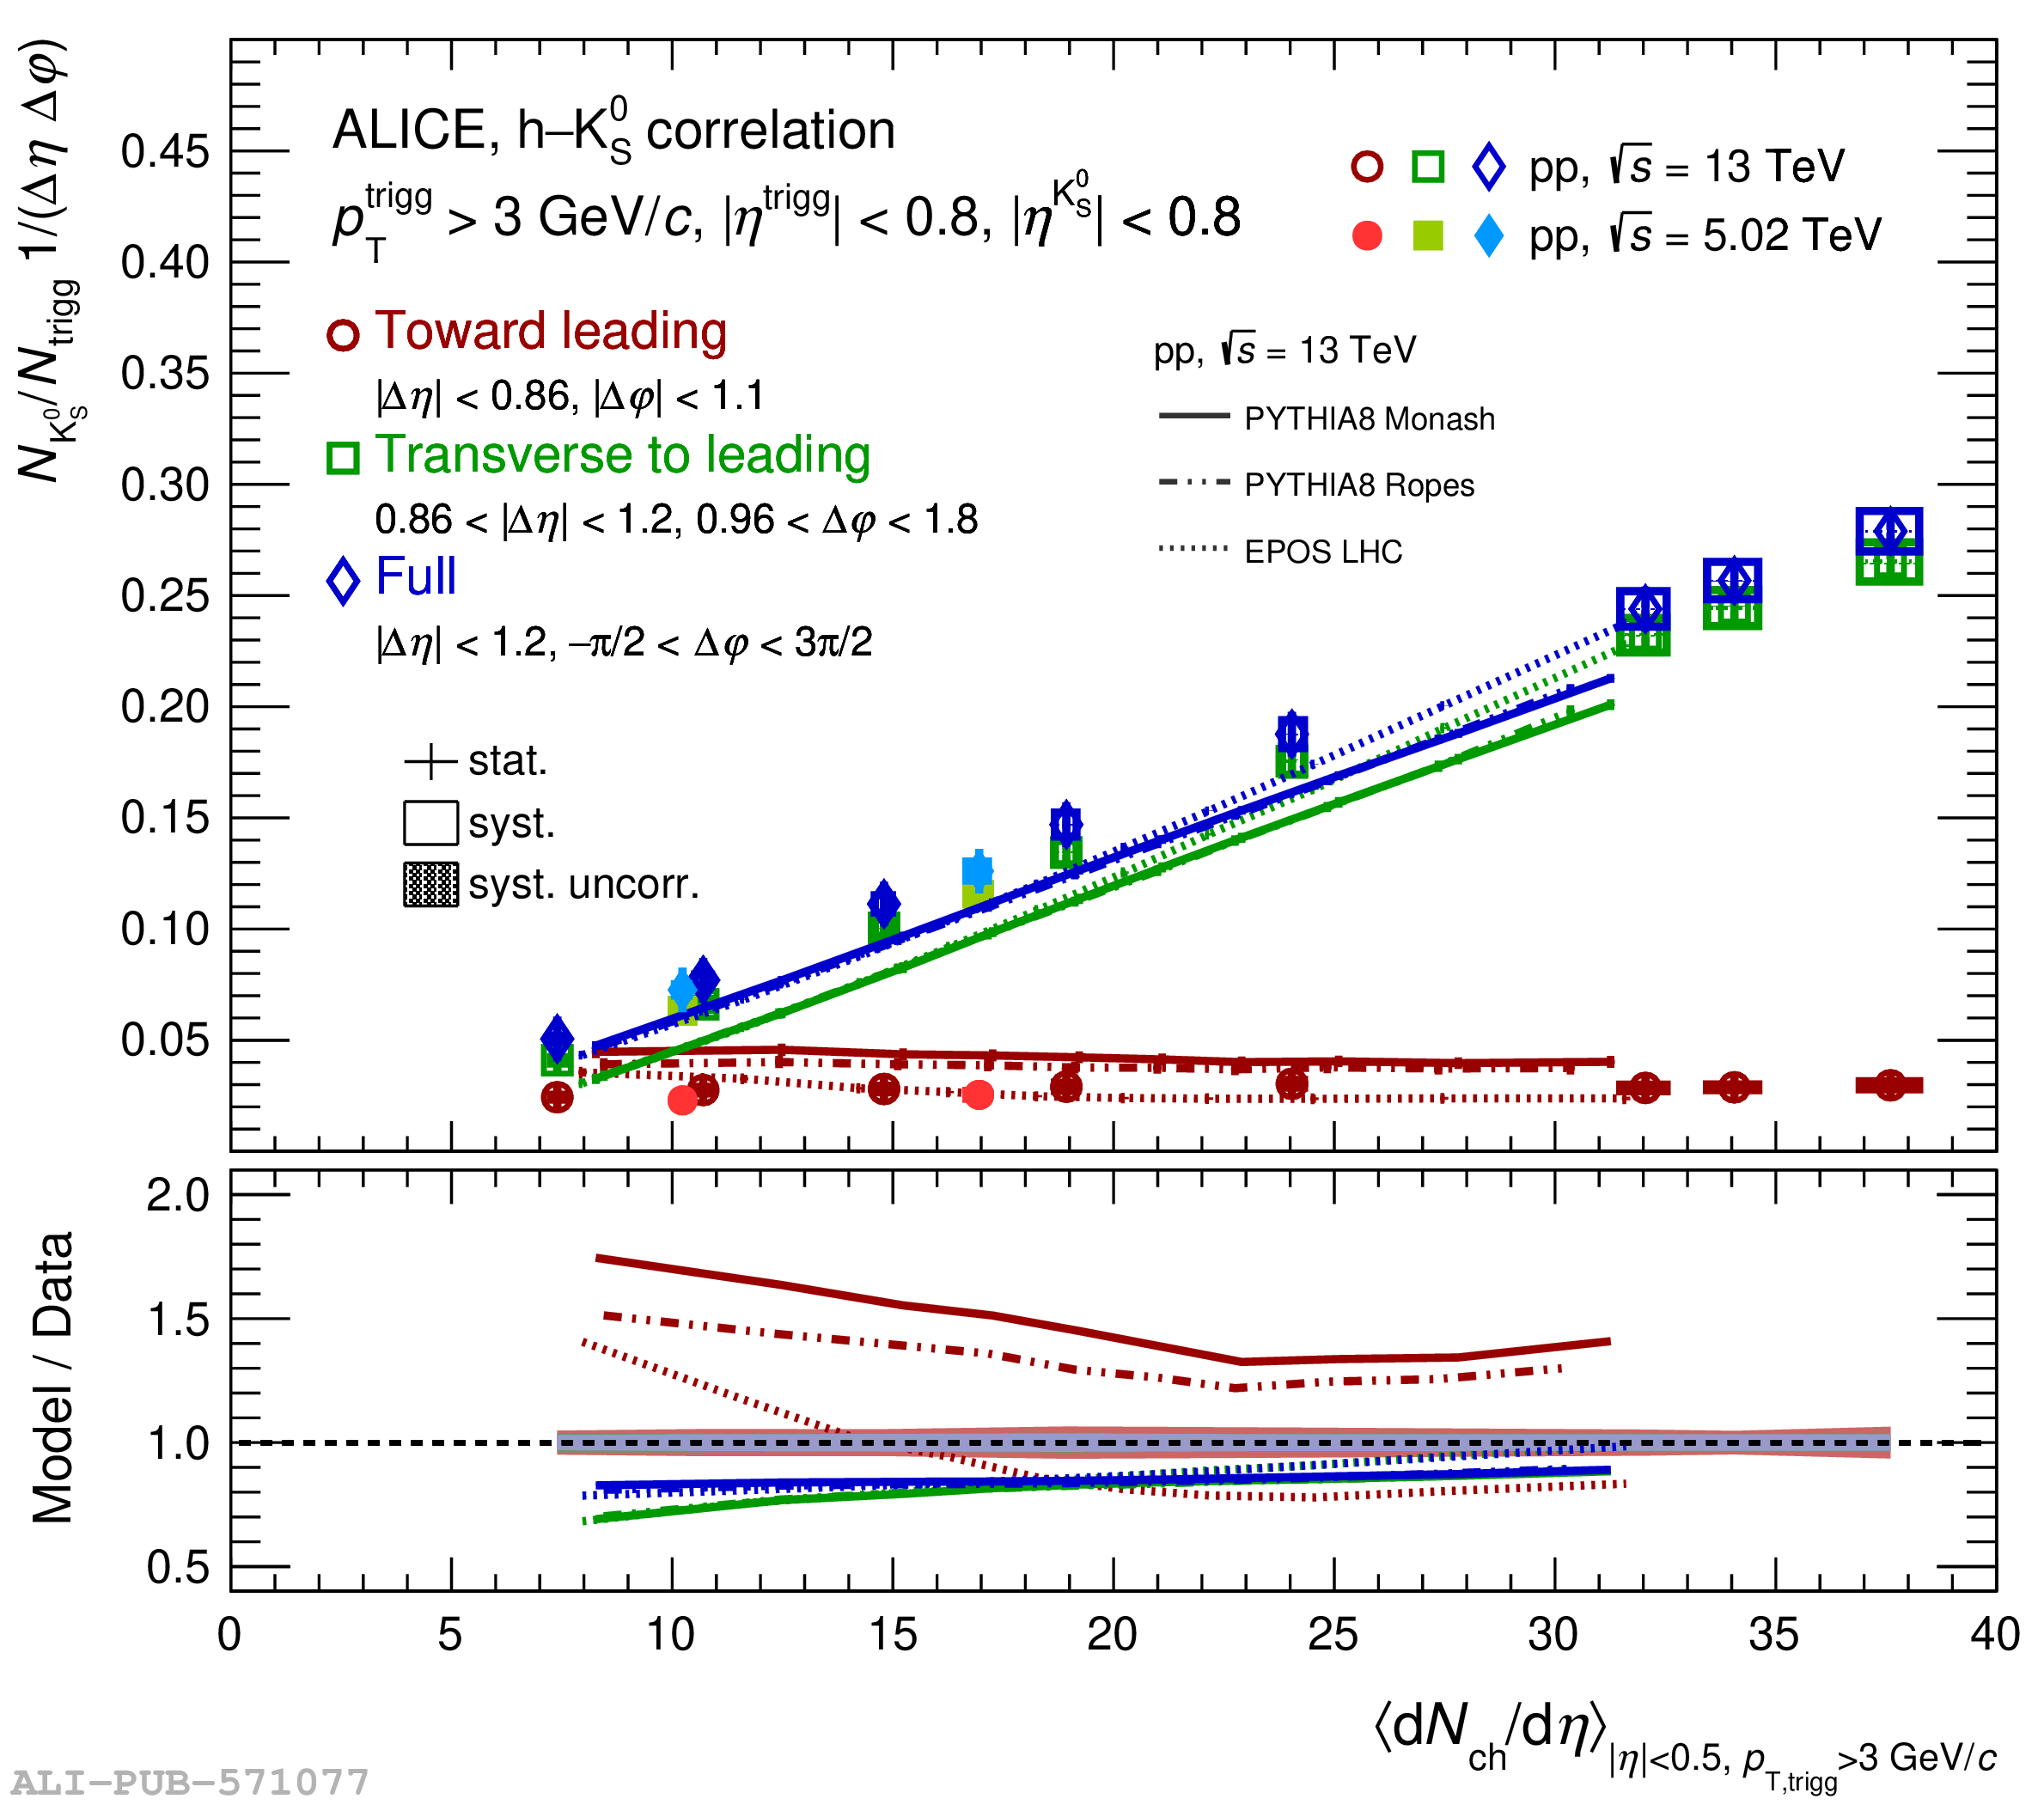 |
Figure 8
Upper panel: full (blue), transverse-to-leading (green) and toward-leading (red) $\Xi^\pm$ yields per unit $\Delta\eta\Delta\varphi$ area as a function of the charged-particle multiplicity measured in events with a trigger particle. The data points are drawn with markers, the model predictions with lines of different styles, as indicated in the legend. Statistical and systematic uncertainties of the data points are shown by error bars and empty boxes, respectively. Shadowed boxes represent systematic uncertainties uncorrelated across multiplicity. The sum in quadrature of statistical and systematic uncertainties of the model predictions are shown by error bars, too small to be visible in the plot. Bottom panel: ratio between the model predictions and the cubic spline fitted to the data points. The shaded band around one represents the sum in quadrature of the statistical and systematic uncertainties of the data points. |  |
Figure 9
Upper panel: toward-leading $\mathrm{K^0_S}$ (magenta) and $\Xi^\pm$ (light blue) yields per unit $\Delta\eta\Delta\varphi$ area as a function of the charged-particle multiplicity measured in events with a trigger particle. The $\Xi^\pm$ yields are scaled such that the lowest-multiplicity $\Xi^\pm$ yield matches the $\mathrm{K^0_S}$ one. The data points are drawn with markers, the model predictions with lines of different styles, as indicated in the legend. Statistical and systematic uncertainties of the data points are shown by error bars and empty boxes, respectively. Shadowed boxes represent systematic uncertainties uncorrelated across multiplicity. The width of the bands represents the sum in quadrature of statistical and systematic uncertainties of the model predictions. Bottom panel: ratio between the model predictions and the cubic spline fitted to the data points. The shaded band around one represents the sum in quadrature of the statistical and systematic uncertainties of the data points. |  |
Figure 10
Top panel: full (blue), transverse-to-leading (green) and toward-leading (red) $\Xi^\pm/\mathrm{K^0_S}$ yield ratios as a function of the charged-particle multiplicity measured at midrapidity in events with a trigger particle. The data points are drawn with markers, and their statistical and systematic uncertainties are shown by error bars and empty boxes, respectively. Shadowed boxes represent systematic uncertainties uncorrelated across multiplicity The model predictions are drawn with lines of different styles. The width of the bands represents the sum in quadrature of statistical and systematic uncertainties of the model predictions, and is visible only for toward-leading production. Central panel: ratio between the model predictions and the cubic spline fitted to the data points. The shaded band around unity represents the sum in quadrature of the statistical and systematic uncertainties of the data points. Bottom panel: double ratio between the toward-leading and the transverse-to-leading $\Xi^\pm/\mathrm{K^0_S}$ ratios. |  |