$\chi^2$ distributions obtained by comparing the measured $C_{\pD}(\kstar)$ for $\kstar < \SI{200}{\MeVc}$ with the correlation function calculated with an interaction modeled by a Gaussian potential with an interaction range given by $\uprho$-meson exchanges as a function of the inverse scattering length (left panel) and the interaction potential (right panel) for $\mathrm{I}=0$. The blue dotted lines represent the value of $f_{0, \mathrm{I}=0}^{-1}$ and $V_\mathrm{I}=0$ for which the $\chi^2$ is minimum and for the $1\,\sigma$ confidence interval. | 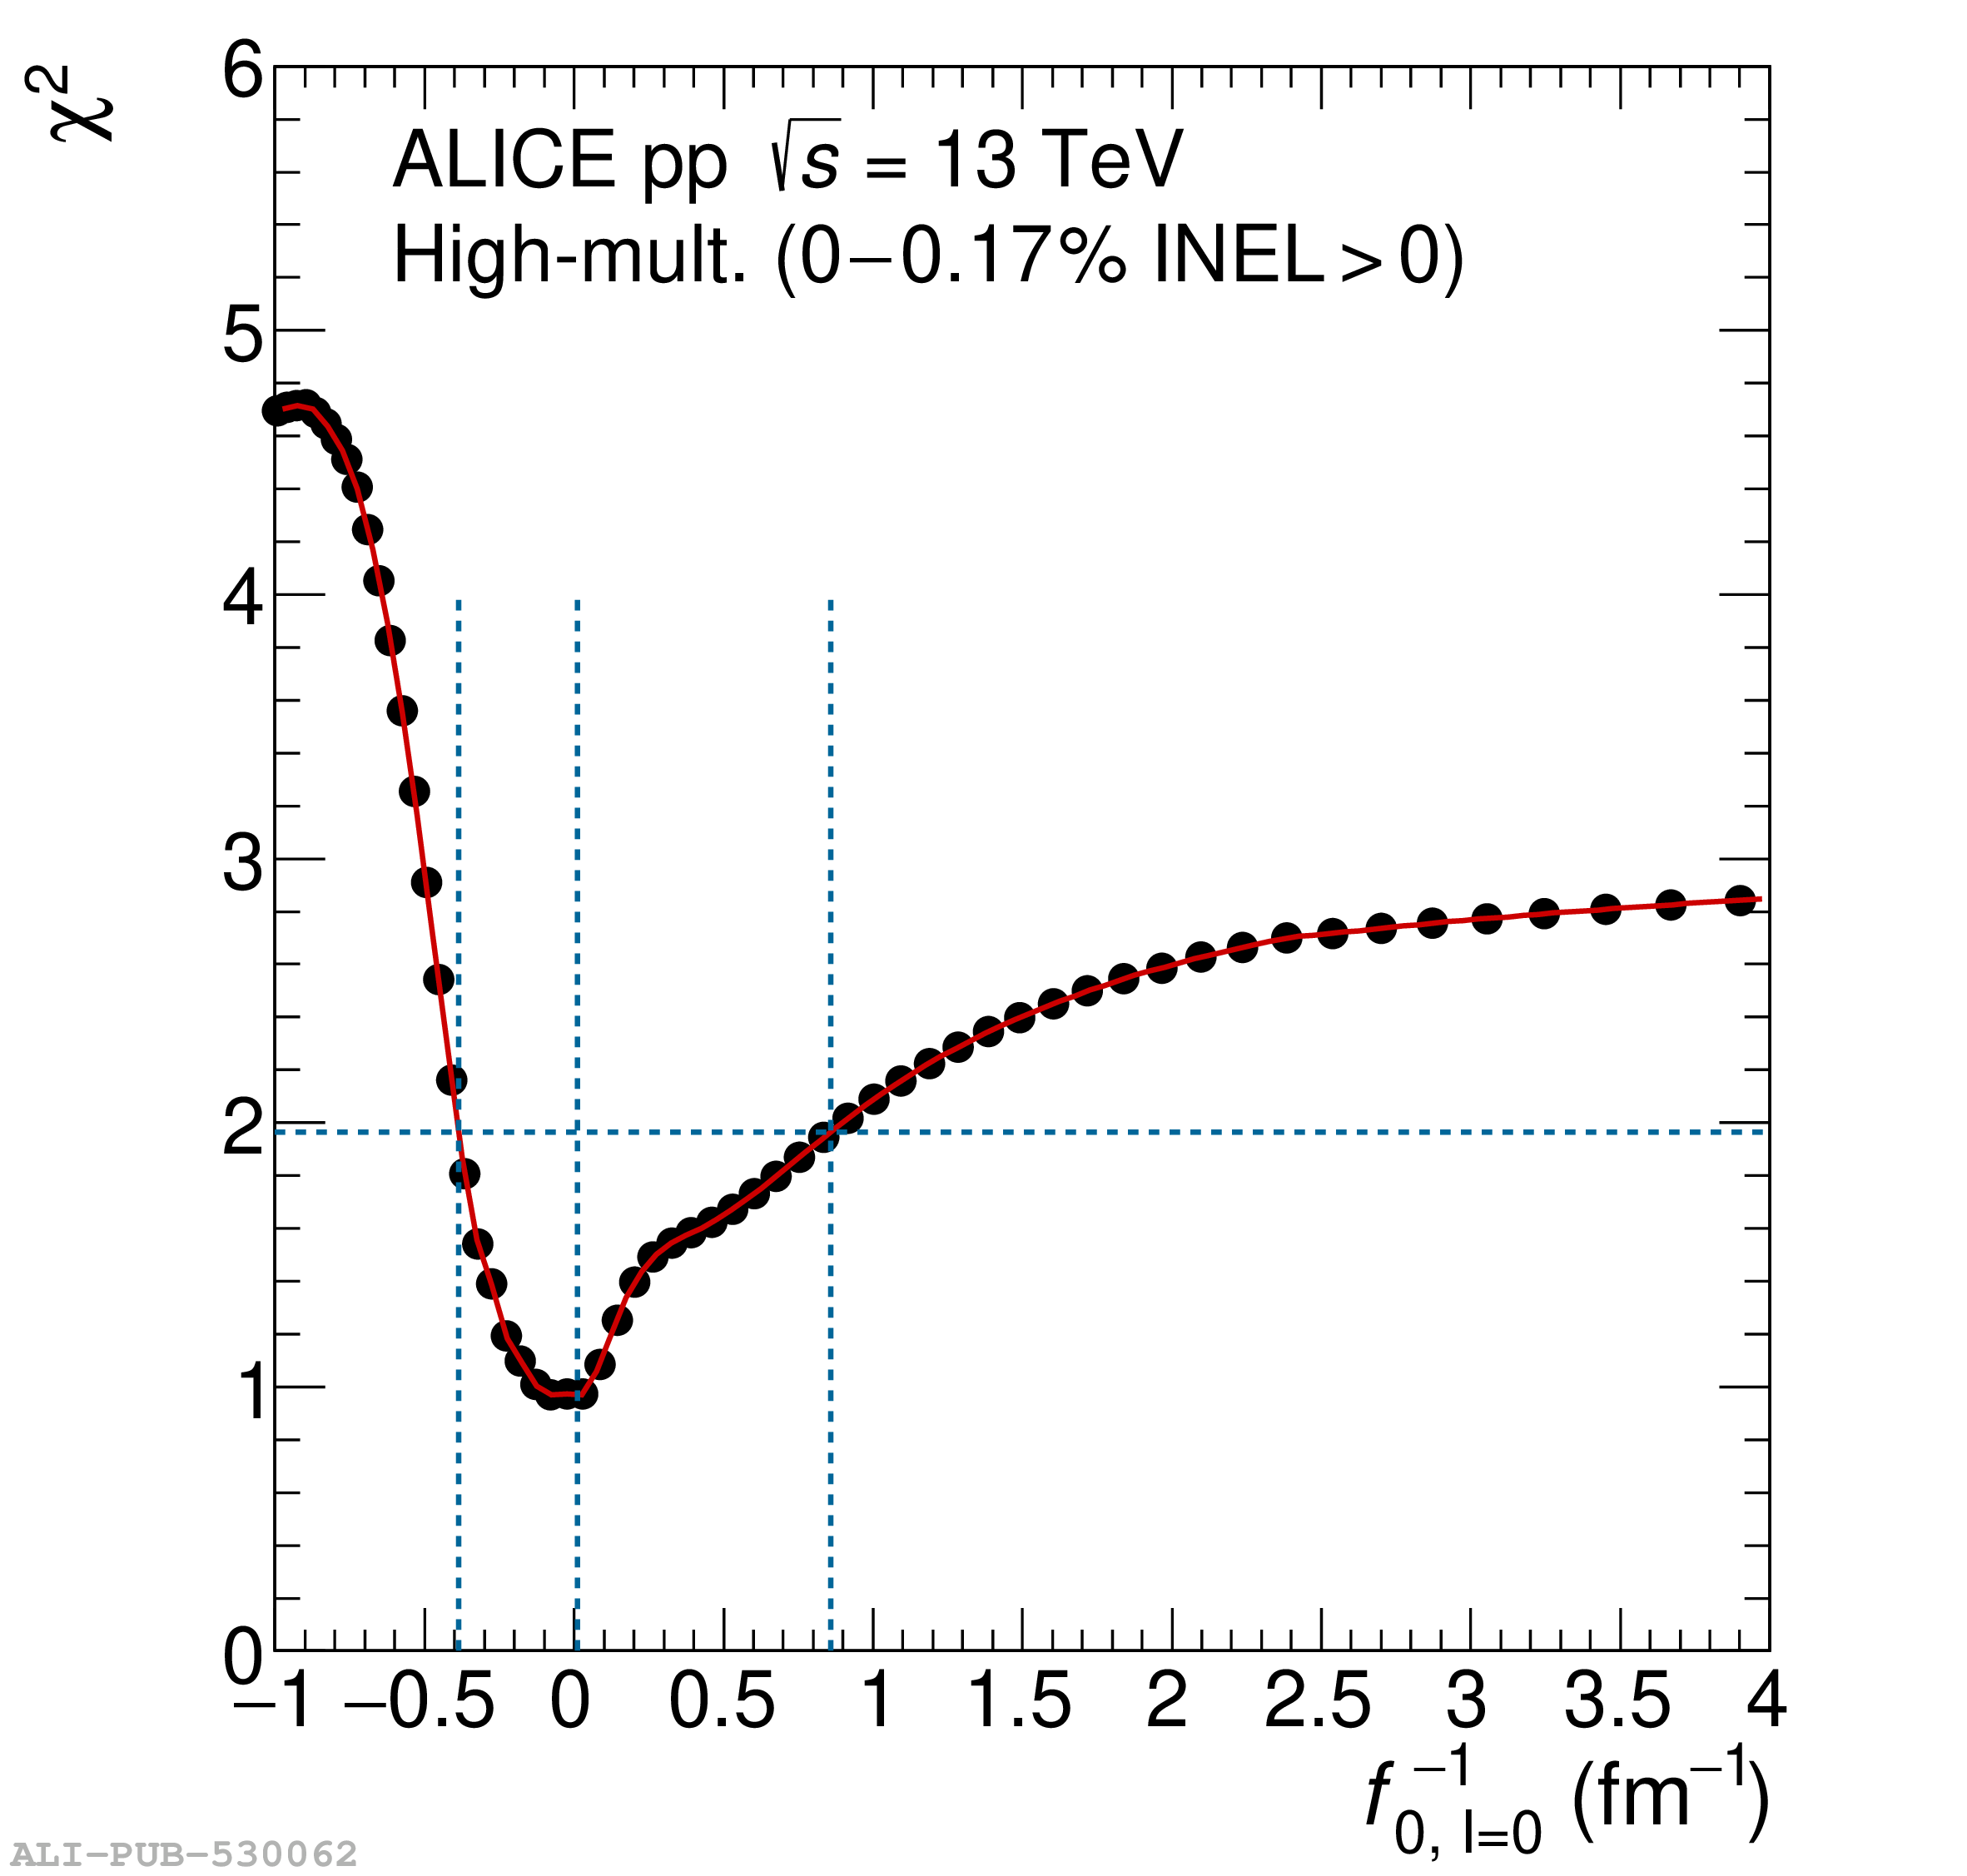 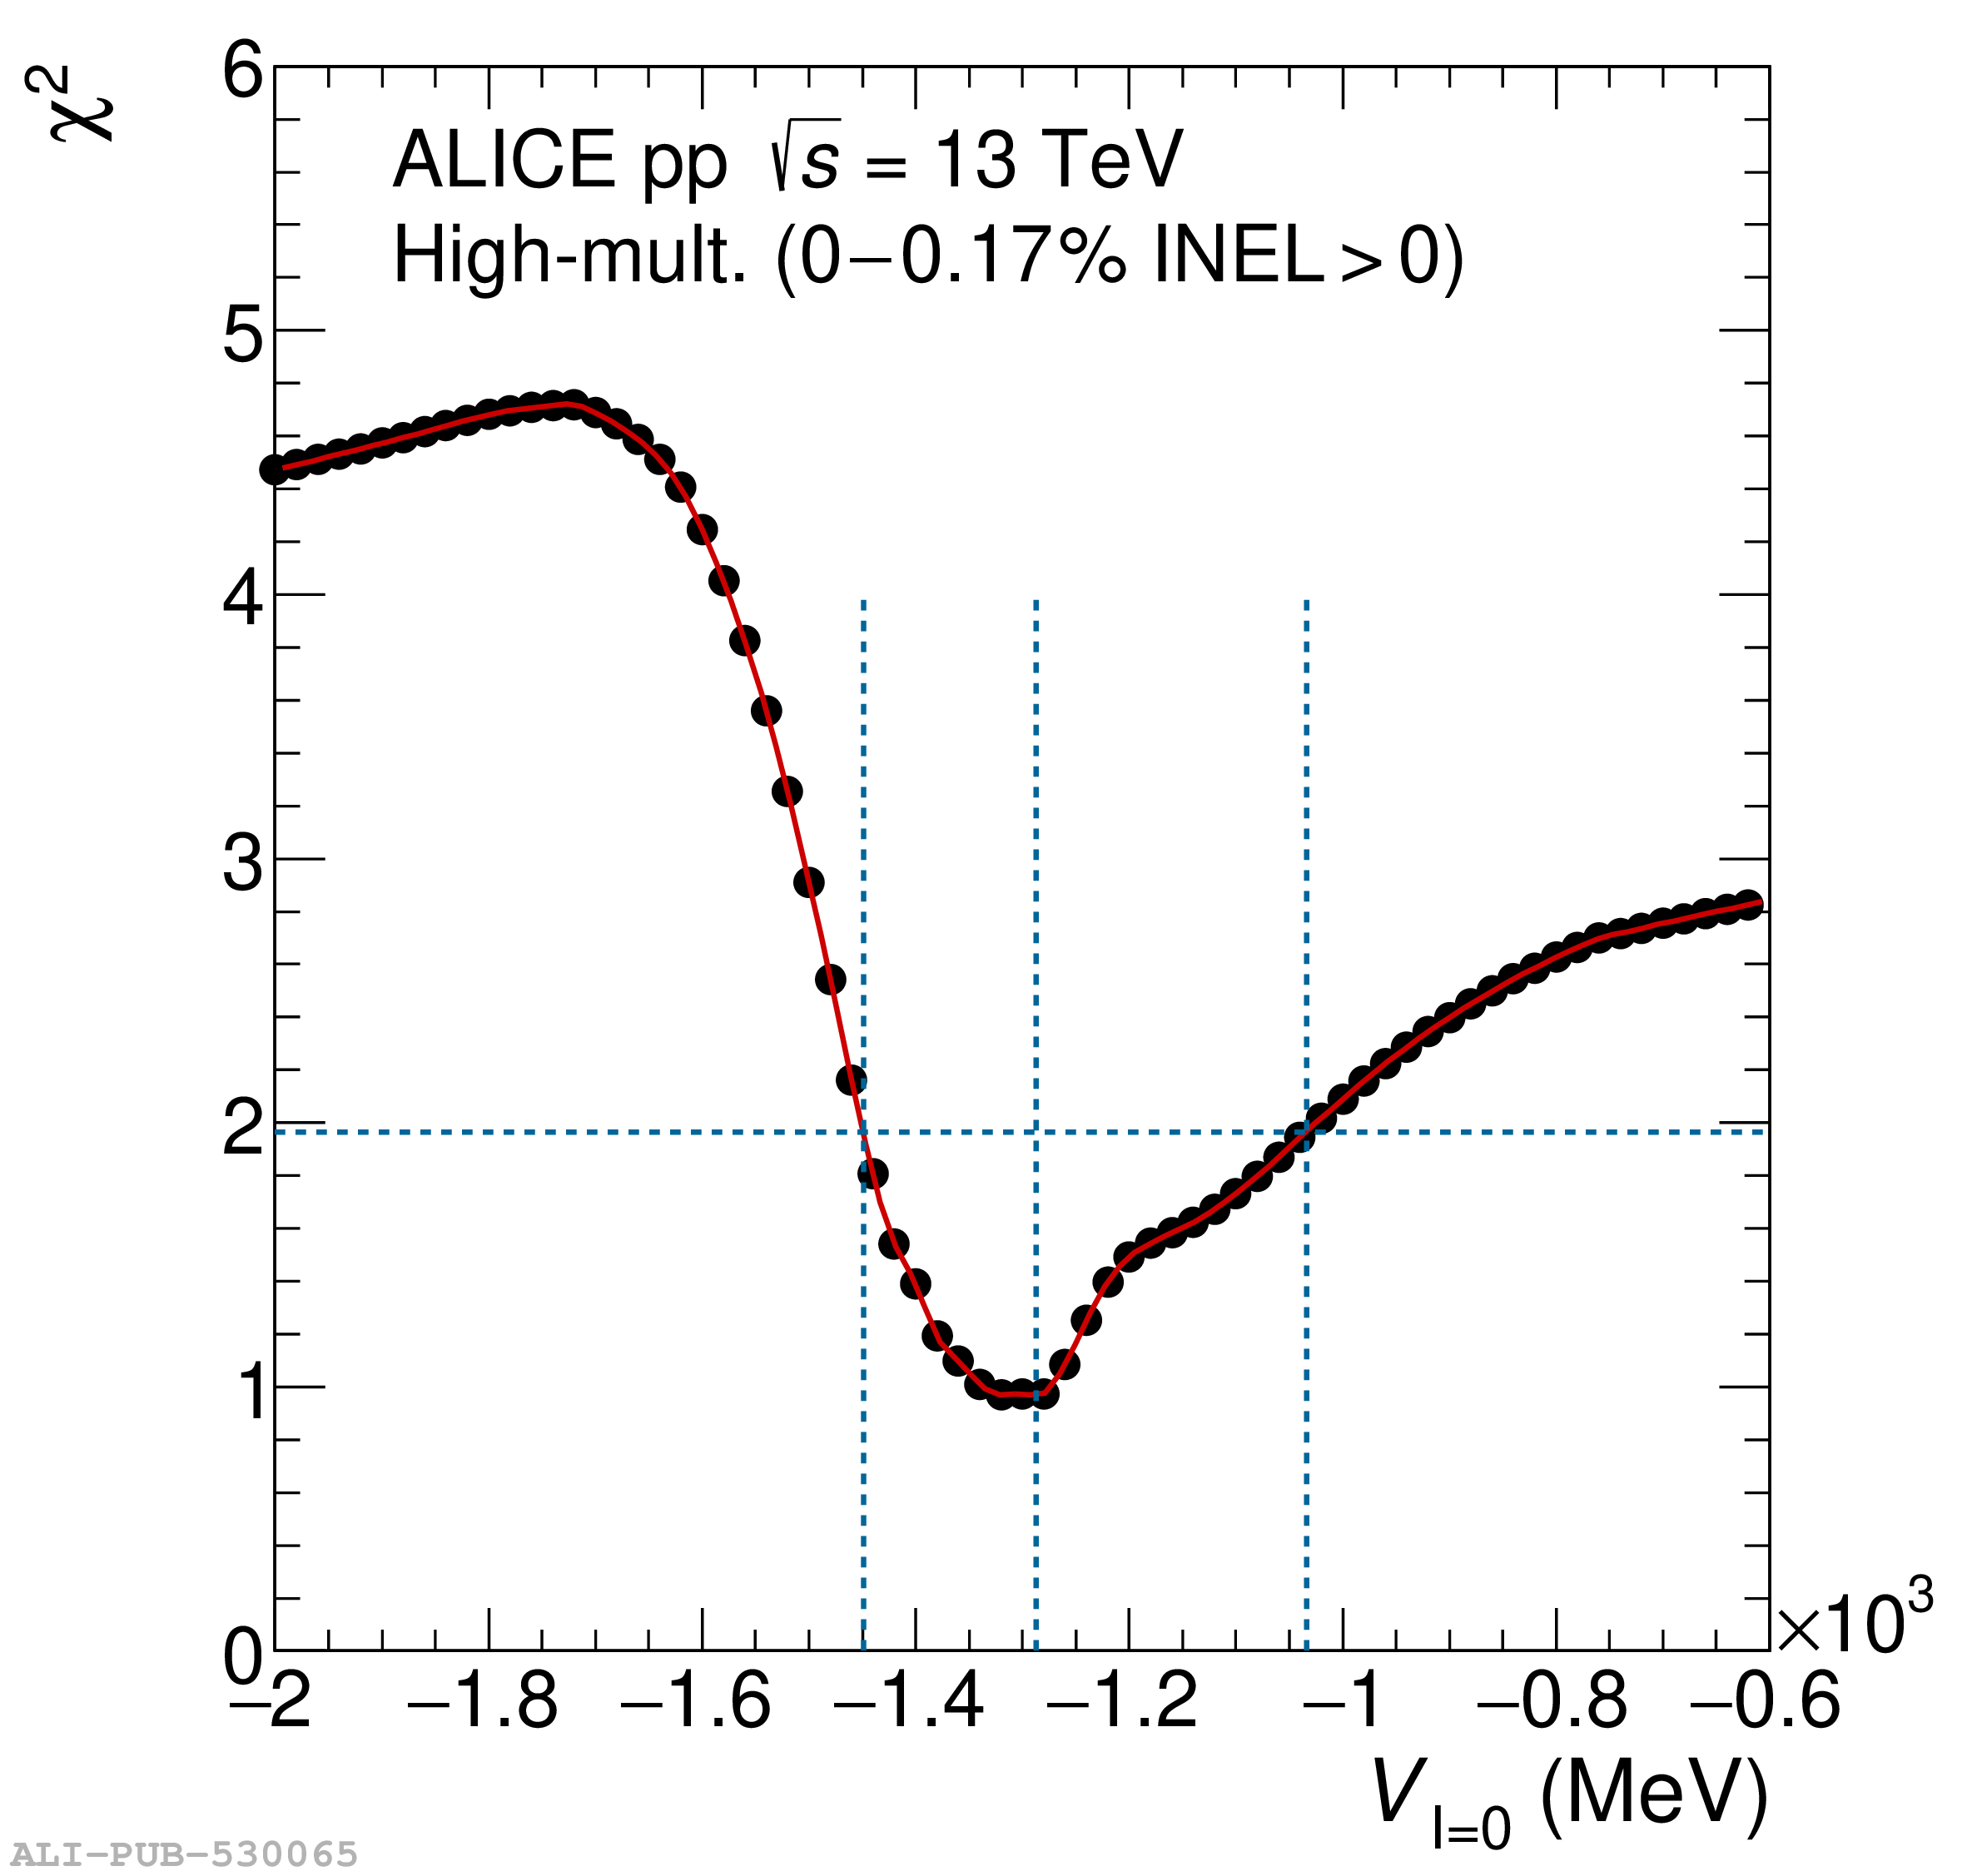 |