The measurement of the production of deuterons, tritons and $^{3}\mathrm{He}$ and their antiparticles in Pb-Pb collisions at $\sqrt{s_{\mathrm{NN}}} = 5.02$ TeV is presented in this article. The measurements are carried out at midrapidity ($|y| <~ $ 0.5) as a function of collision centrality using the ALICE detector. The $p_{\rm T}$-integrated yields, the coalescence parameters and the ratios to protons and antiprotons are reported and compared with nucleosynthesis models. The comparison of these results in different collision systems at different centre-of-mass collision energies reveals a suppression of nucleus production in small systems. In the Statistical Hadronisation Model framework, this can be explained by a small correlation volume where the baryon number is conserved, as already shown in previous fluctuation analyses. However, a different size of the correlation volume is required to describe the proton yields in the same data sets. The coalescence model can describe this suppression by the fact that the wave functions of the nuclei are large and the fireball size starts to become comparable and even much smaller than the actual nucleus at low multiplicities.
Phys. Rev. C 107 (2023) 064904
HEP Data
e-Print: arXiv:2211.14015 | PDF | inSPIRE
CERN-EP-2022-263
Figure group
Figure 1
Specific energy loss of charged tracks in the TPC vs.\,rigidity ($p/z$) for Pb--Pb collisions at $\mathbf{\sqrt{{\textit s}_{\rm NN}}} = 5.02$ TeV. The dashed lines represent parameterisations of the Bethe--Bloch curve. Particles lighter than deuterons have been removed by applying a selection in the d$E$/d$x$ vs. $p/z$ plane that corresponds to the upper edge (3$\sigma$) of the proton band such that only nuclei are visible. | 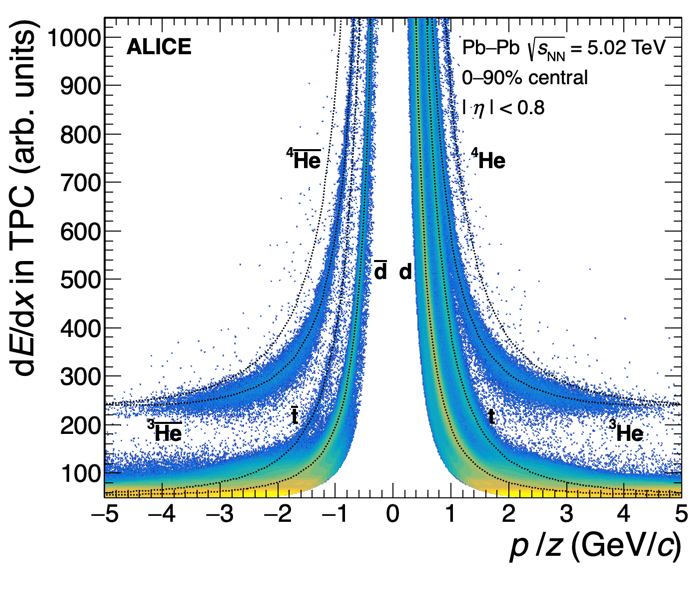 |
Figure 2
Fit to the measured squared mass to extract the antideuteron signal in 4.4 $<$ \pt $<$ 5.0 GeV/$c$ (left) and the antitriton signal in 2.0 $<$ \pt $<$ 2.4 GeV/$c$ (right). The red dashed line shows the background, the solid blue line the combined fit to the data and the green dashed line the signal only. | 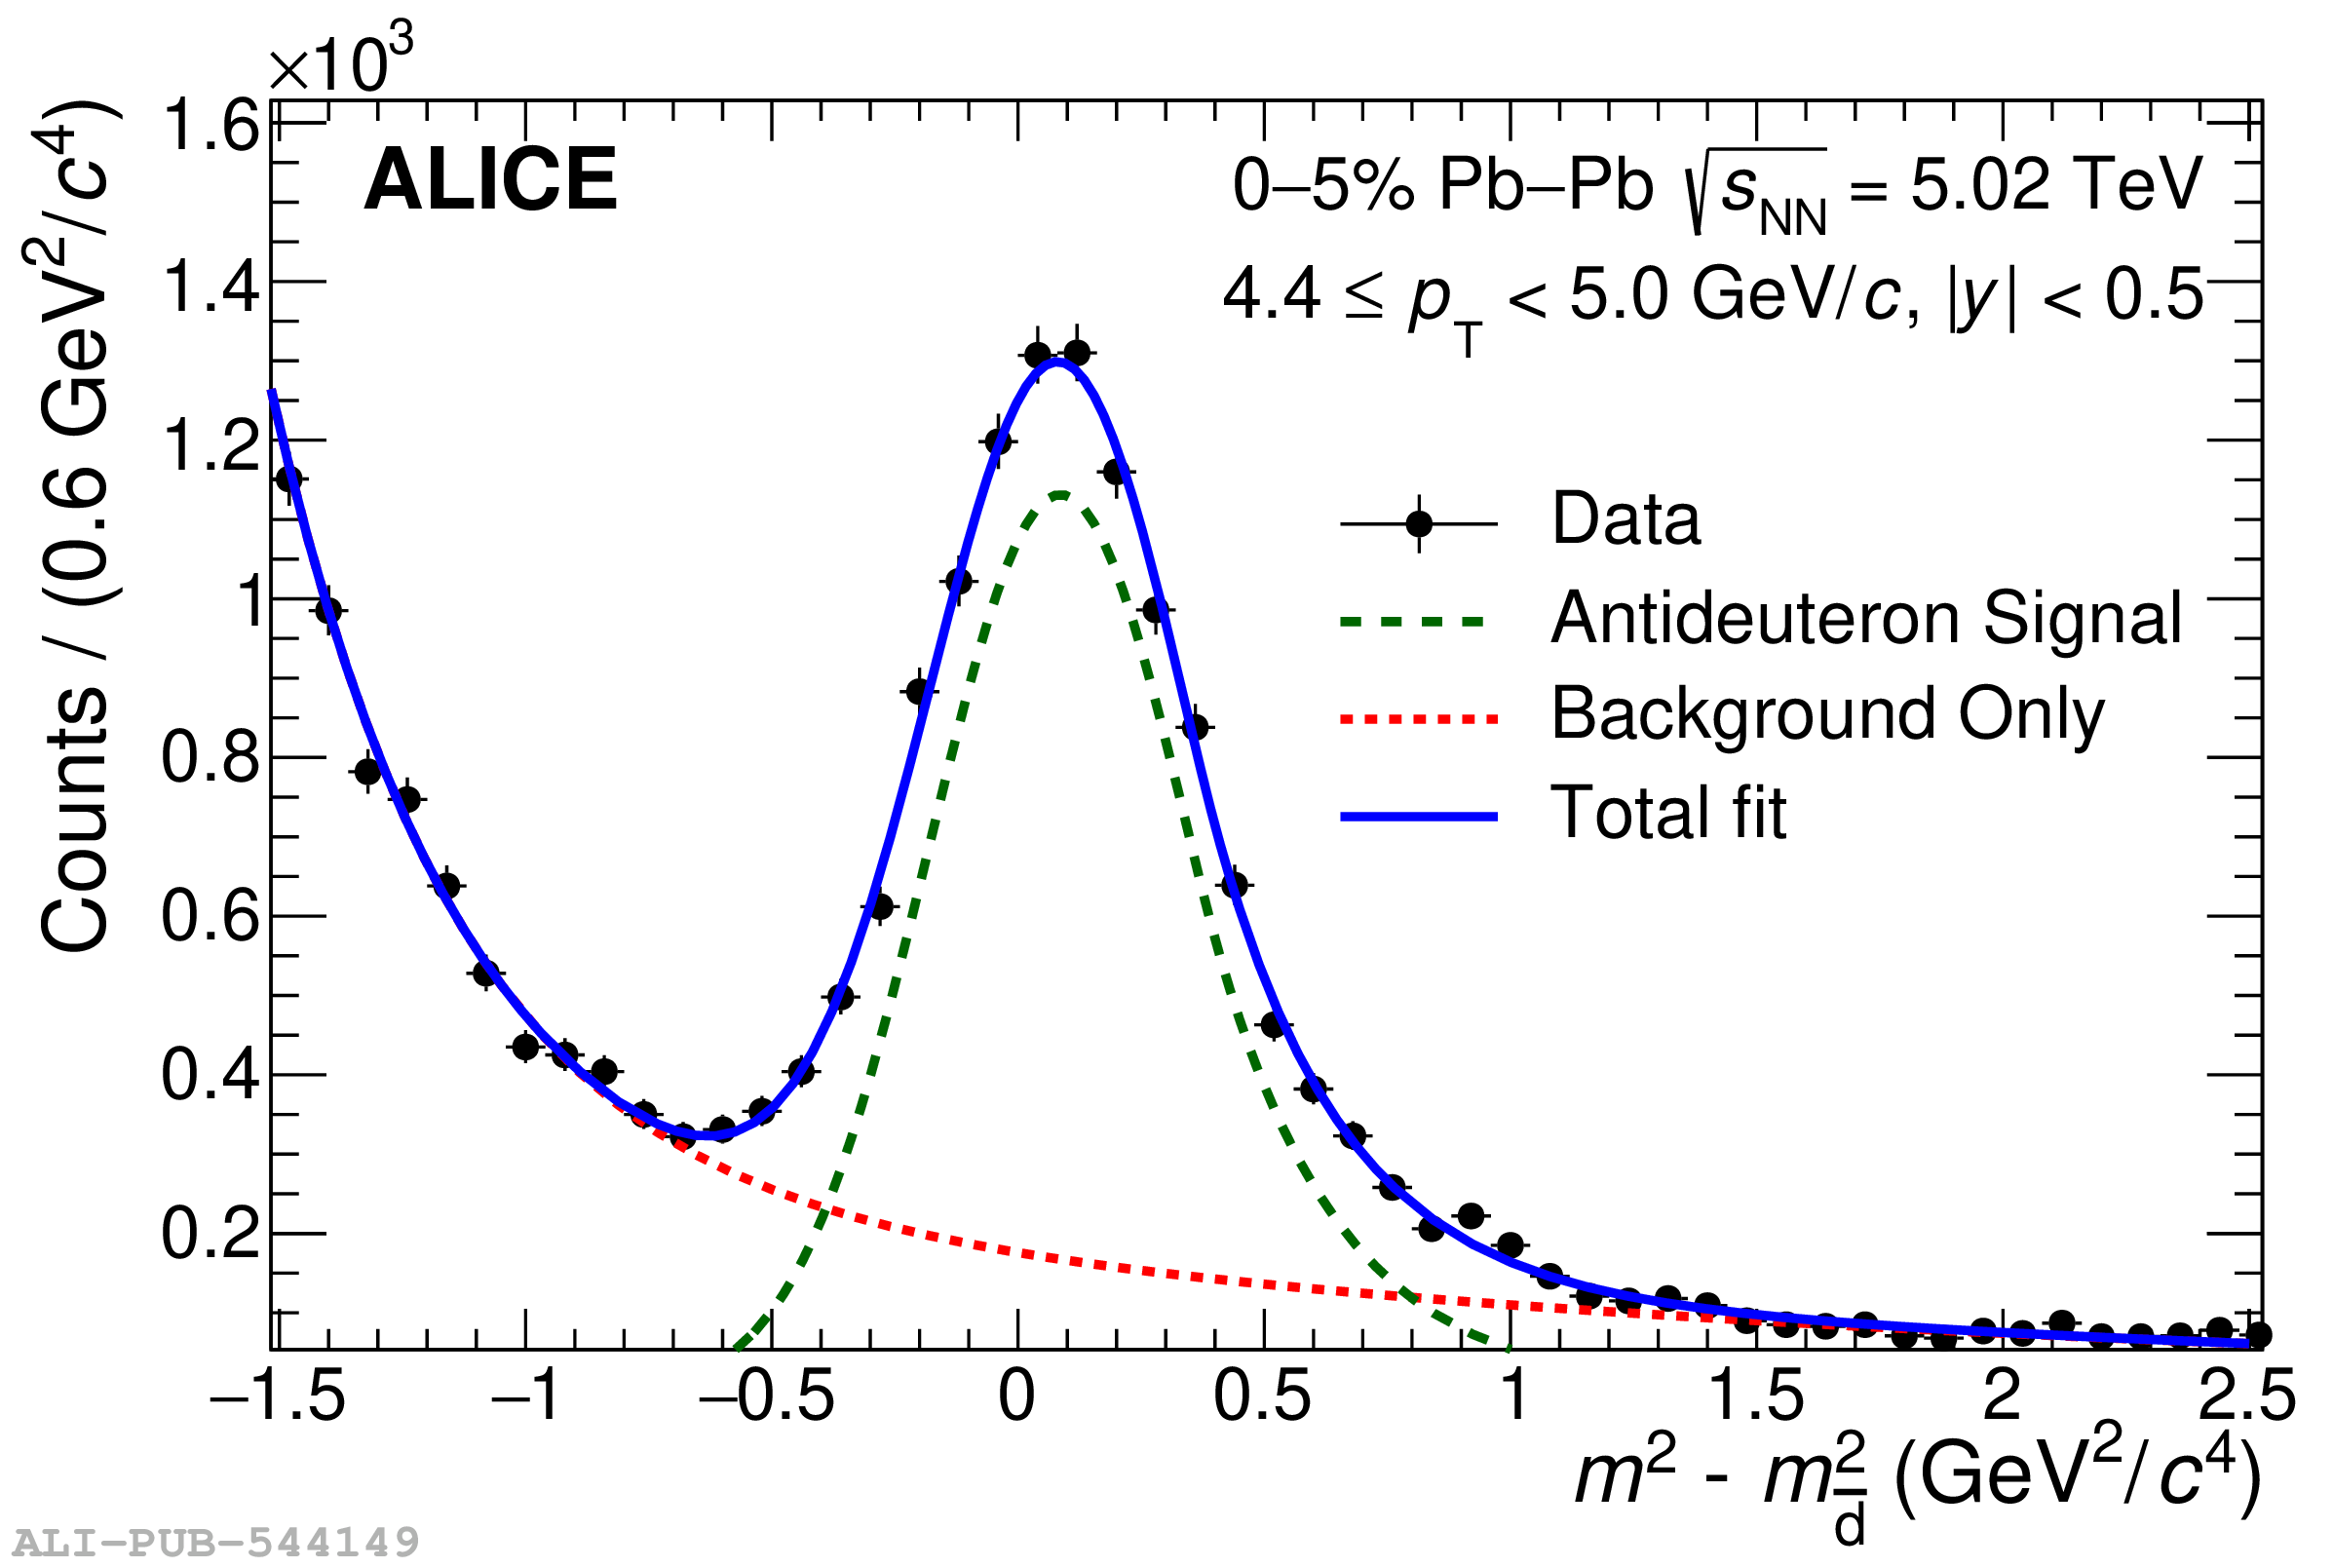 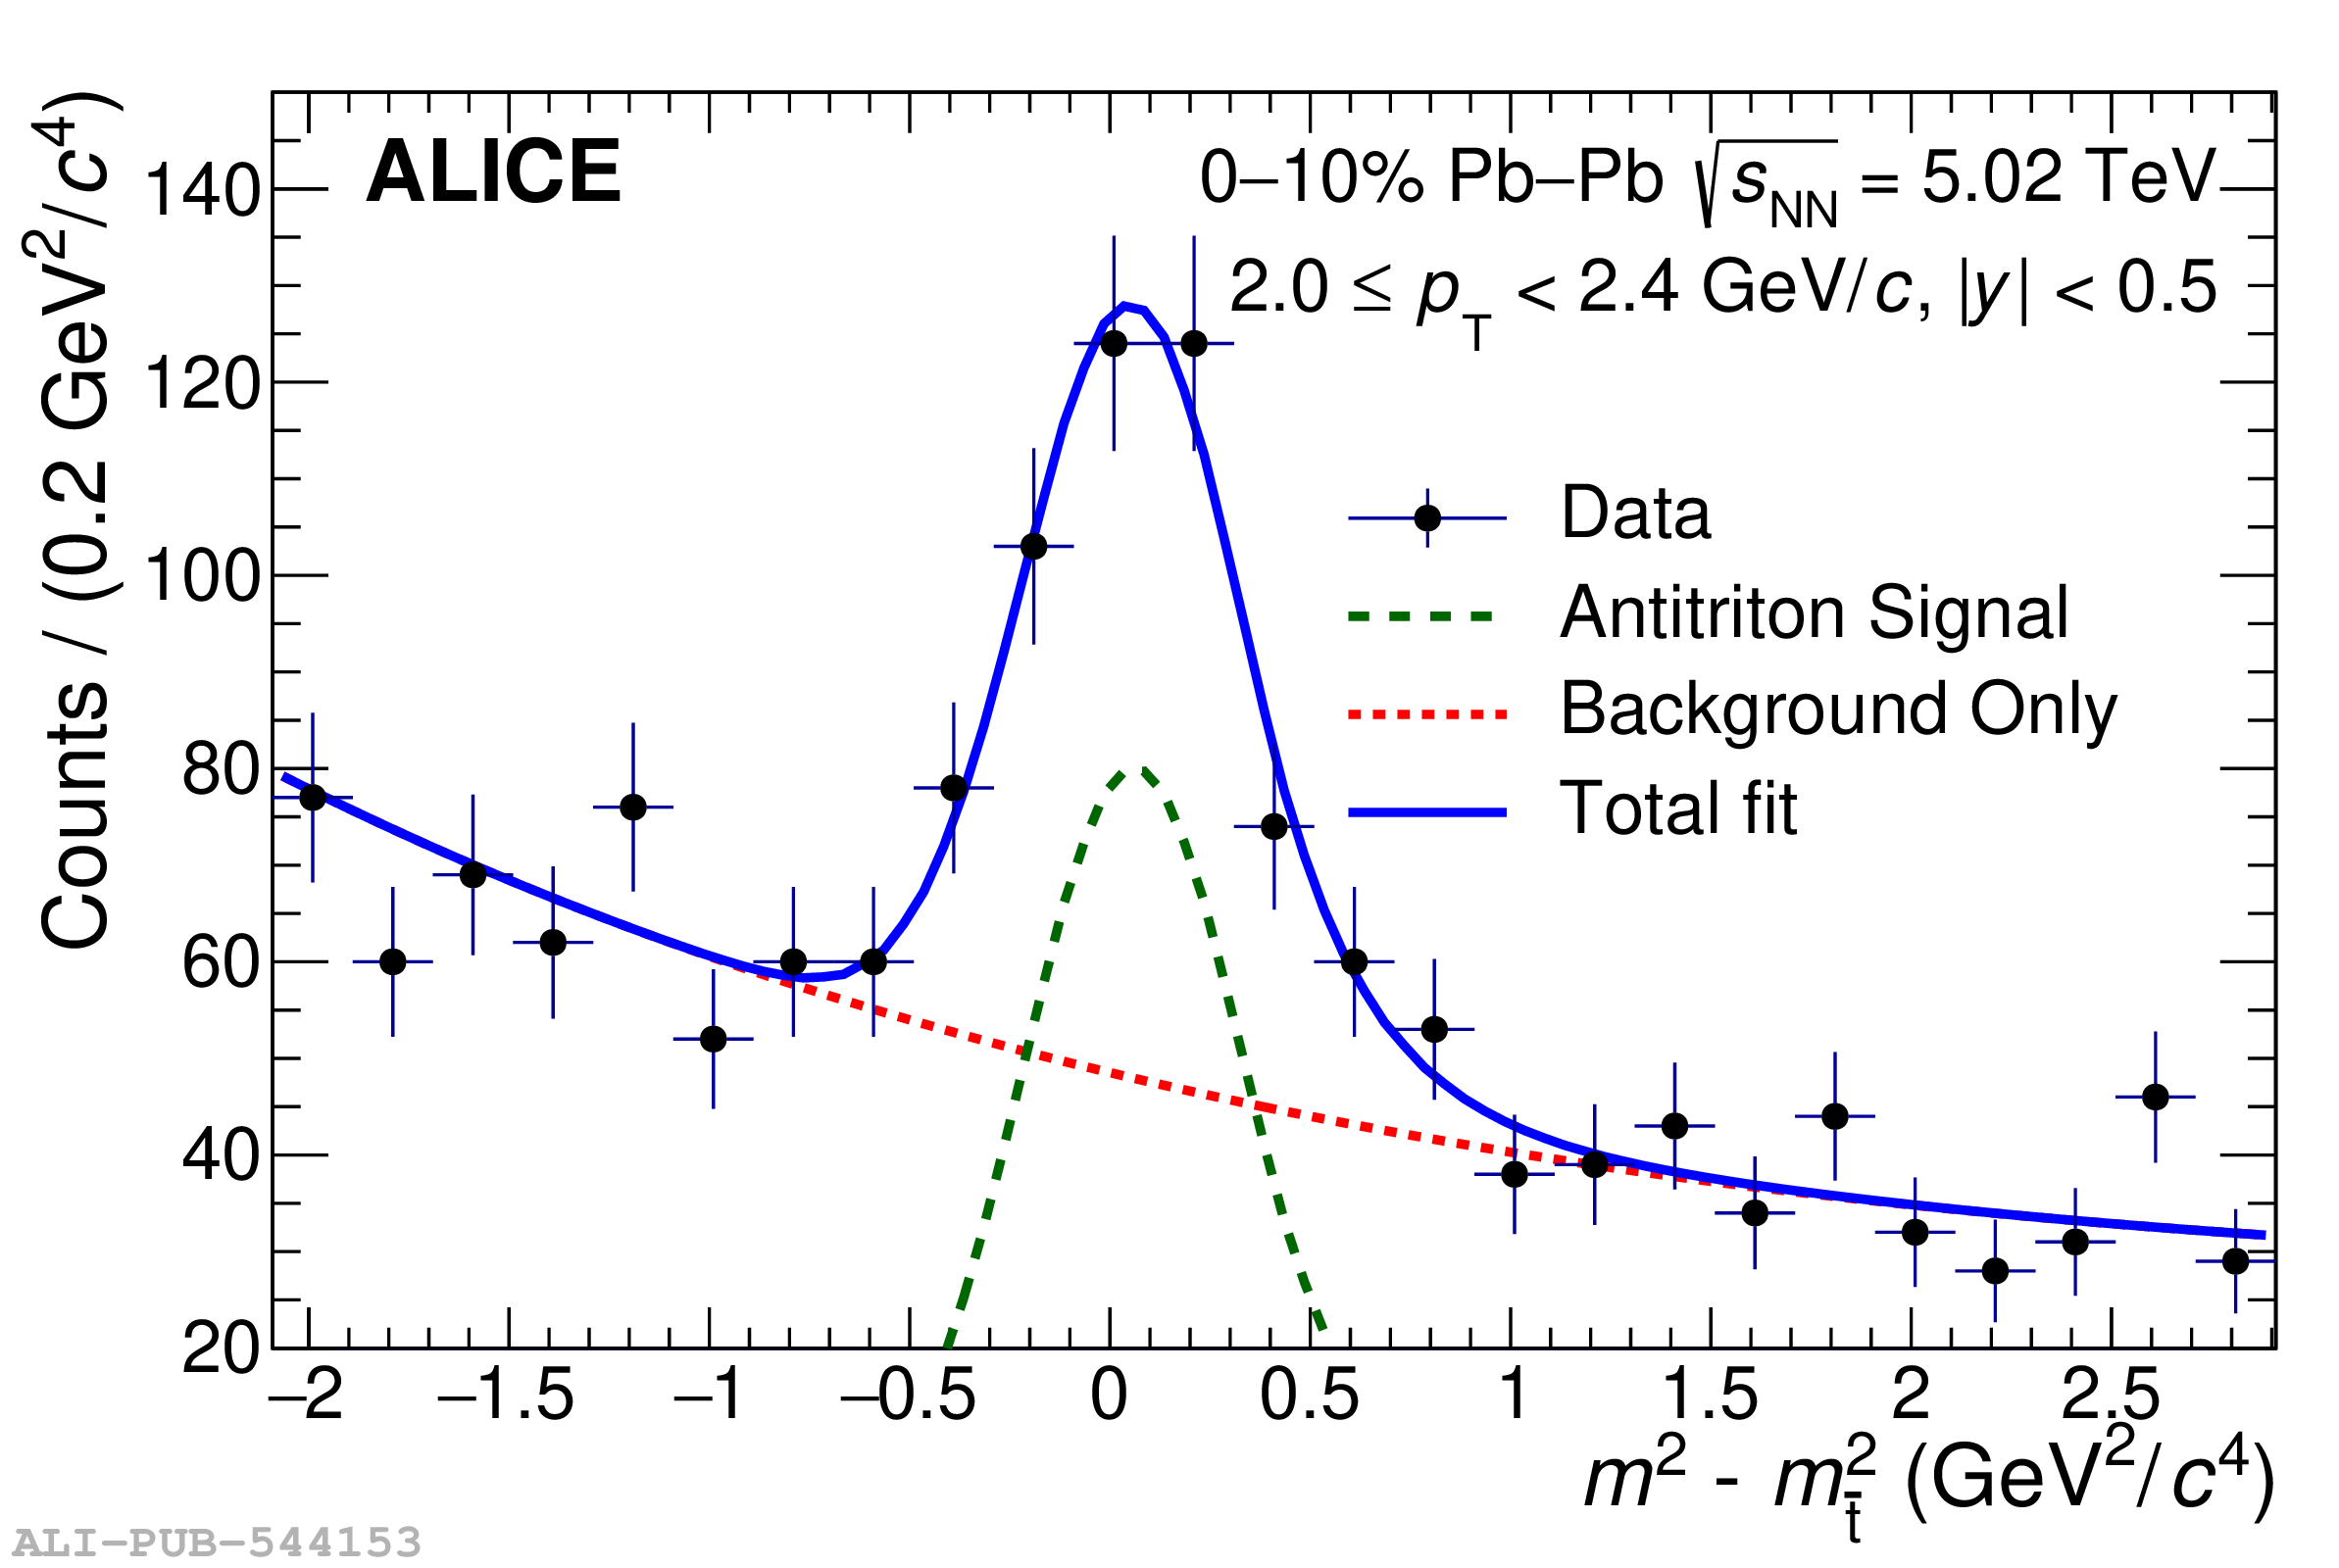 |
Figure 4
(Anti)deuteron, (anti)\Hee and (anti)\HH spectra measured in Pb--Pb collisions at $\mathbf{\sqrt{{\textit s}_{\rm NN}}} = 5.02$ TeV for different centrality classes reported with different colours The boxes represent the systematic uncertainties, while the vertical lines are the statistical ones. The dashed lines represent the individual Blast-Wave fits to the spectra. The Blast-Wave fits of (anti)\Hee are used on (anti)\HH spectra as well to show the trend. | 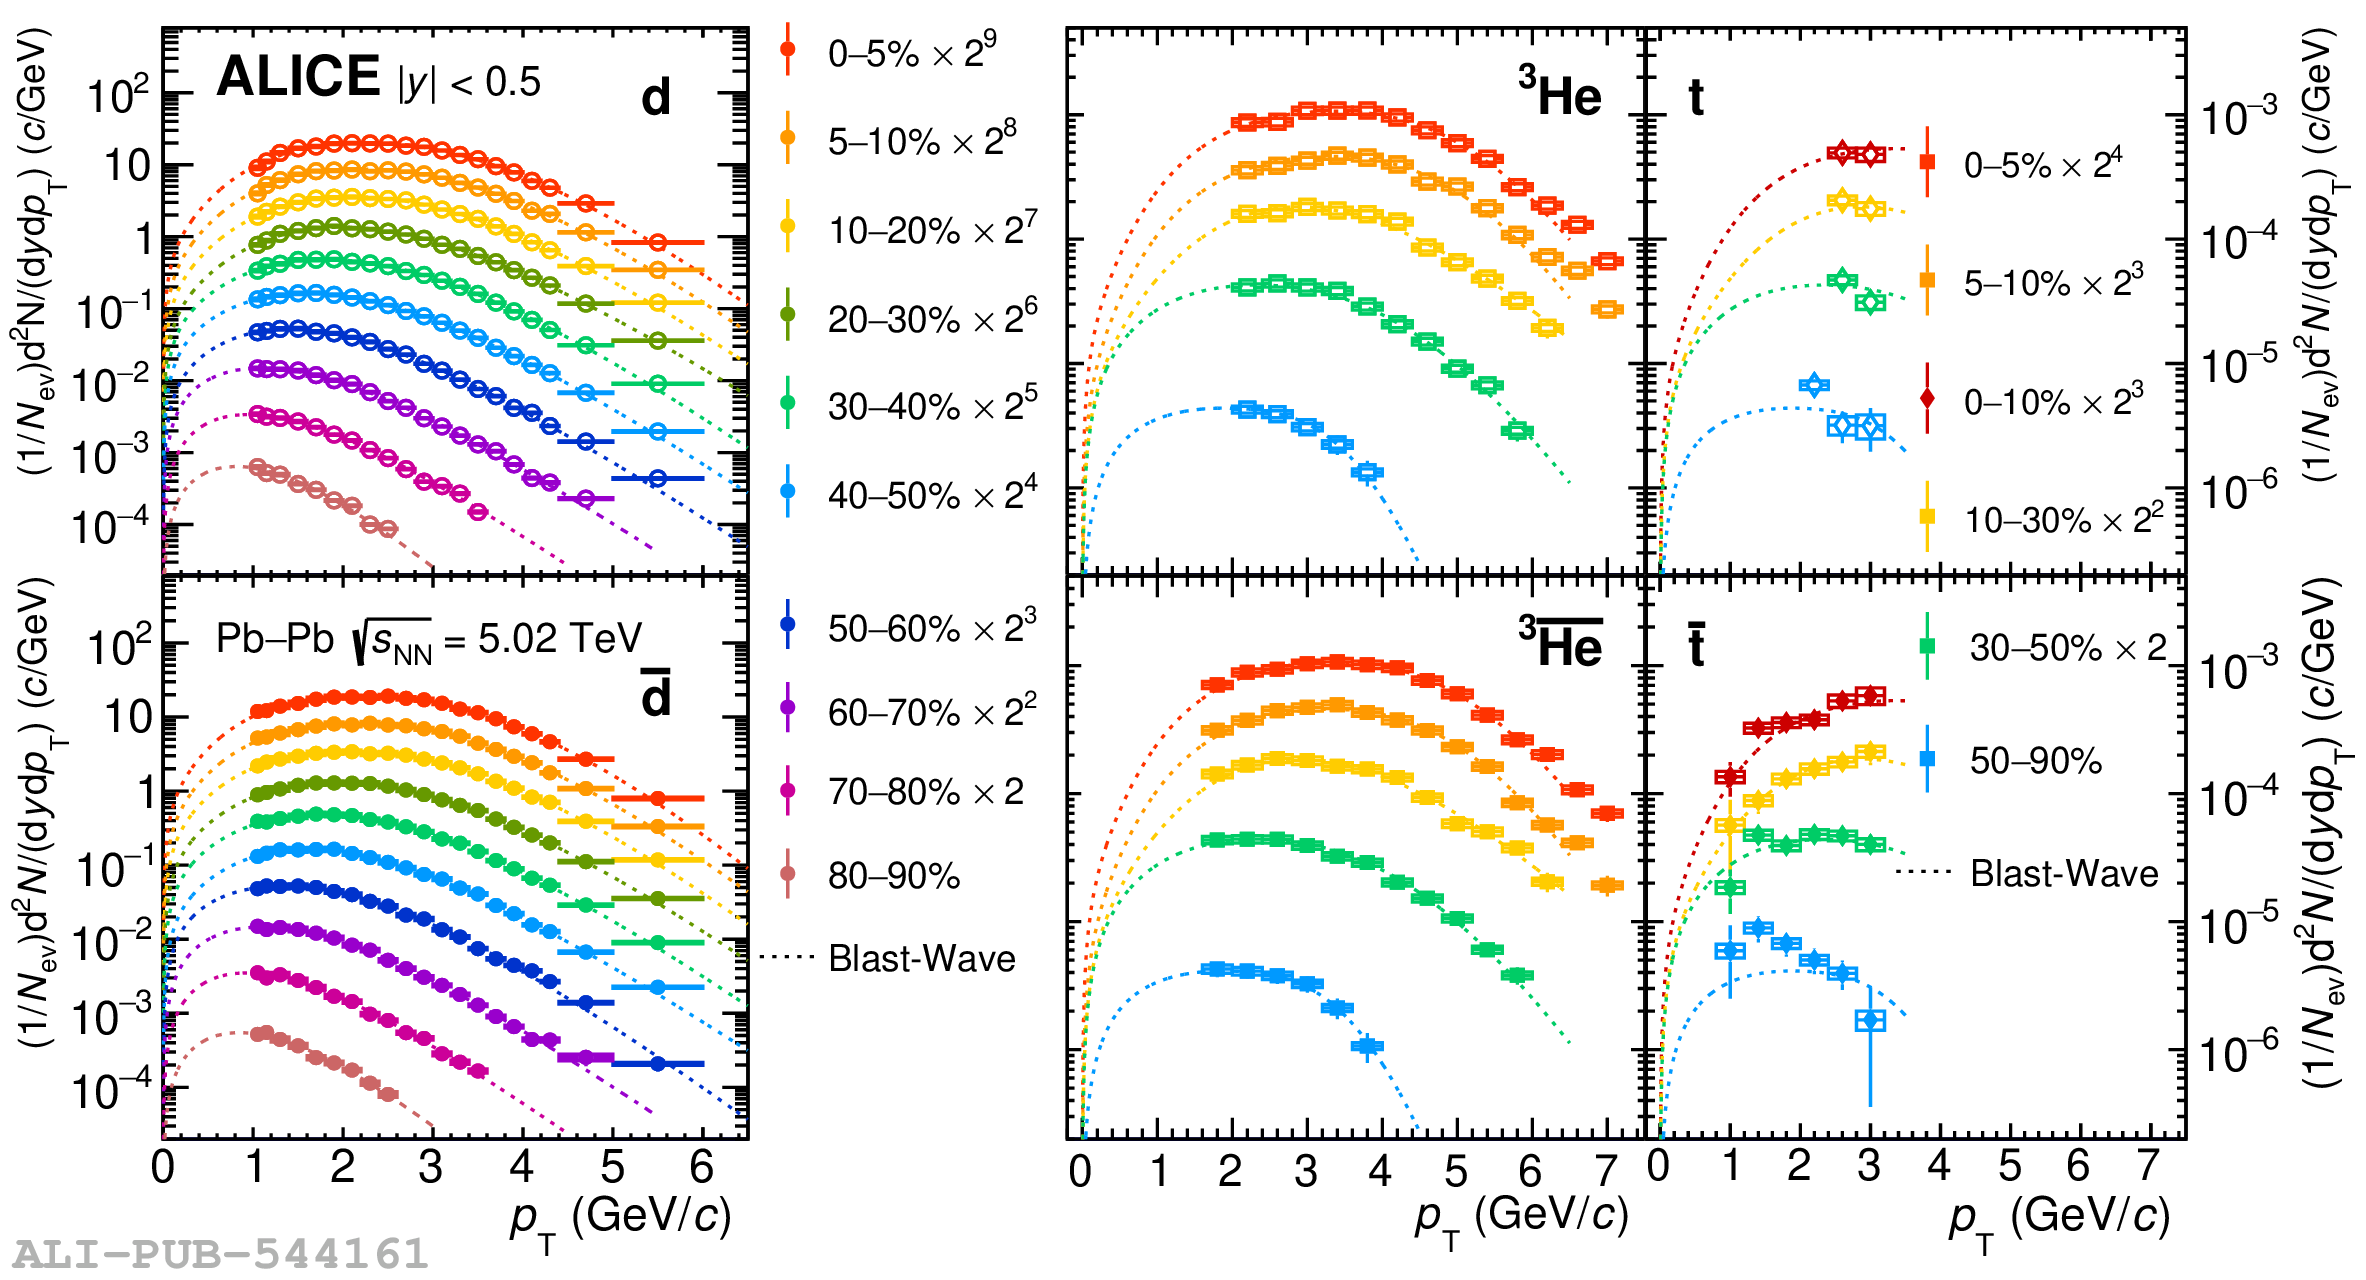 |
Figure 5
Coalescence parameters $B_2$ (left) and $B_3$ (right) measured for antinuclei in Pb--Pb collisions at $\mathbf{\sqrt{{\textit s}_{\rm NN}}} = 5.02$ TeV as a function of the transverse momentum scaled by the mass number. Compatible results are obtained for the nuclei. Each colour corresponds to a different centrality class. The boxes represent the systematic uncertainties, while the vertical lines are the statistical ones. See the text for details. | 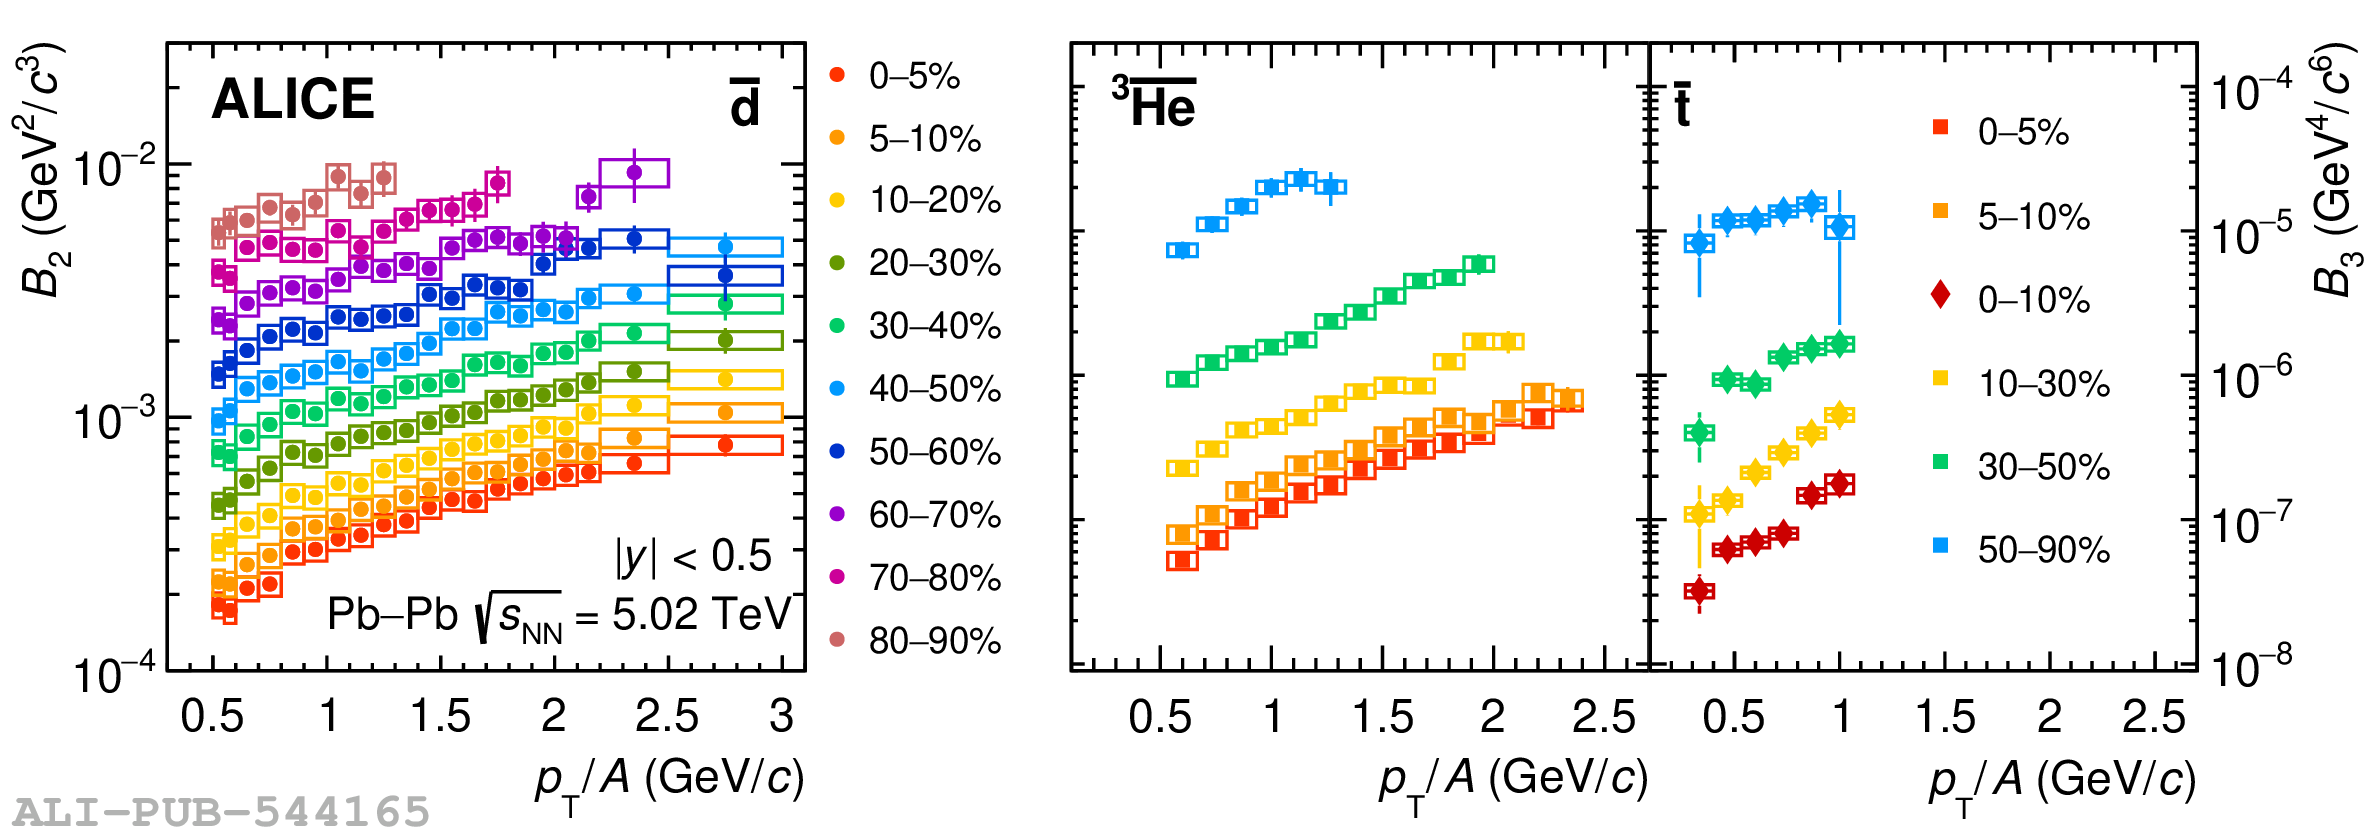 |
Figure 6
Left: ratios of transverse momentum spectra of \antiHH and \antiHee in different centrality intervals. Right: multiplicity dependence of the average \antiHH/\antiHee ratio compared with the coalescence model expectations (two-body coalescence in orange and three-body coalescence in blue) . The open boxes represent the total systematic uncertainties, while the vertical lines are the statistical ones. | 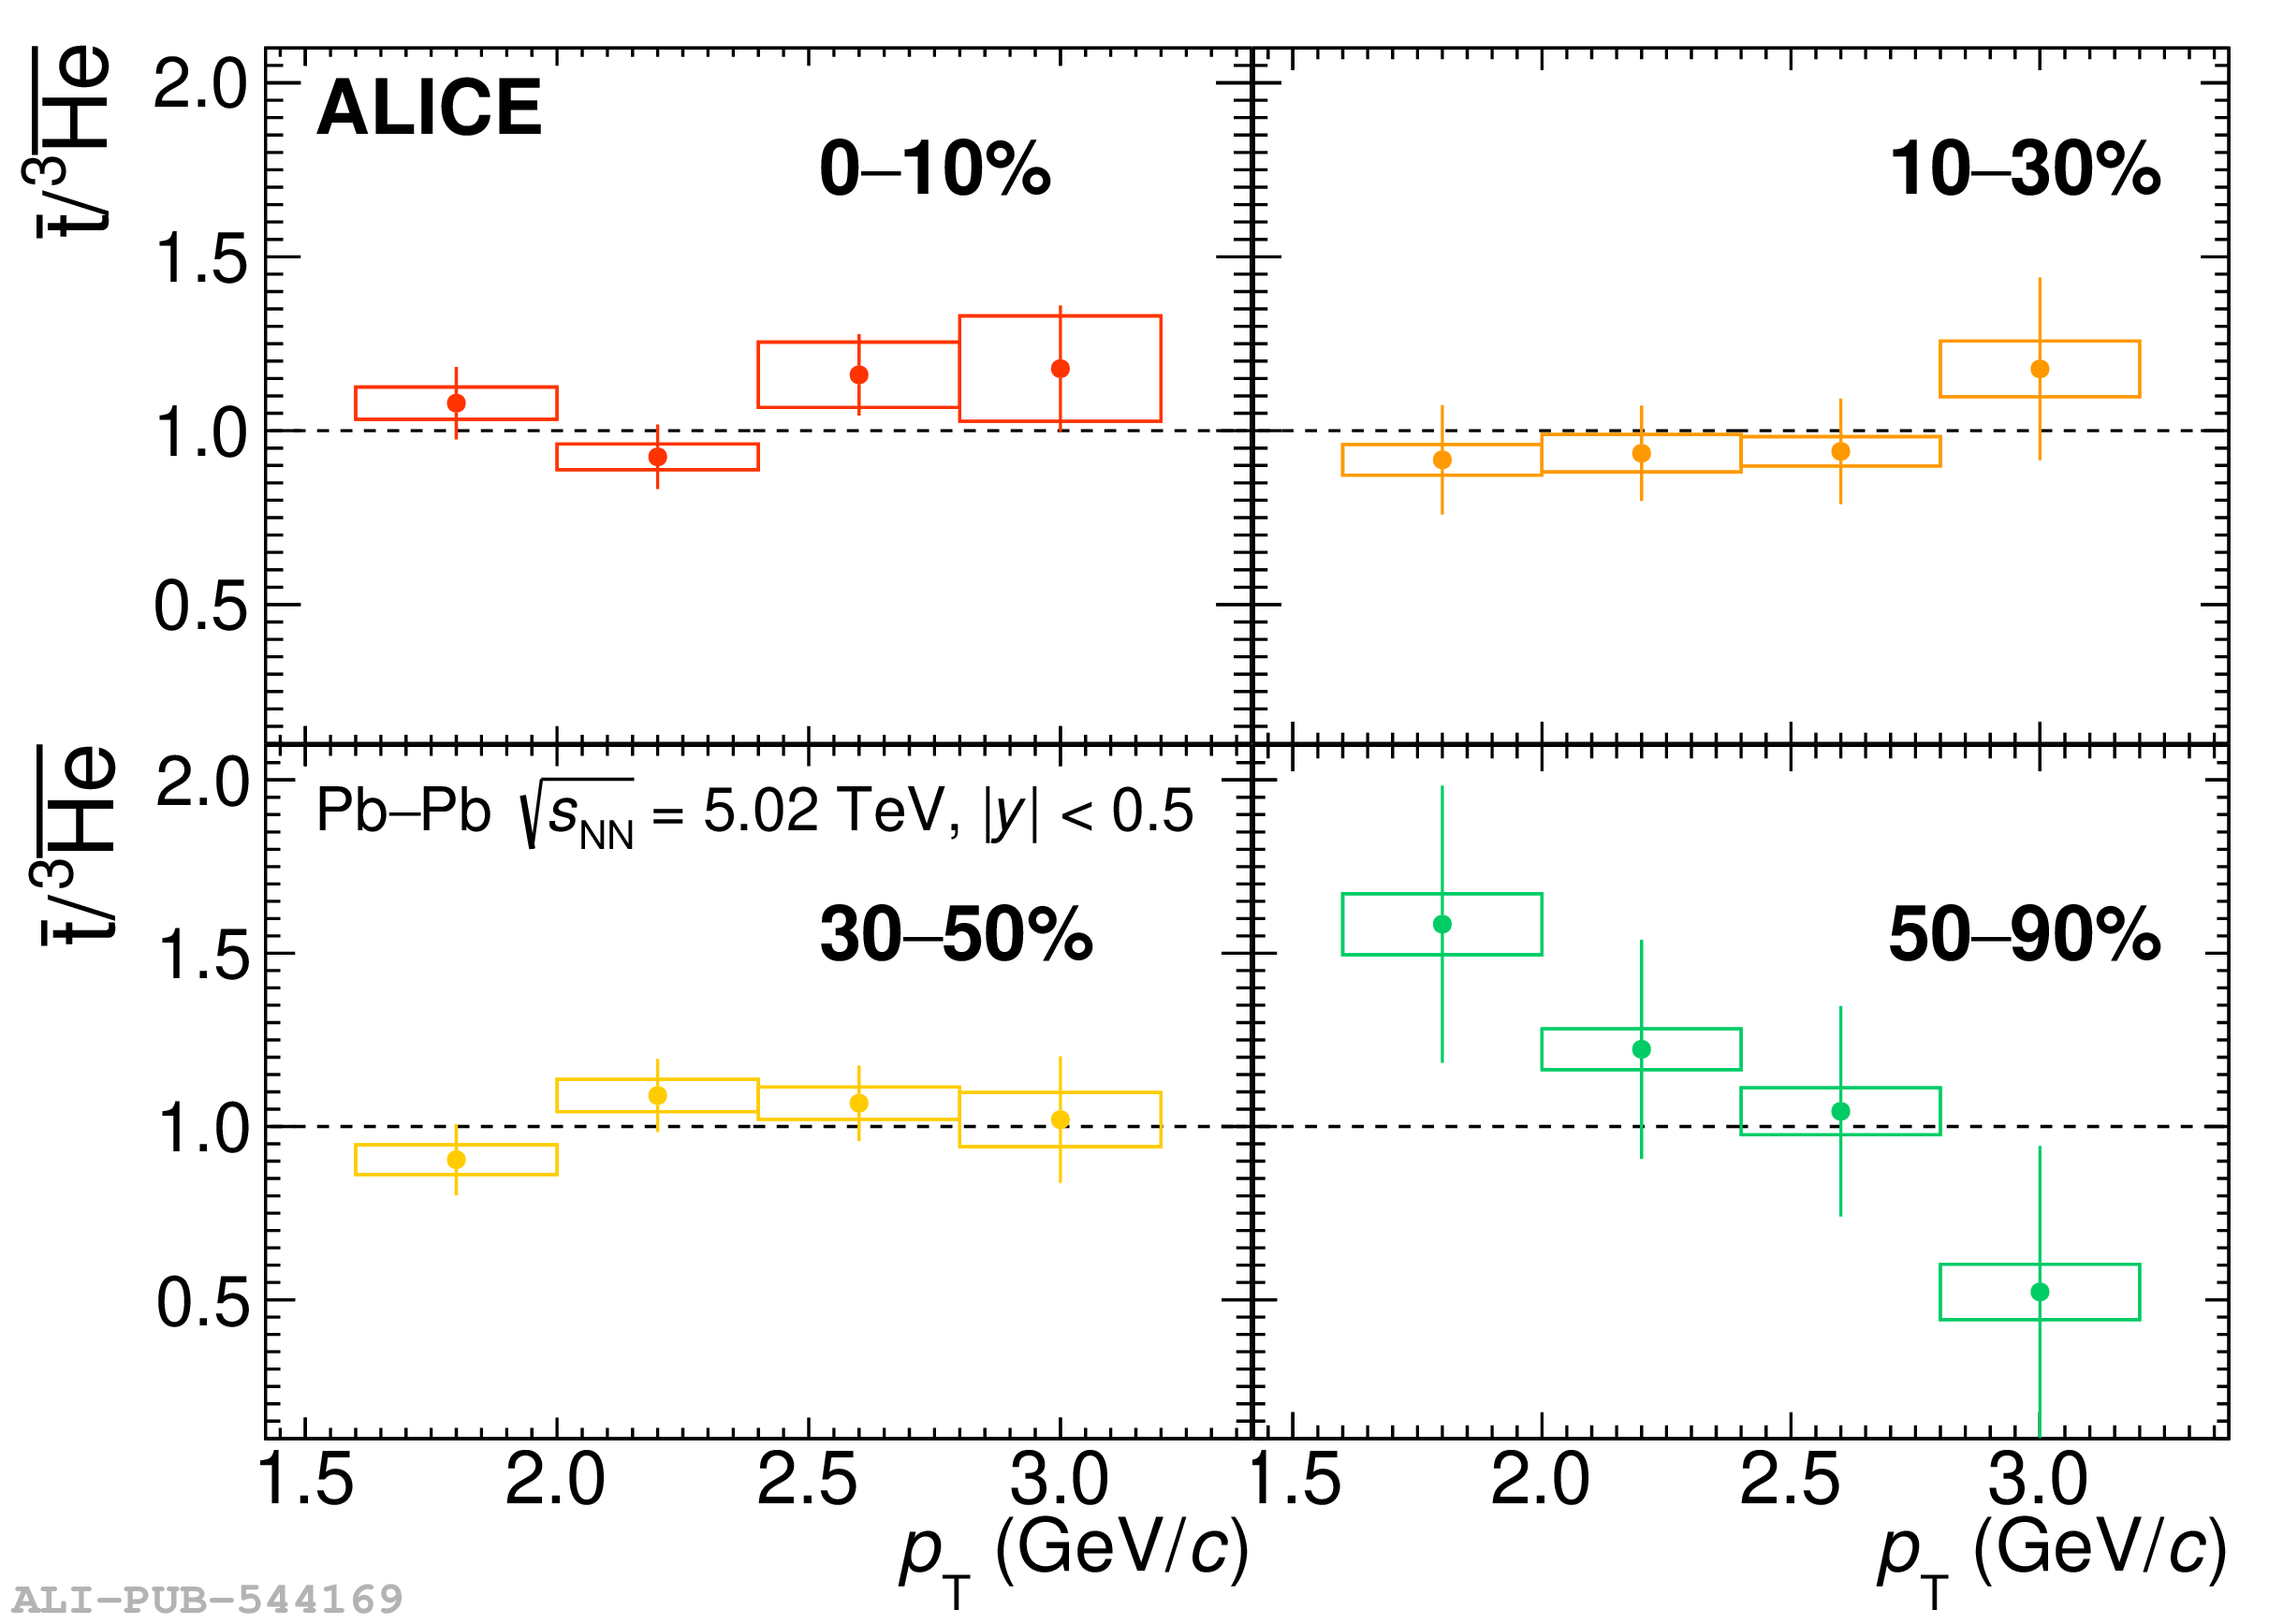 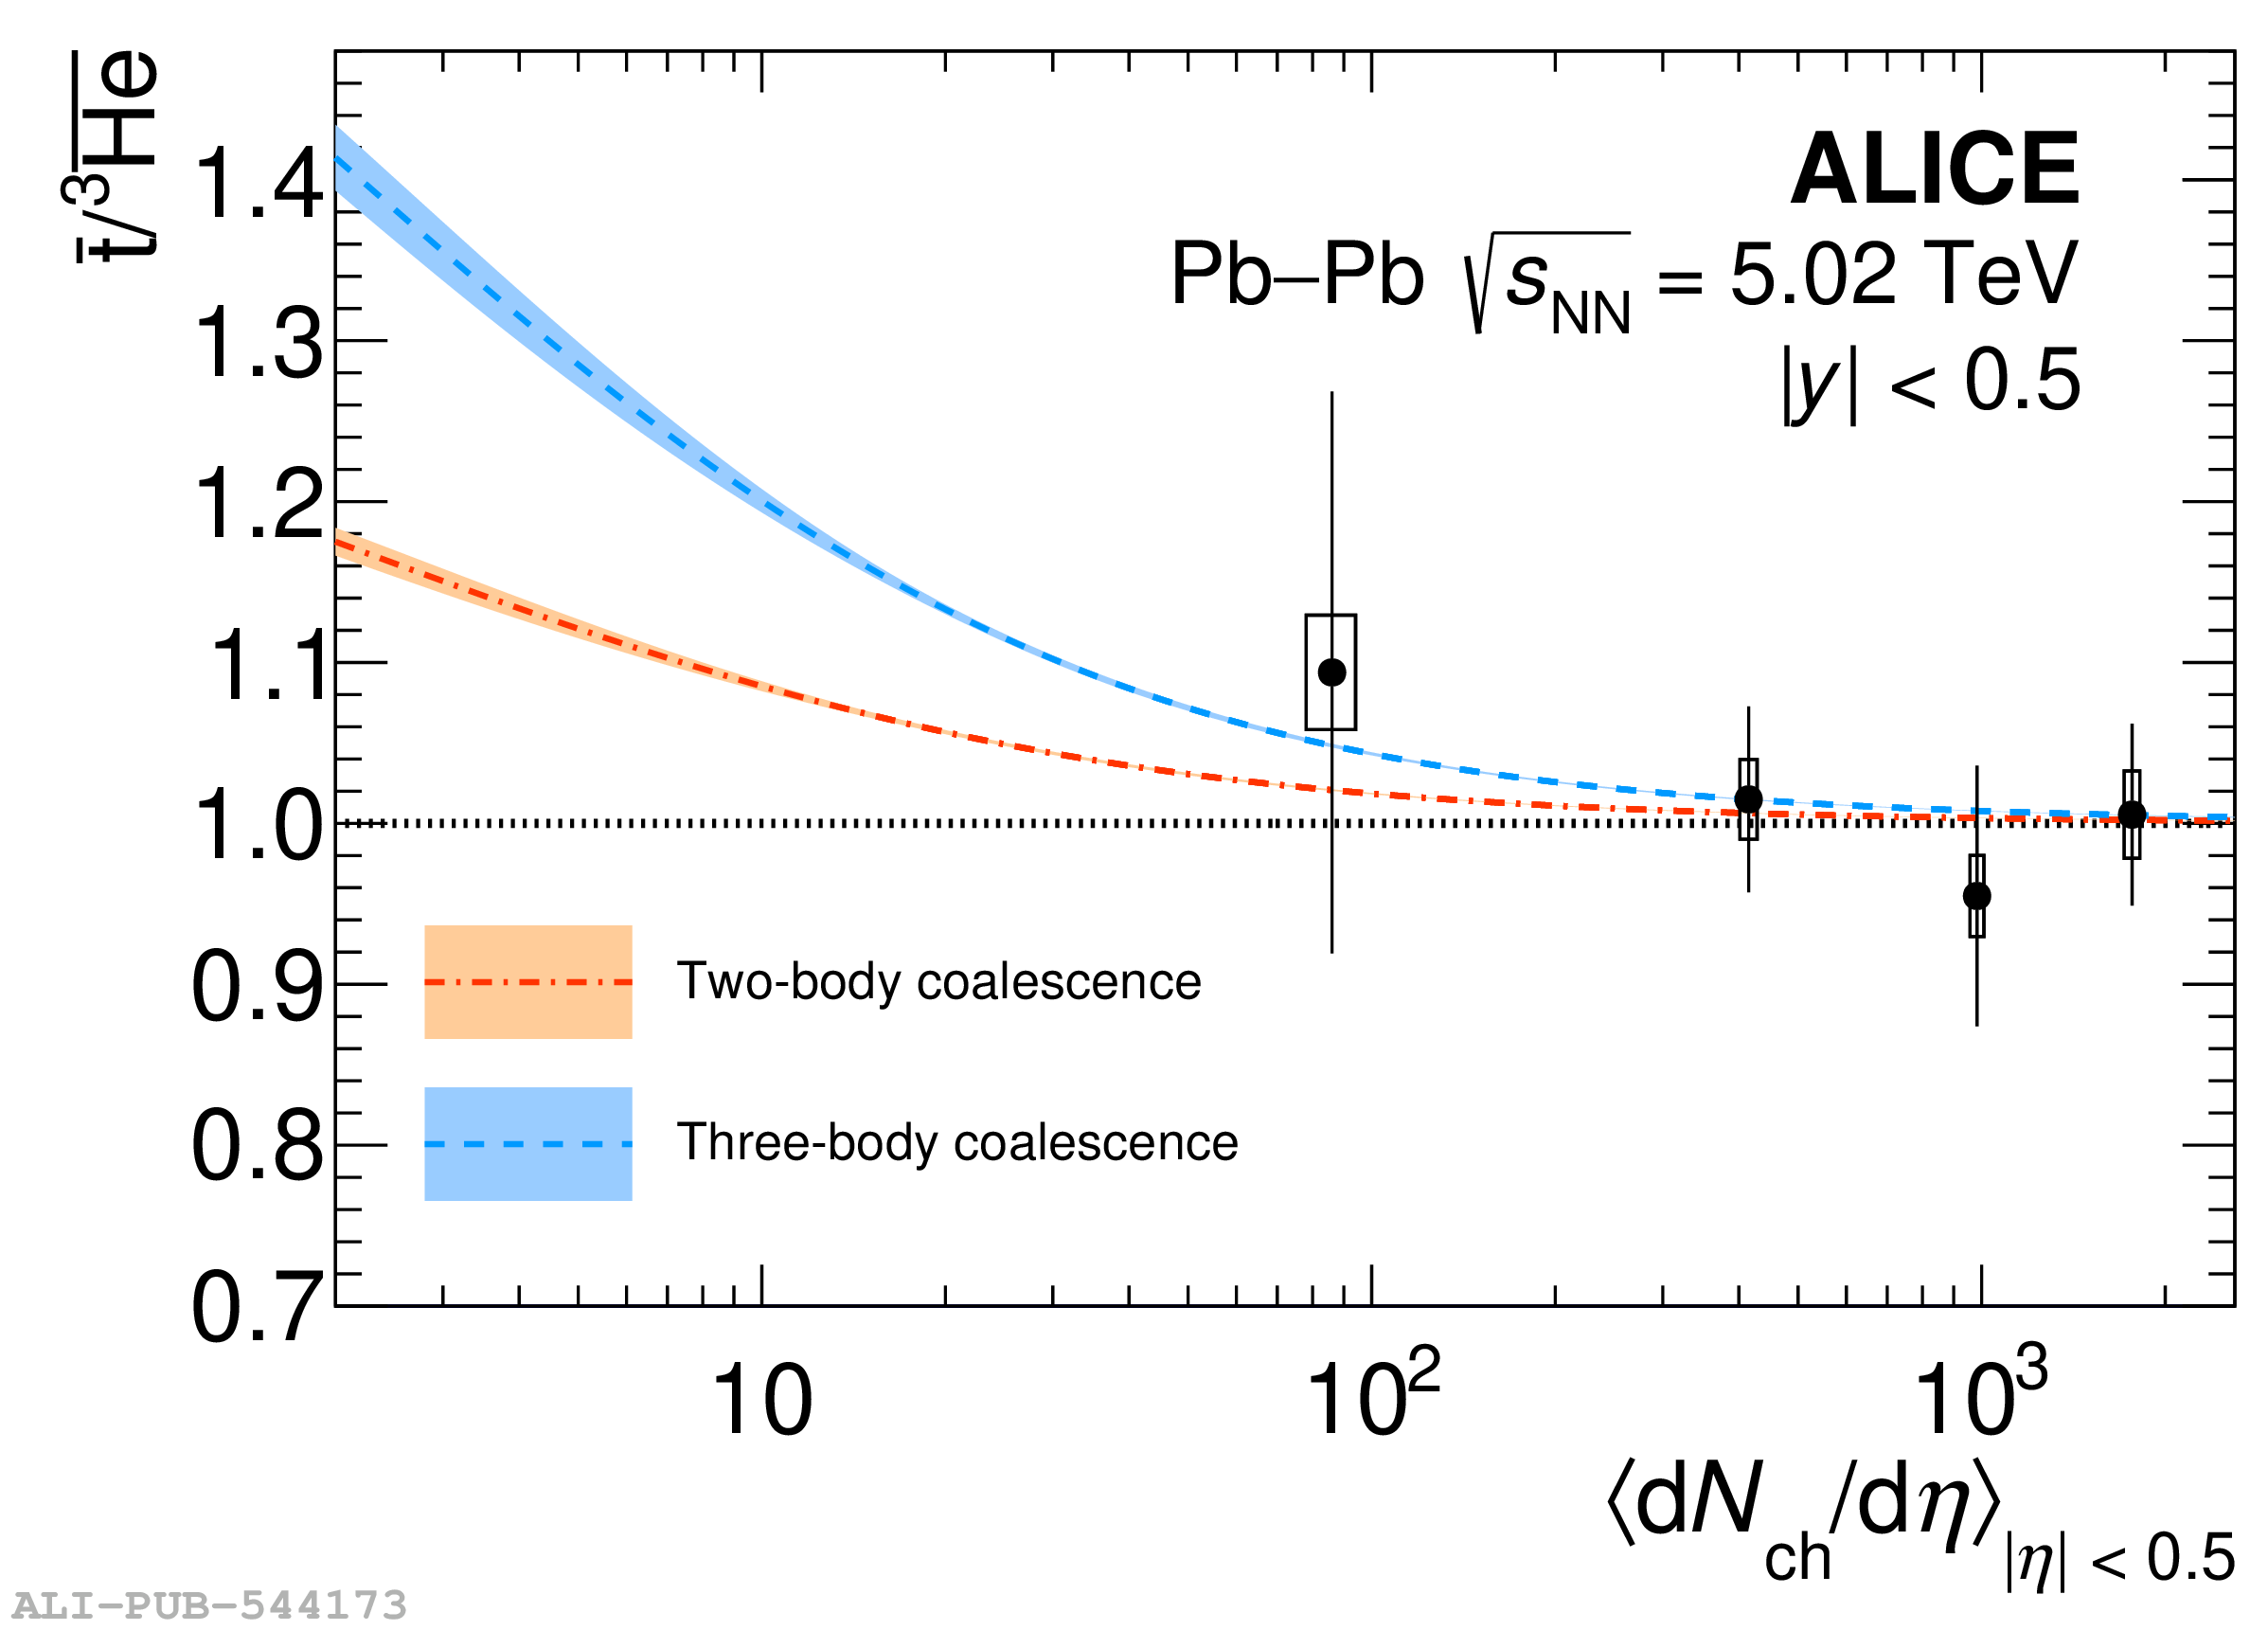 |
Figure 7
Integrated deuteron (left), \Hee (middle), and triton yields (right) over proton yields as a function of charged-particle multiplicity $\langle\textrm{d}N/\textrm{d}\eta_{\textrm{ch}}\rangle$ for pp, p--Pb, and Pb--Pb collisions measured by the ALICE Collaboration. The boxes represent the uncorrelated systematic uncertainties, while the vertical lines are the statistical ones. The shaded boxes represent the centrality-correlated uncertainties. In addition, the data are compared to the Thermal-FIST CSM (canonical statistical model) at 155\,MeV with a correlation volume of $V_\mathrm{c} = 1.6 {\rm d}V/{\rm d}y$ shown as a black line , the two coalescence approaches displayed in green (two-body coalescence) and in blue (three-body coalescence) and UrQMD hybrid coalescence shown as a purple line . |  |