The \dc{} (top panels) and \gc{} (bottom panels) correlators as a function of centrality (left panels) and charged-particle density (right panels) for pairs of particles with same (closed markers) and opposite (open markers) charges from Xe--Xe collisions at $\sqrt{s_{\rm NN}}=5.44$ TeV (red circles) compared to Pb--Pb collisions at $\sqrt{s_{\rm NN}}=5.02$ TeV (black squares) . The Pb--Pb points are slightly shifted along the horizontal axis for better visibility in the left panels. Bars (boxes) denote statistical (systematic) uncertainties. | 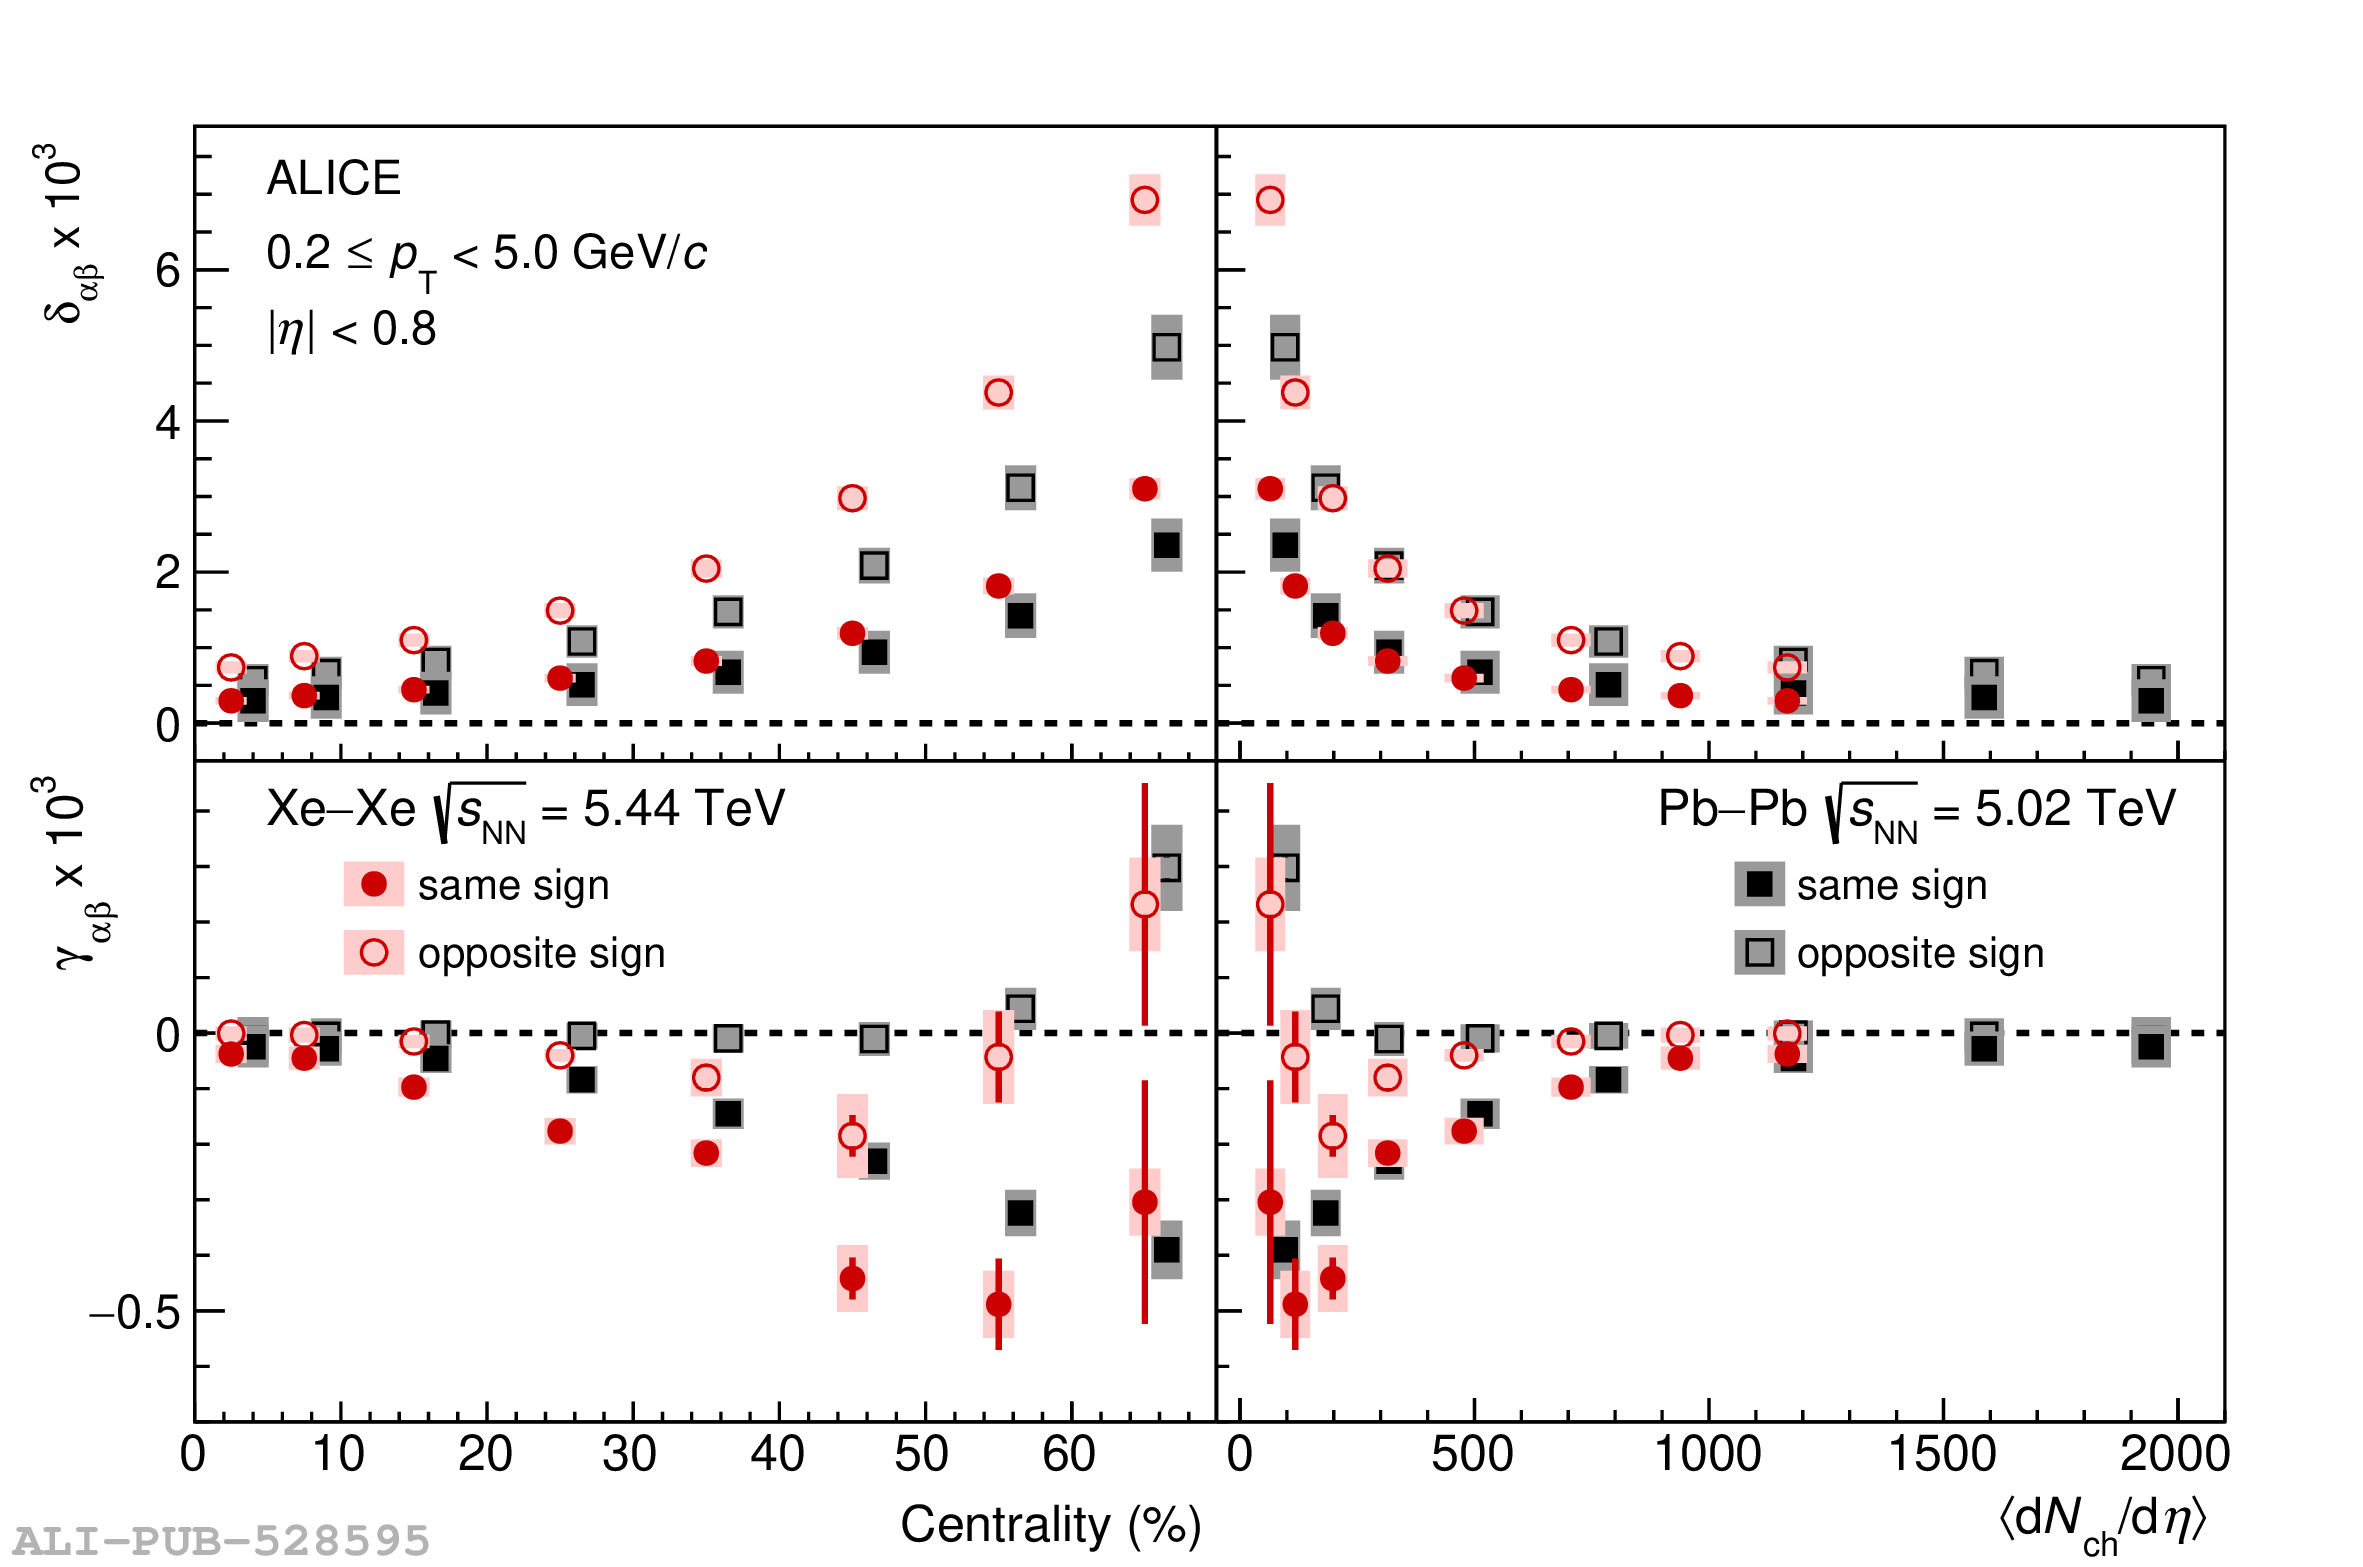 |