The first measurements of skewness and kurtosis of mean transverse momentum ($\langle p_\mathrm{T}\rangle$) fluctuations are reported in Pb$-$Pb collisions at $\sqrt{s_\mathrm{NN}}$ = 5.02 TeV, Xe$-$Xe collisions at $\sqrt{s_\mathrm{NN}}$ $=$ 5.44 TeV and pp collisions at $\sqrt{s} = 5.02$ TeV using the ALICE detector. The measurements are carried out as a function of system size $\langle \mathrm{d}N_\mathrm{ch}/\mathrm{d}\eta\rangle_{|\eta|<~0.5}^{1/3}$, using charged particles with transverse momentum ($p_\mathrm{T}$) and pseudorapidity ($\eta$), in the range $0.2 <~ p_\mathrm{T} <~ 3.0$ GeV/$c$ and $|\eta| <~ 0.8$, respectively. In Pb$-$Pb and Xe$-$Xe collisions, positive skewness is observed in the fluctuations of $\langle p_\mathrm{T}\rangle$ for all centralities, which is significantly larger than what would be expected in the scenario of independent particle emission. This positive skewness is considered a crucial consequence of the hydrodynamic evolution of the hot and dense nuclear matter created in heavy-ion collisions. Furthermore, similar observations of positive skewness for minimum bias pp collisions are also reported here. Kurtosis of $\langle p_\mathrm{T}\rangle$ fluctuations is found to be in good agreement with the kurtosis of Gaussian distribution, for most central Pb$-$Pb collisions. Hydrodynamic model calculations with MUSIC using Monte Carlo Glauber initial conditions are able to explain the measurements of both skewness and kurtosis qualitatively from semicentral to central collisions in Pb--Pb system. Color reconnection mechanism in PYTHIA8 model seems to play a pivotal role in capturing the qualitative behavior of the same measurements in pp collisions.
Phys. Lett. B 850 (2024) 138541
HEP Data
e-Print: arXiv:2308.16217 | PDF | inSPIRE
CERN-EP-2023-187
Figure group
Figure 2
Comparison of event-by-event mean transverse momentum $\langle p_\mathrm{T}\rangle$ distribution from actual analysis and modified analysis in which $N_\mathrm{ch}$ in each event is fixed to $N_\mathrm{ch}^\mathrm{min}$ ($N_\mathrm{ch}^\mathrm{min}$ is the minimum number of charged particles in a given centrality class) and $N_\mathrm{ch}^\mathrm{min}$ number of particles are selected in each event randomly for the 0$-$5% (left), 30$-$40% (middle), and 50$-$60% (right) centrality classes. | 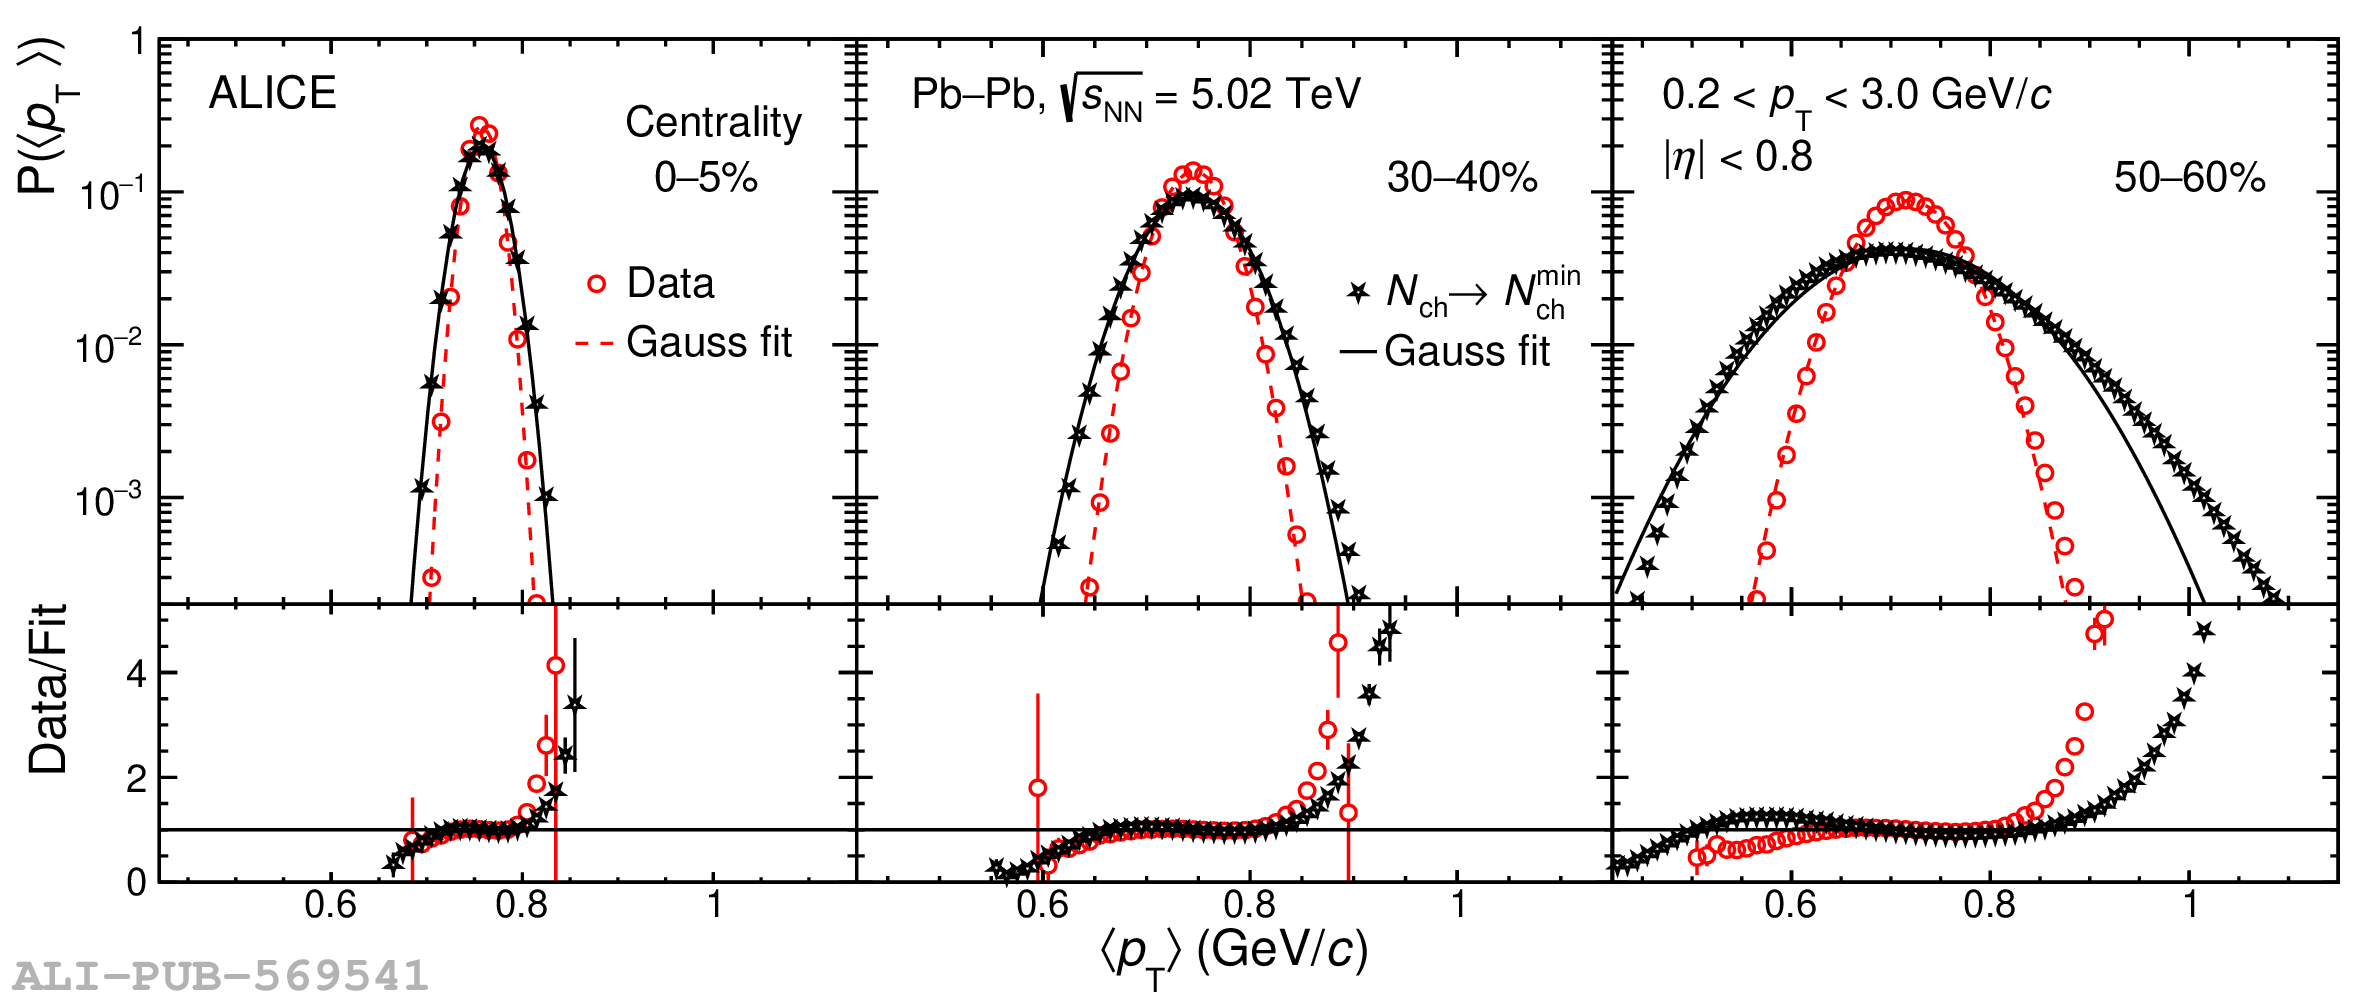 |
Figure 3
Standardized skewness $\gamma_{\langle p_\mathrm{T}\rangle}$ shown as a function of $\langle \mathrm{d}N_\mathrm{ch}/\mathrm{d}\eta\rangle_{|\eta|<0.5}^{1/3}$ in Pb$-$Pb collisions at $\sqrt{s_\mathrm{NN}}$ $=$ 5.02 TeV, Xe$-$Xe collisions at $\sqrt{s_\mathrm{NN}}$ $=$ 5.44 TeV, and pp collisions at $\sqrt{s}$ $=$ 5.02 TeV. The predictions from different event generators and hydrodynamic model calculations from V-USPHYDRO and MC-Glauber+MUSIC are denoted by colored bands. The statistical (systematic) uncertainties are represented by vertical bars (boxes). | 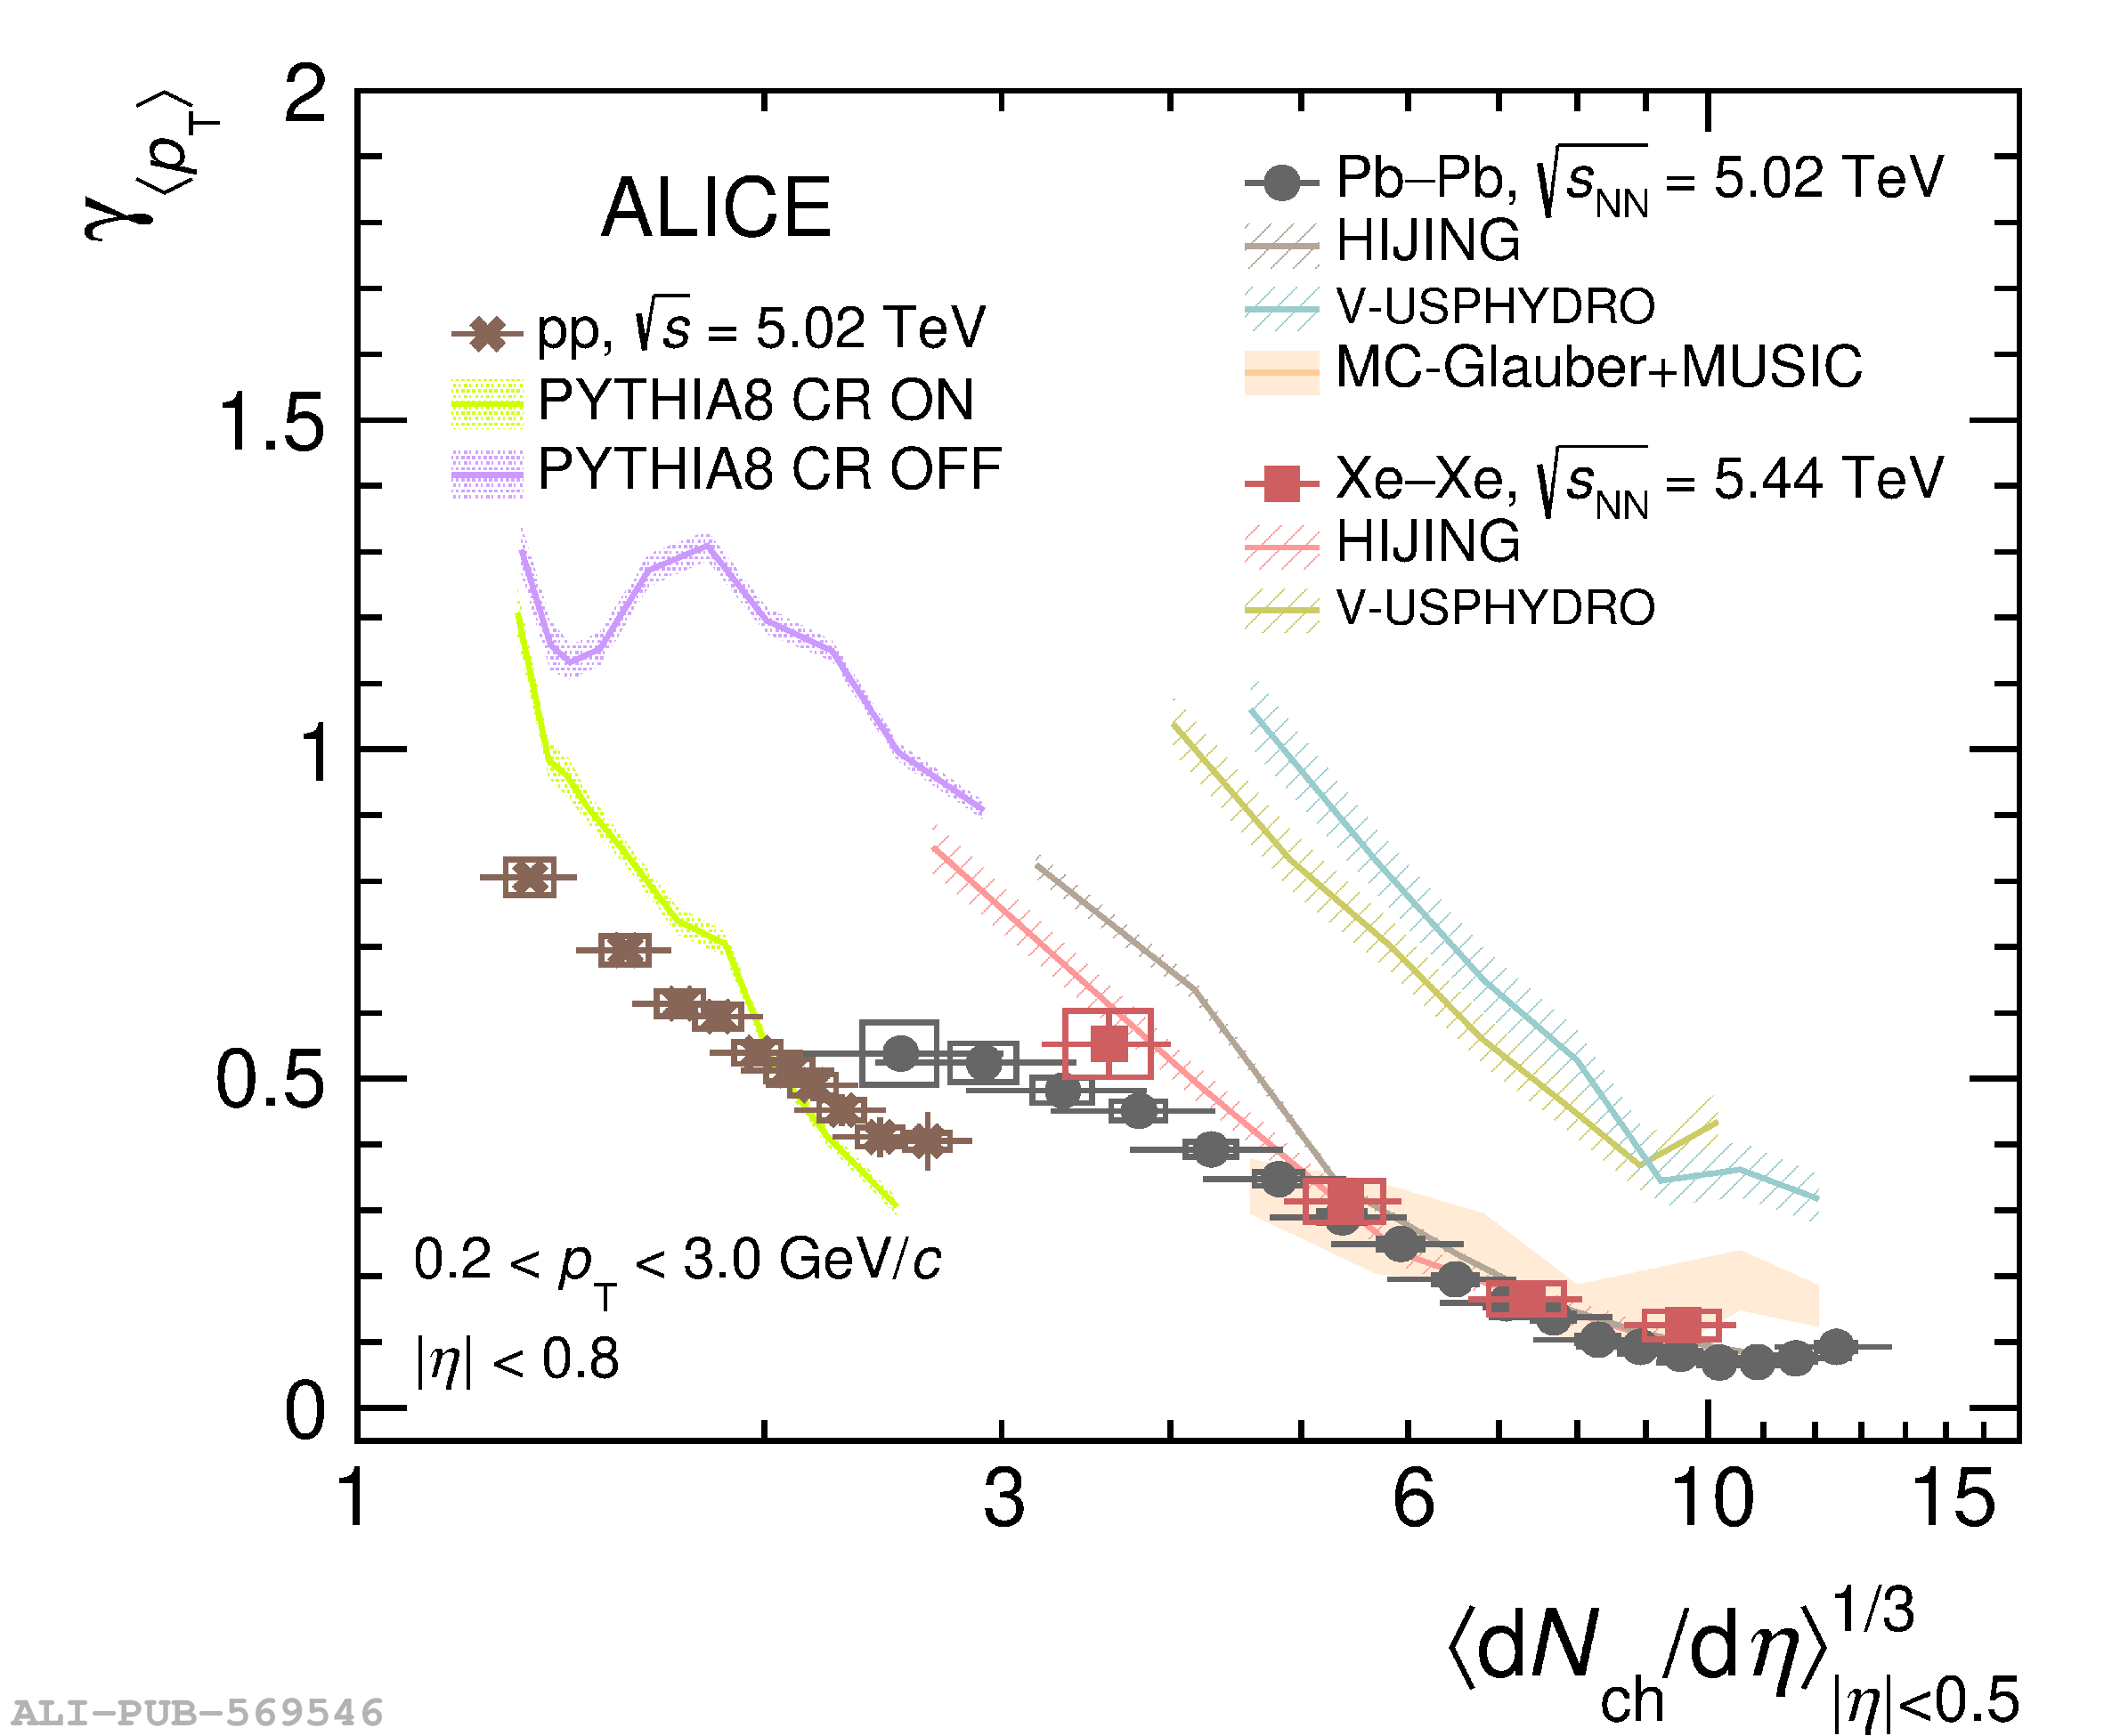 |
Figure 4
Intensive skewness $\Gamma_{\langle p_\mathrm{T}\rangle}$ shown as a function of $\langle \mathrm{d}N_{\mathrm{ch}}/\mathrm{d}\eta\rangle_{|\eta|<0.5}^{1/3}$ in Pb$-$Pb collisions at $\sqrt{s_\mathrm{NN}}$ $=$ 5.02 TeV, Xe$-$Xe collisions at $\sqrt{s_\mathrm{NN}}$ $=$ 5.44 TeV, and pp collisions at $\sqrt{s}$ $=$ 5.02 TeV. The colored dashed lines represent the independent baseline for each system. The predictions from different event generators and hydrodynamic model calculations from V-USPHYDRO and MC-Glauber+MUSIC are denoted by colored bands. The statistical (systematic) uncertainties are represented by vertical bars (boxes). | 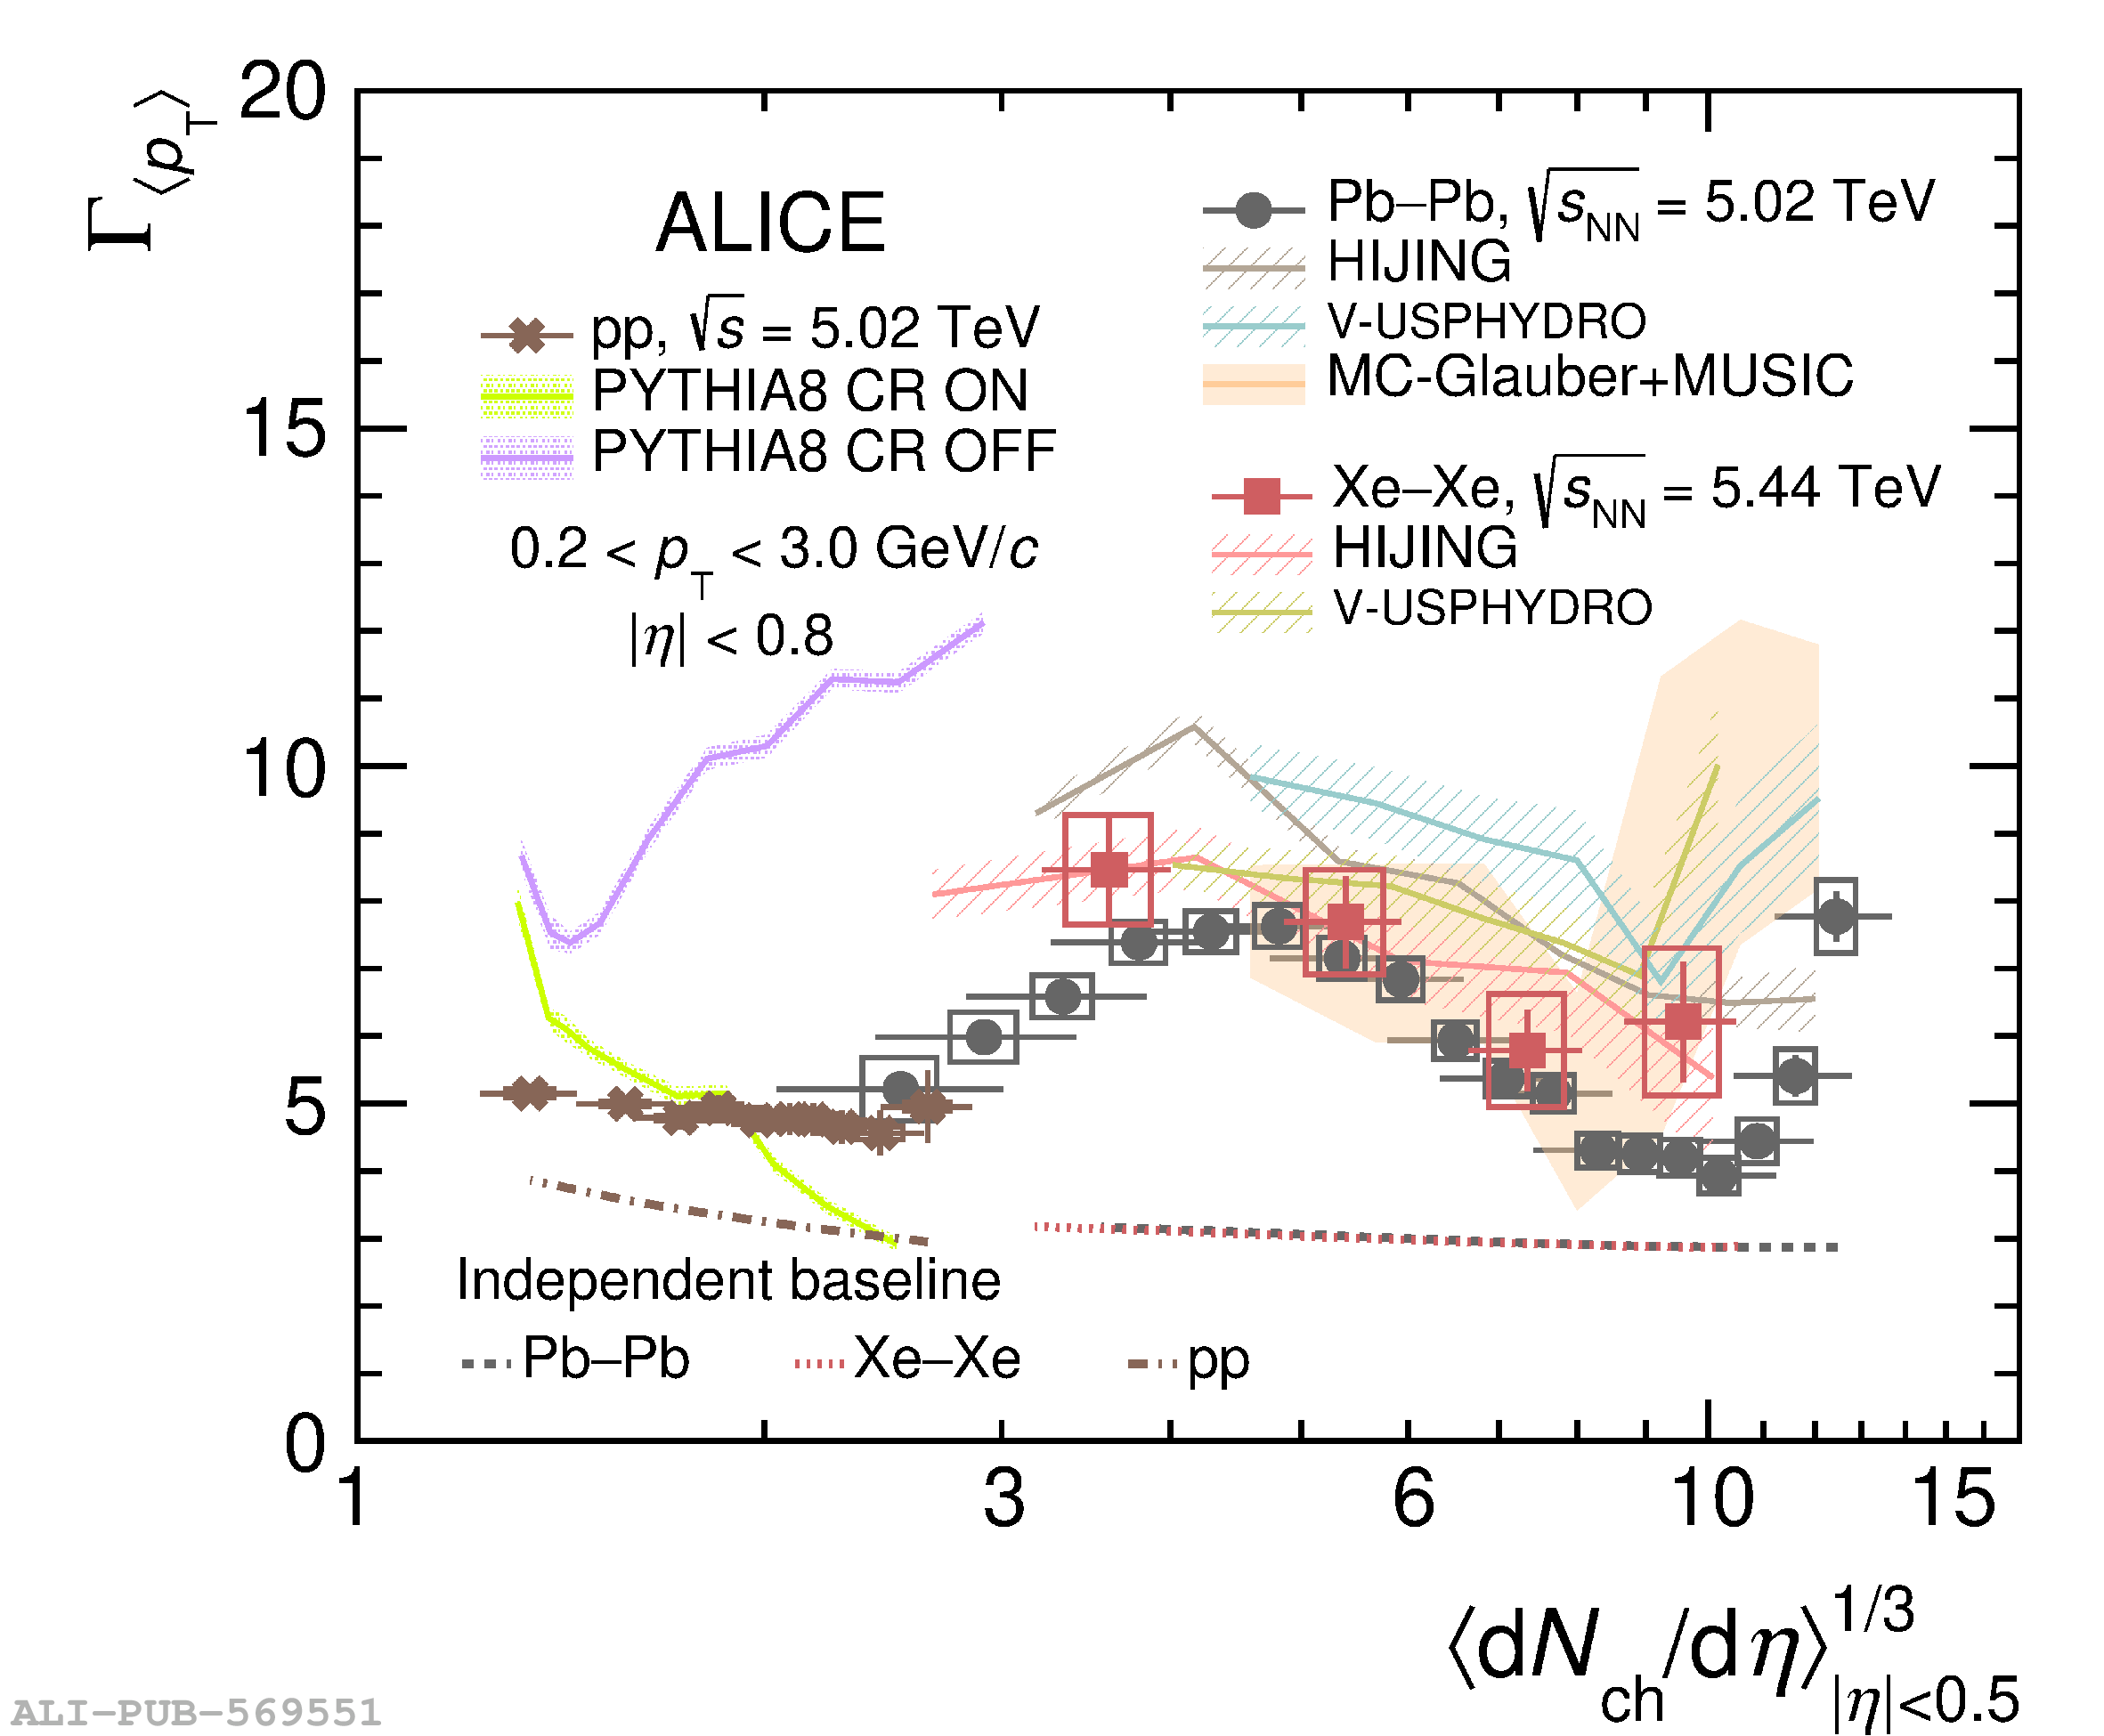 |
Figure 5
Kurtosis $\kappa_{\langle p_\mathrm{T}\rangle}$ shown as a function of $\langle \mathrm{d}N_\mathrm{ch}/\mathrm{d}\eta\rangle_{|\eta|<0.5}^{1/3}$ in Pb$-$Pb collisions at $\sqrt{s_\mathrm{NN}}$ $=$ 5.02 TeV, Xe$-$Xe collisions at $\sqrt{s_\mathrm{NN}}$ = 5.44 TeV and pp collisions at $\sqrt{s}$ $=$ 5.02 TeV. The predictions from different event generators and hydrodynamic calculations from MC-Glauber+MUSIC model are represented by colored bands. The dashed line indicates the Gaussian baseline. The statistical (systematic) uncertainties are represented by vertical bars (boxes). | 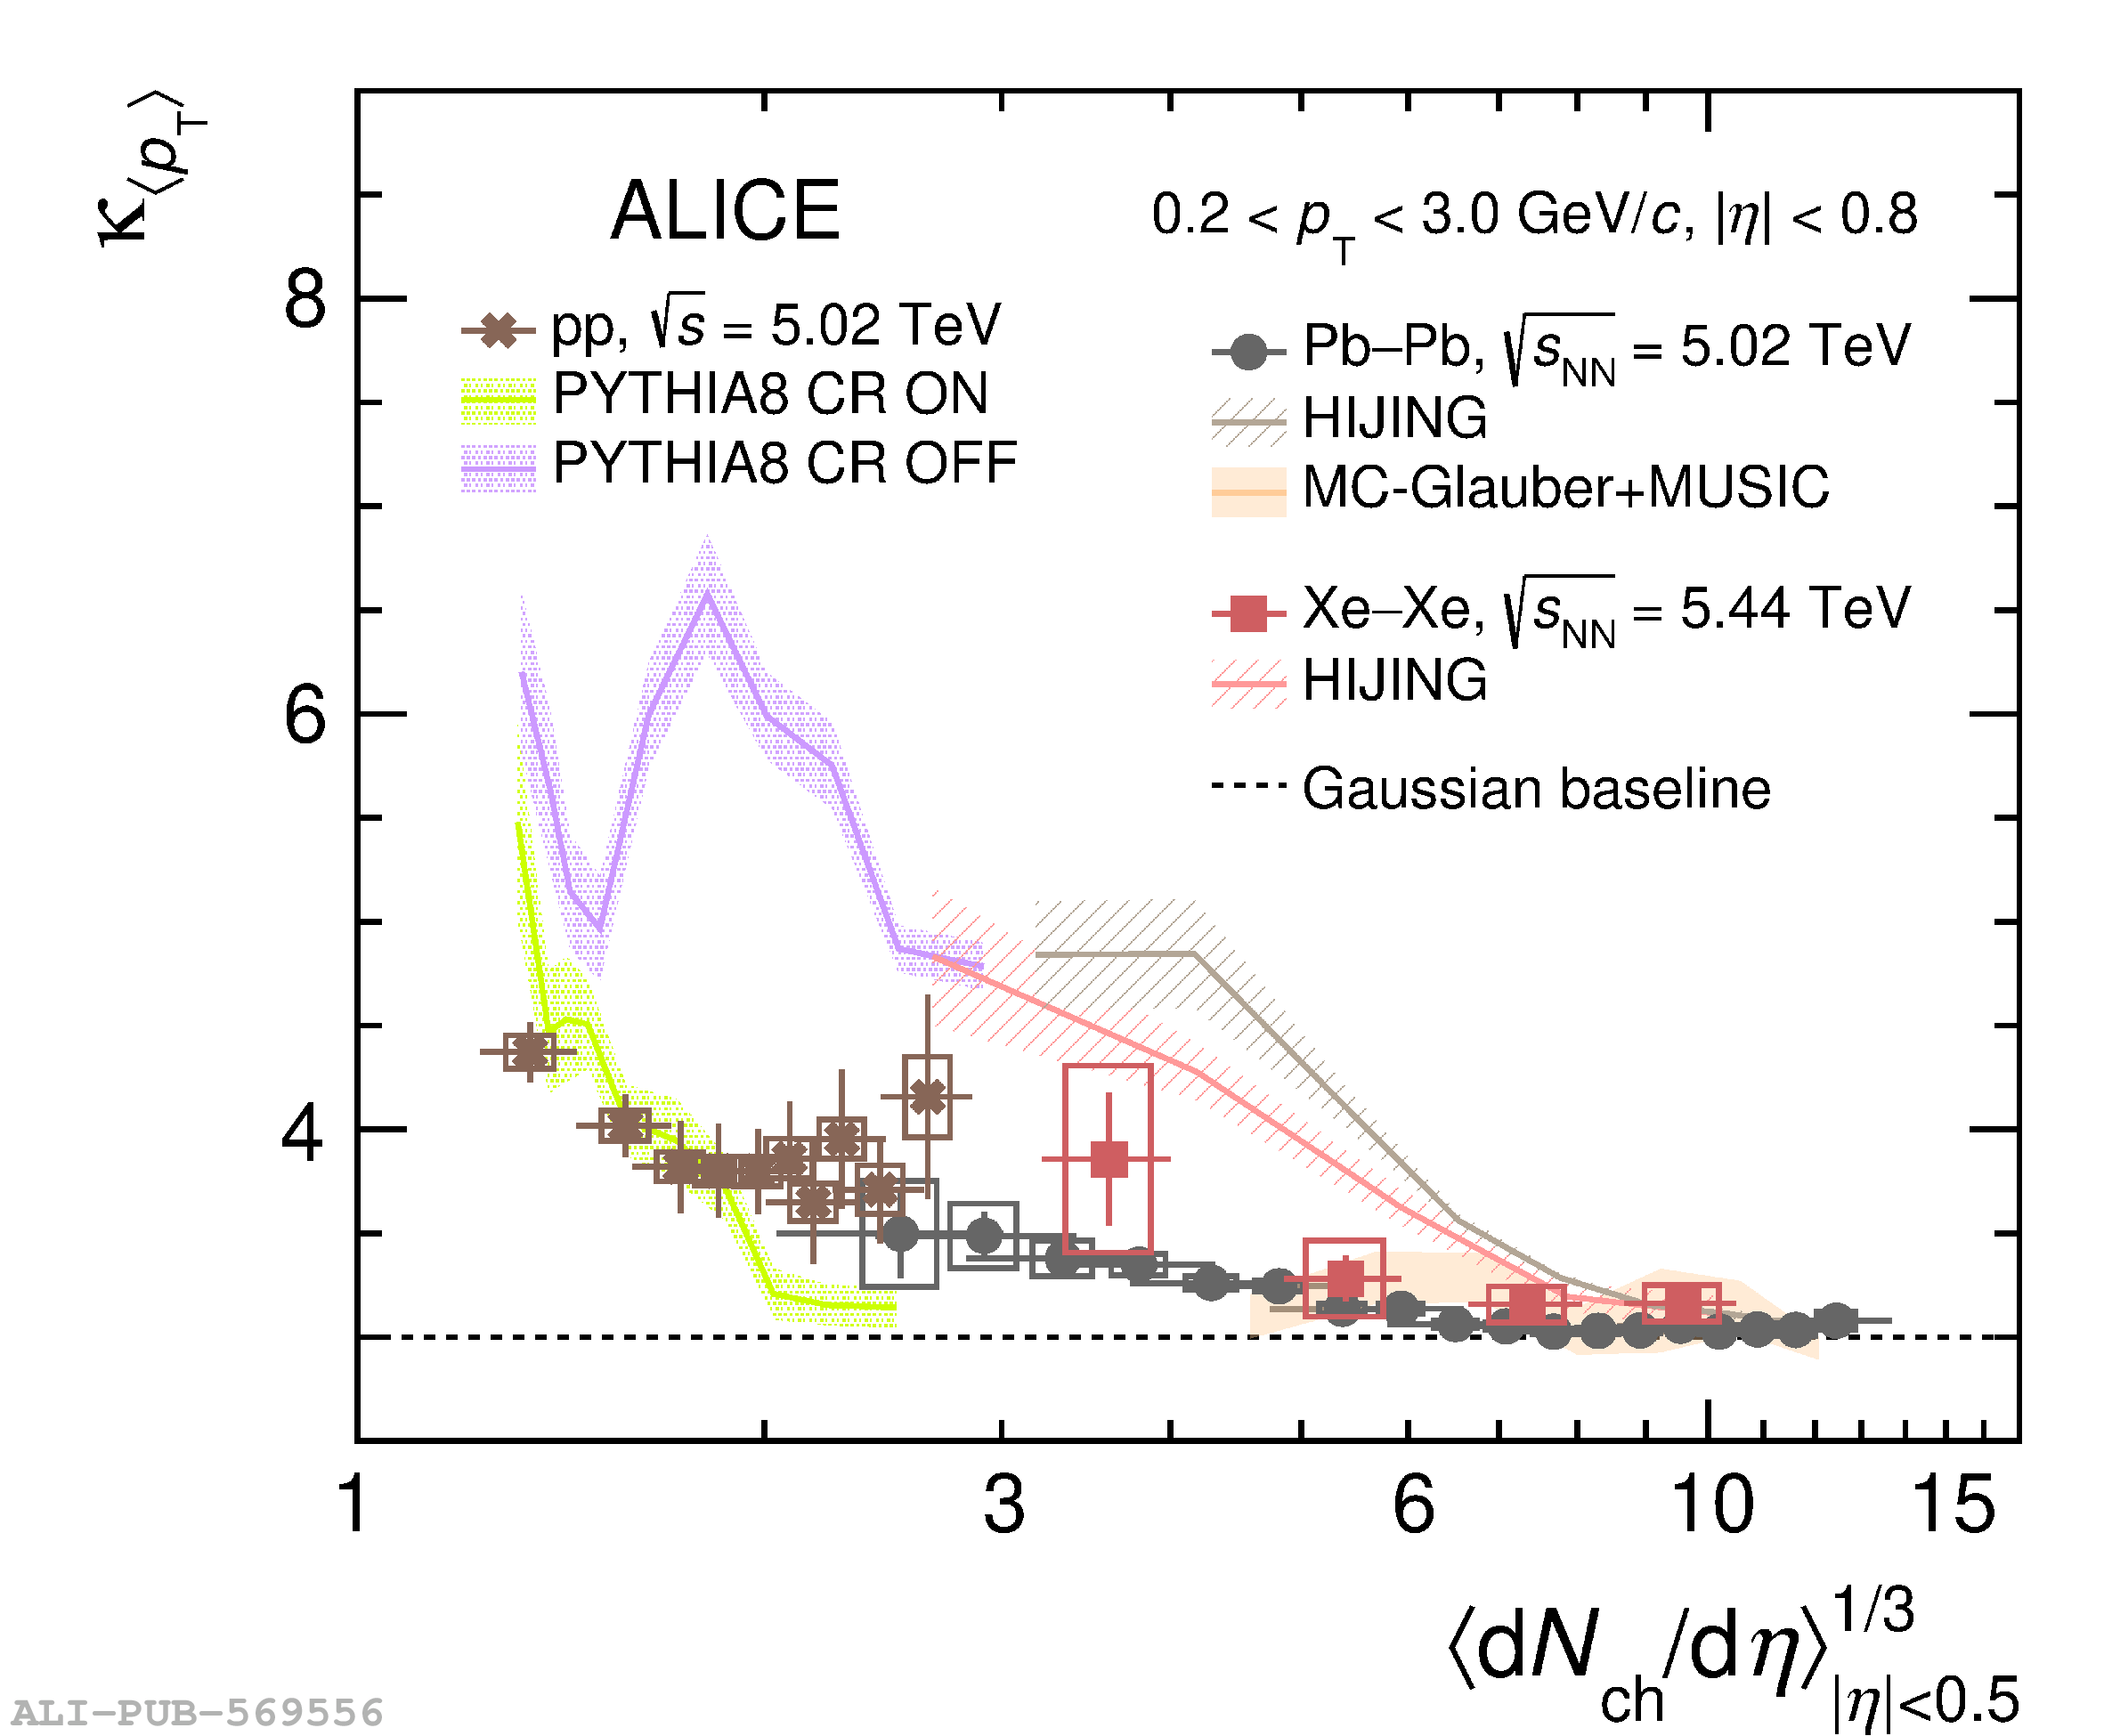 |