In this letter, measurements of (anti)alpha production in central (0$-$10%) Pb$-$Pb collisions at a center-of-mass energy per nucleon$-$nucleon pair of $\sqrt{s_{\rm NN}}$ = 5.02 TeV are presented, including the first measurement of an antialpha transverse-momentum spectrum. Owing to its large mass, the production of (anti)alpha is expected to be sensitive to different particle production models. The production yields and transverse-momentum spectra of nuclei are of particular interest because they provide a stringent test of these models. The averaged antialpha and alpha spectrum is compared to the spectra of lighter particles, by including it into a common blast-wave fit capturing the hydrodynamic-like flow of all particles. This fit is indicating that the (anti)alpha also participates in the collective expansion of the medium created in the collision. A blast-wave fit including only protons, (anti)alpha, and other light nuclei results in a similar flow velocity as the fit that includes all particles. A similar flow velocity, but a significantly larger kinetic freeze-out temperature is obtained when only protons and light nuclei are included in the fit. The coalescence parameter $B_4$ is well described by calculations from a statistical hadronization model but significantly underestimated by calculations assuming nucleus formation via coalescence of nucleons. Similarly, the (anti)alpha-to-proton ratio is well described by the statistical hadronization model. On the other hand, coalescence calculations including approaches with different implementations of the (anti)alpha substructure tend to underestimate the data.
Phys. Lett. B 858 (2024) 138943
HEP Data
e-Print: arXiv:2311.11758 | PDF | inSPIRE
CERN-EP-2023-255
Figure group
Figure 1
$m^2/z^2$ distribution for ${}^{4}\overline{{\rm He}}$ candidates (green). The background (magenta) is constructed by selecting all candidates outside the \antihe TPC window of 3$\sigma$ around the alpha mass hypothesis ($|n\sigma_{\rm TPC}({}^{4}\overline{{\rm He}})| > 3$) and in addition outside the 3$\sigma$ window around the deuteron mass hypothesis ($|n\sigma_{\rm TPC}(\overline{{\rm d}})| > 3$). The blue line is an exponential fit to the rise at lower masses originating from ${}^{3}\overline{{\rm He}}$ candidates. | 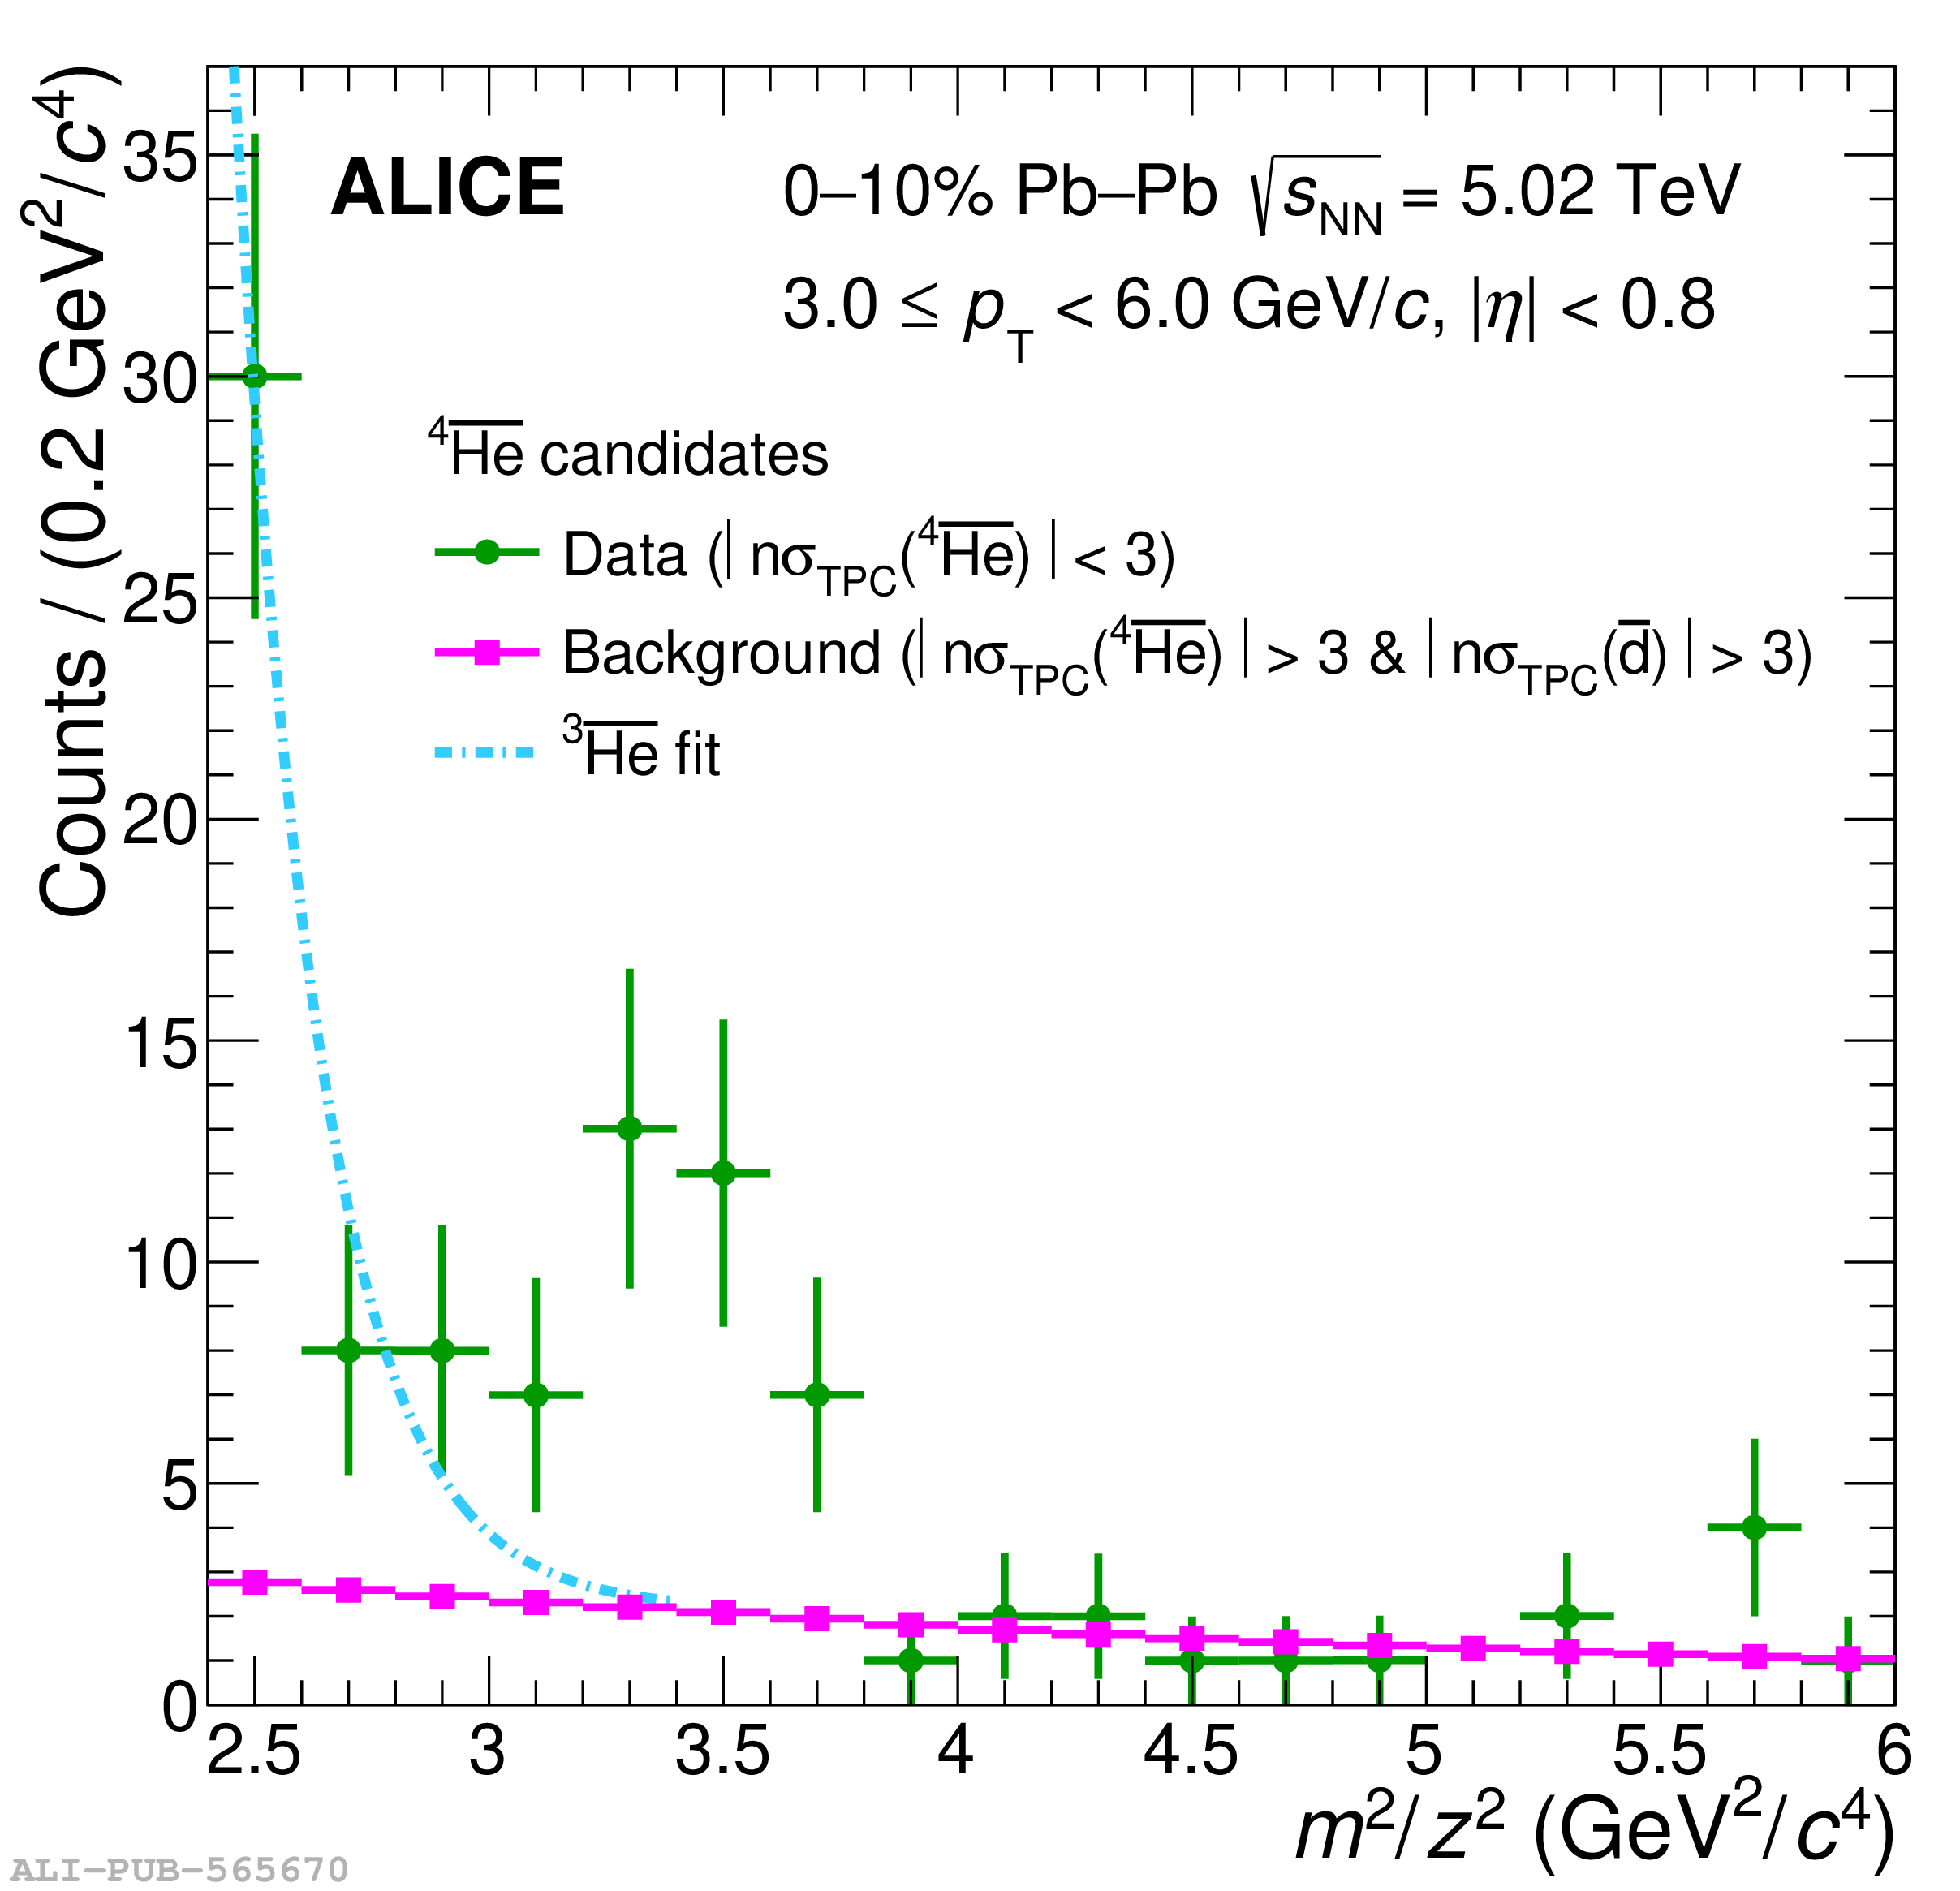 |
Figure 2
Measured transverse-momentum distributions of ${}^{4}$He and ${}^{4}\overline{{\rm He}}$ (upper panel). The vertical lines indicate the statistical uncertainties, while the boxes represent the systematic ones. In the case that the statistical uncertainties would overlap the ${}^{4}$He points are a bit shifted on the x-axis. The lower panel shows the ratio between ${}^{4}\overline{{\rm He}}$ and ${}^{4}$He with statistical and uncorrelated systematic uncertainties as the correlated systematic uncertainties cancel. | 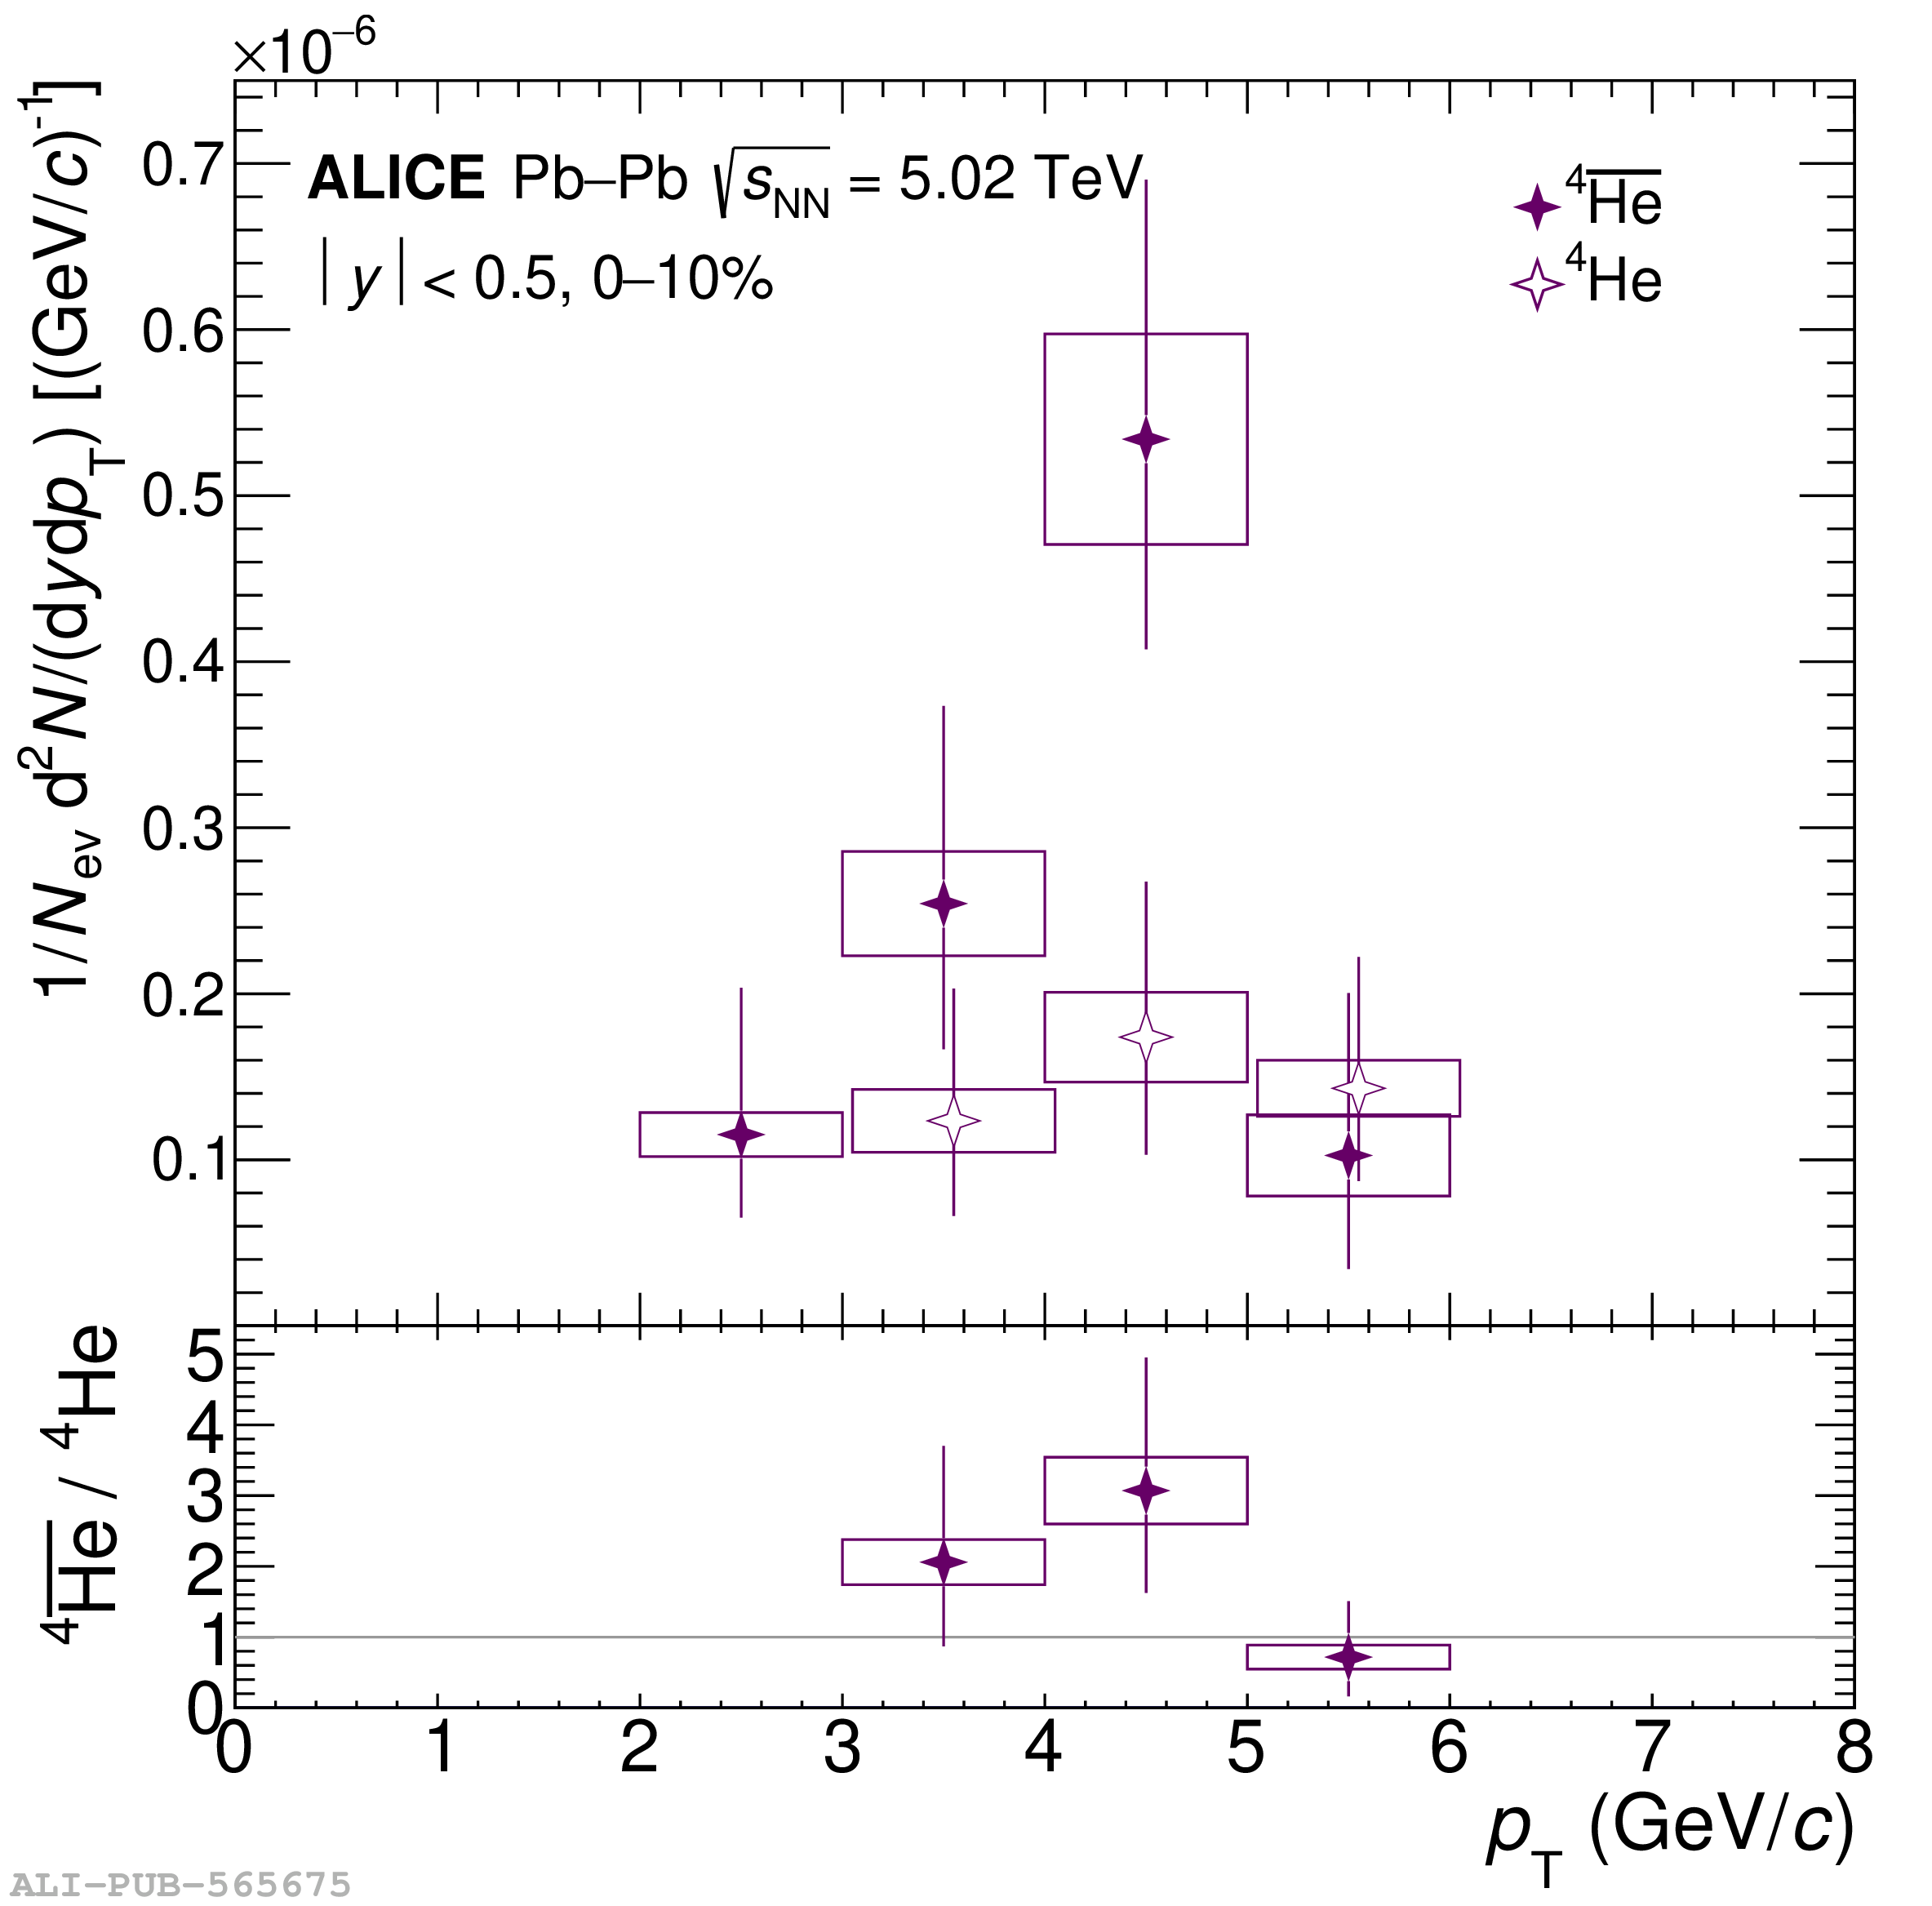 |
Figure 3
Combined blast-wave fit of all available light flavored hadron $p_{\rm T}$ spectra including nuclei (left) and only p, $\overline{\mathrm{d}}$, $\overline{\mathrm{t}}$, ${}^{3}\overline{\mathrm{He}}$ and ${}^{4}$He $p_{\rm T}$ spectra (right) in Pb-Pb collisions at $\sqrt{s_{\rm NN}} = 5.02$ TeV for 0-10% central events (upper panels). The lower panels show the ratio between each data point and the blast-wave model fit for each species. | 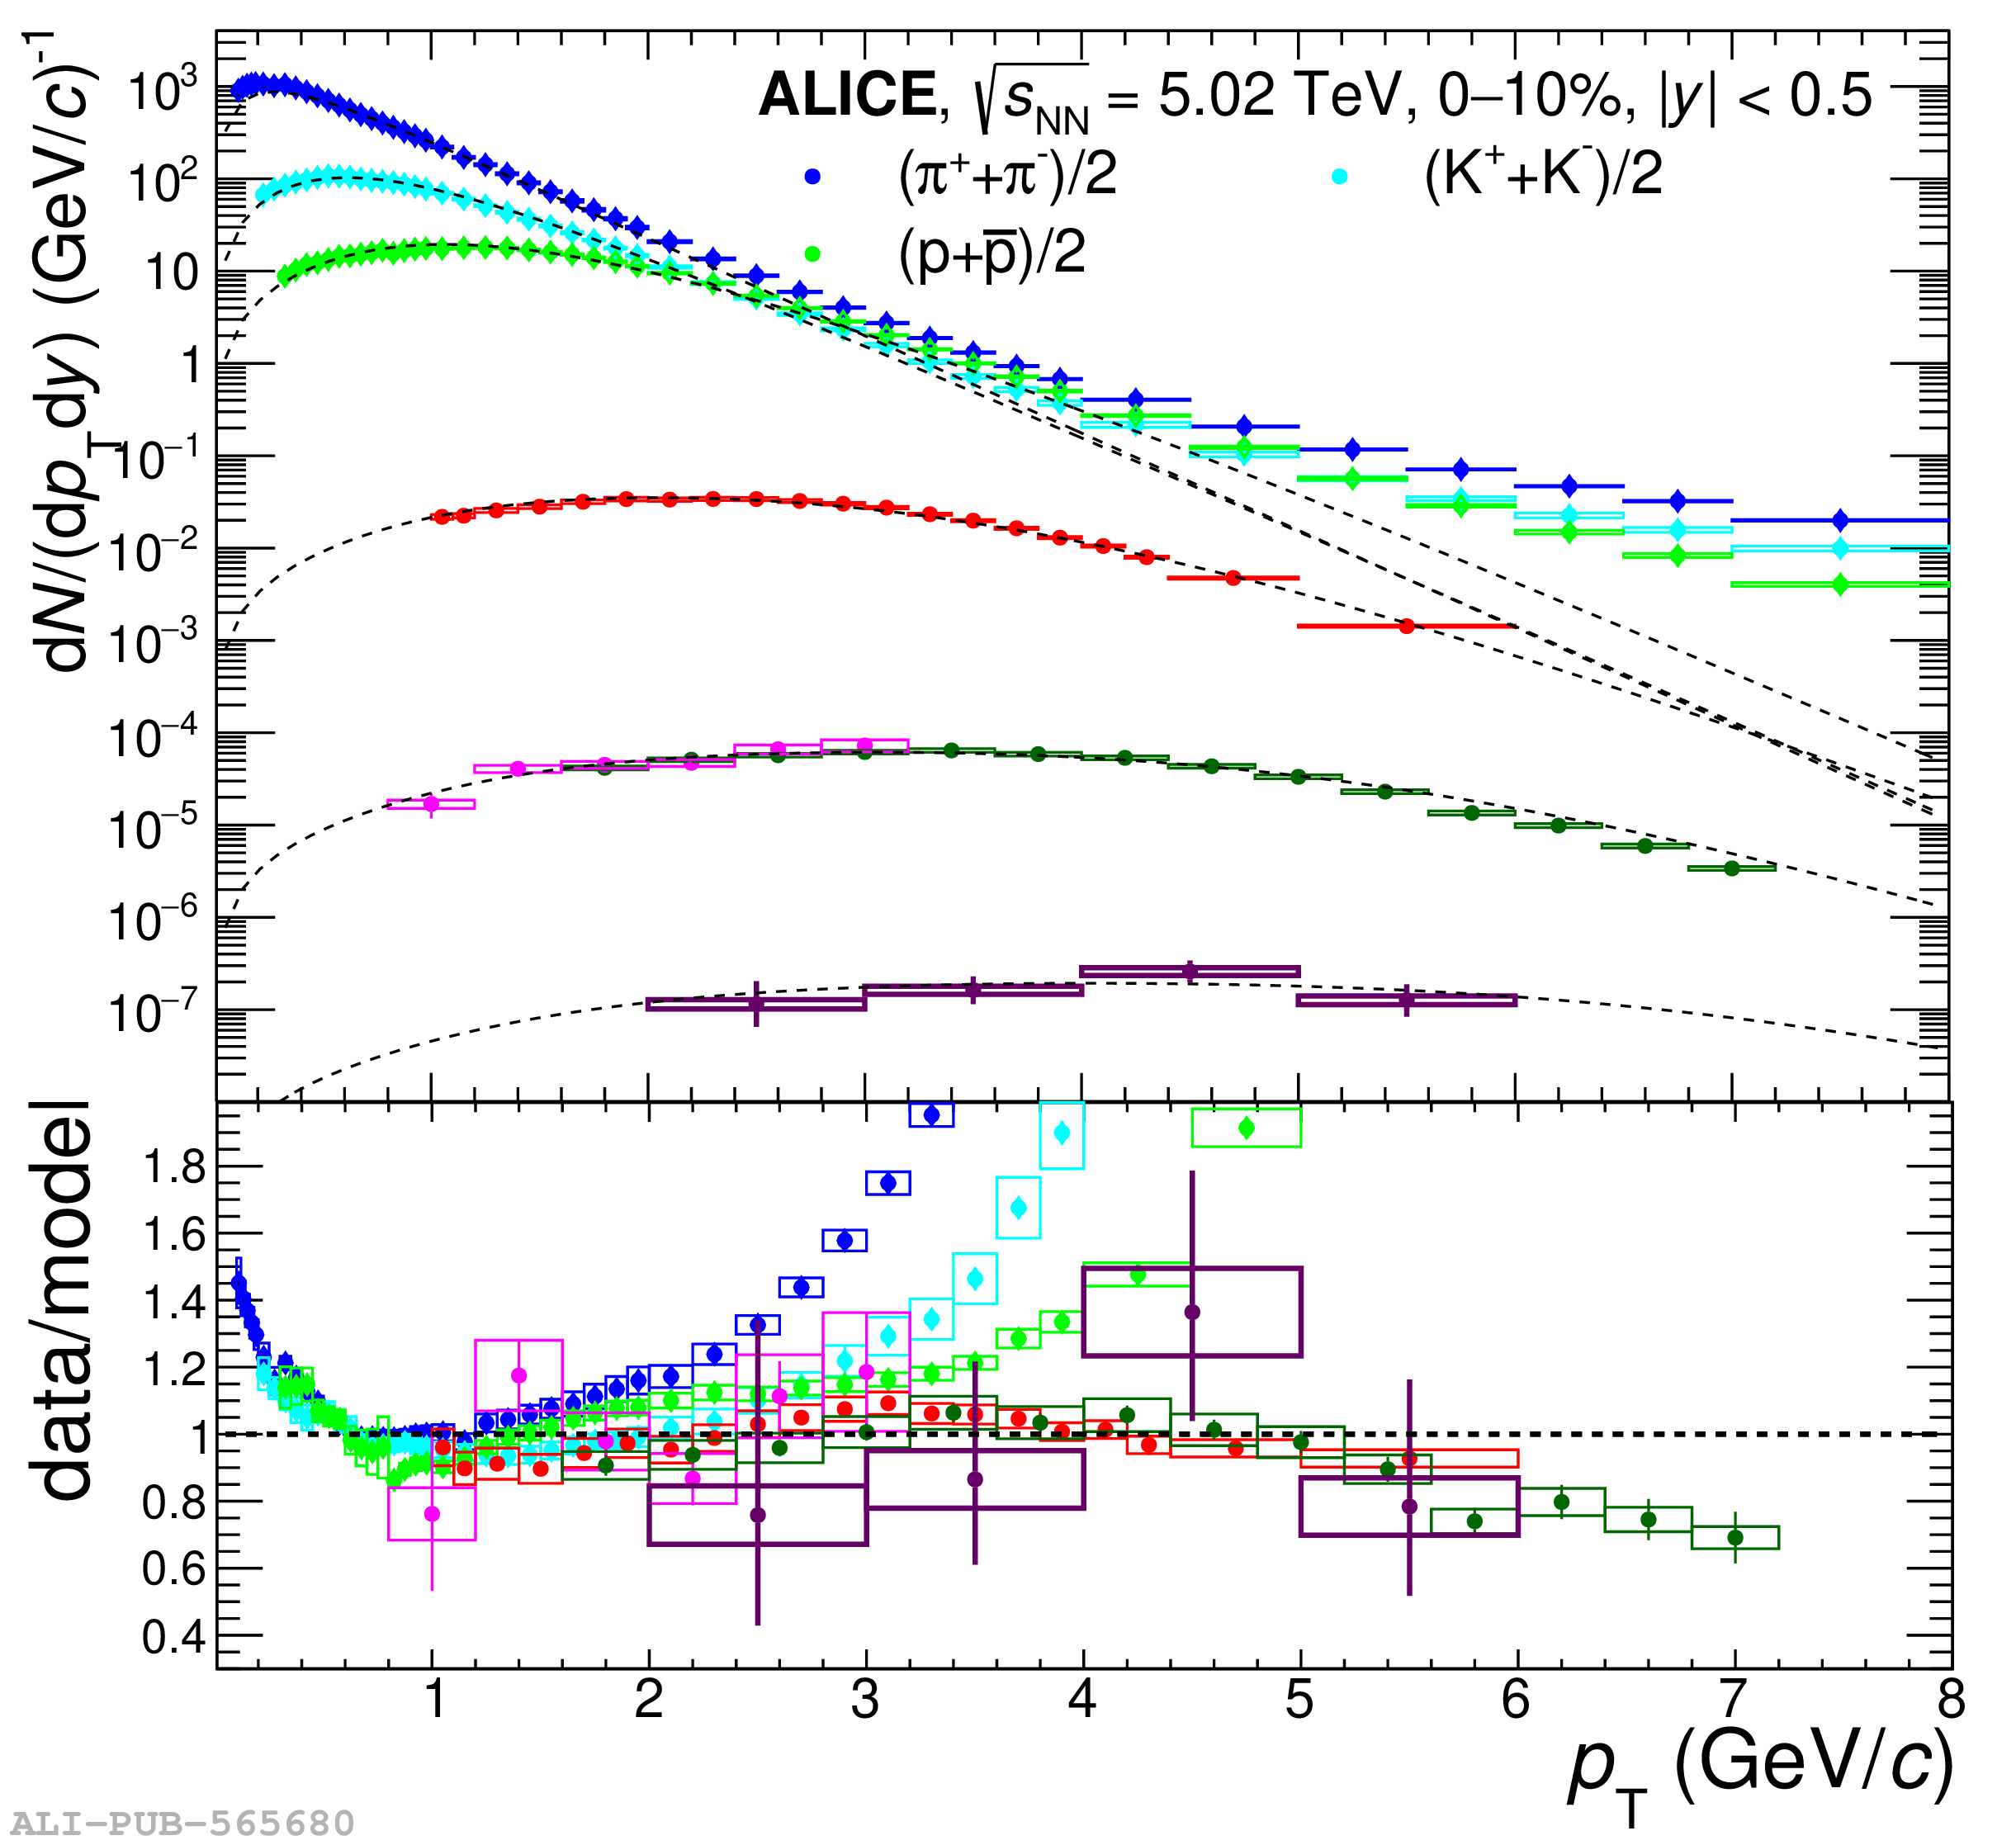 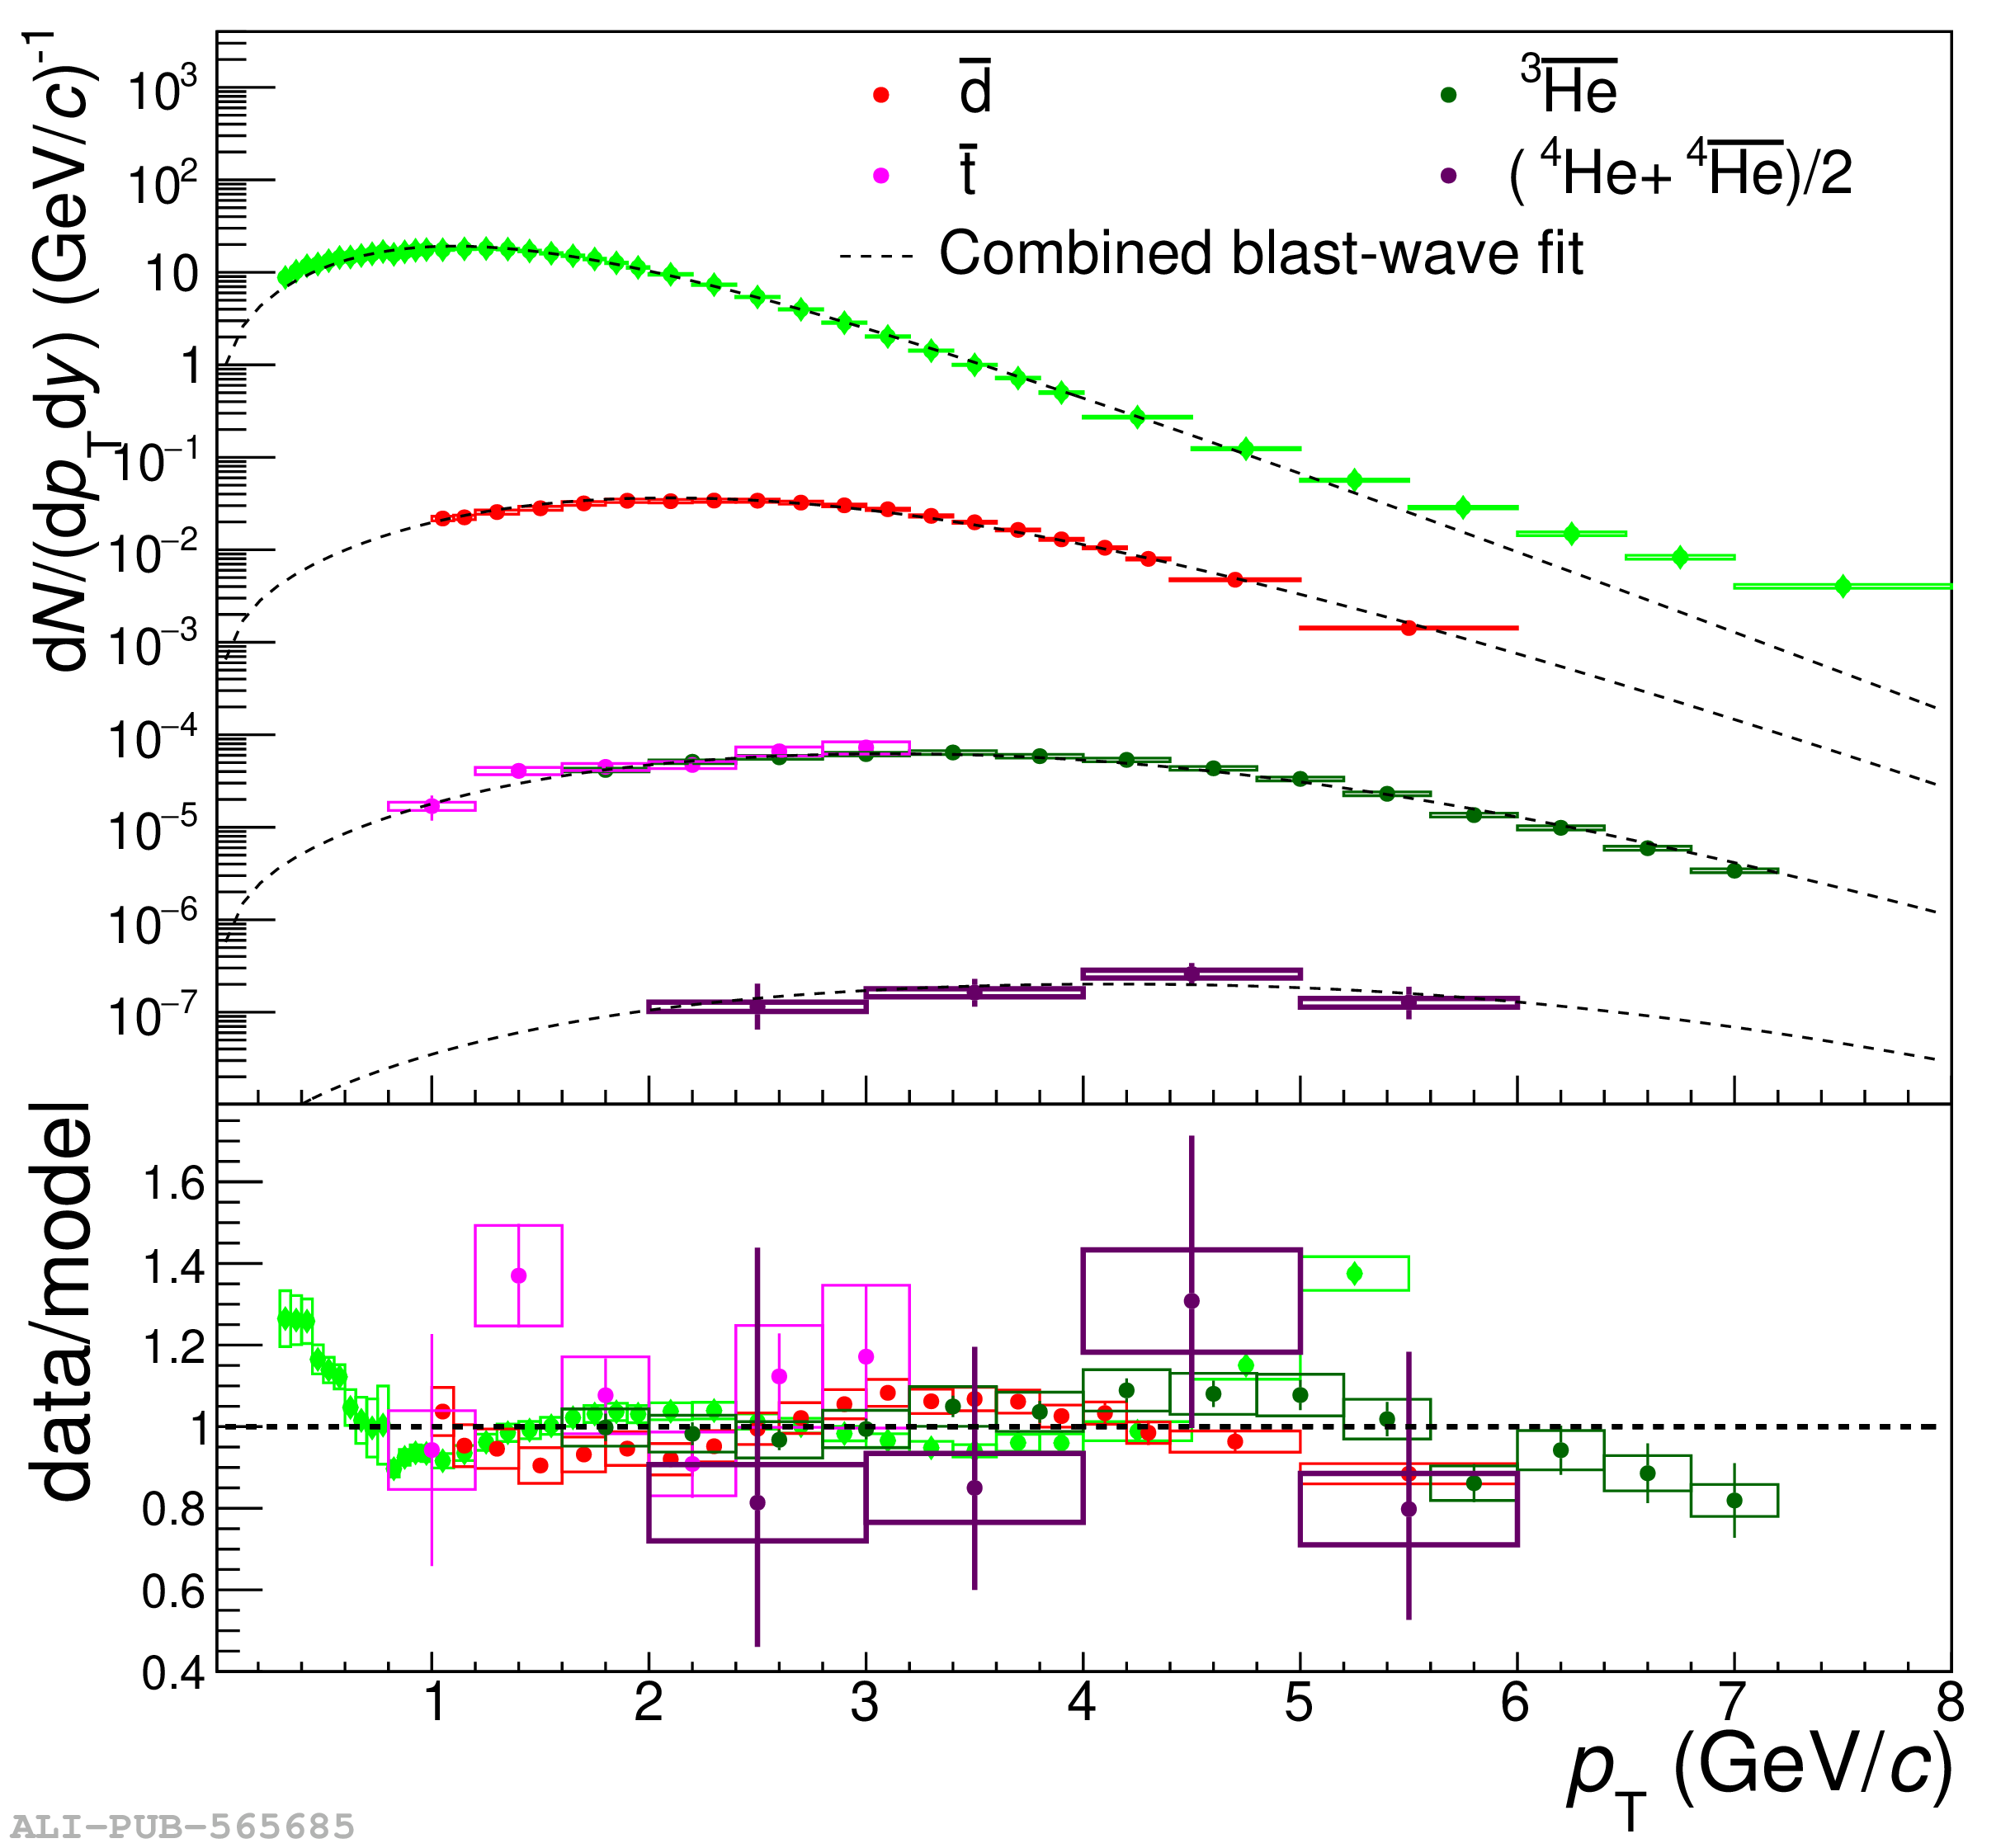 |
Figure 4
The coalescence parameter $B_4$ as a function of $p_{\rm T}/A$, calculated from the averaged ${}^{4}$He and ${}^{4}\overline{{\rm He}}$ spectra and the protons from [116]. Statistical uncertainties are indicated by the vertical lines and the boxes correspond to the systematic uncertainties. The blue dashed line and the full black line indicate the values for the SHM combined with blast-wave $\pt$ shapes and the coalescence predictions from Refs. [91, 92], respectively. | 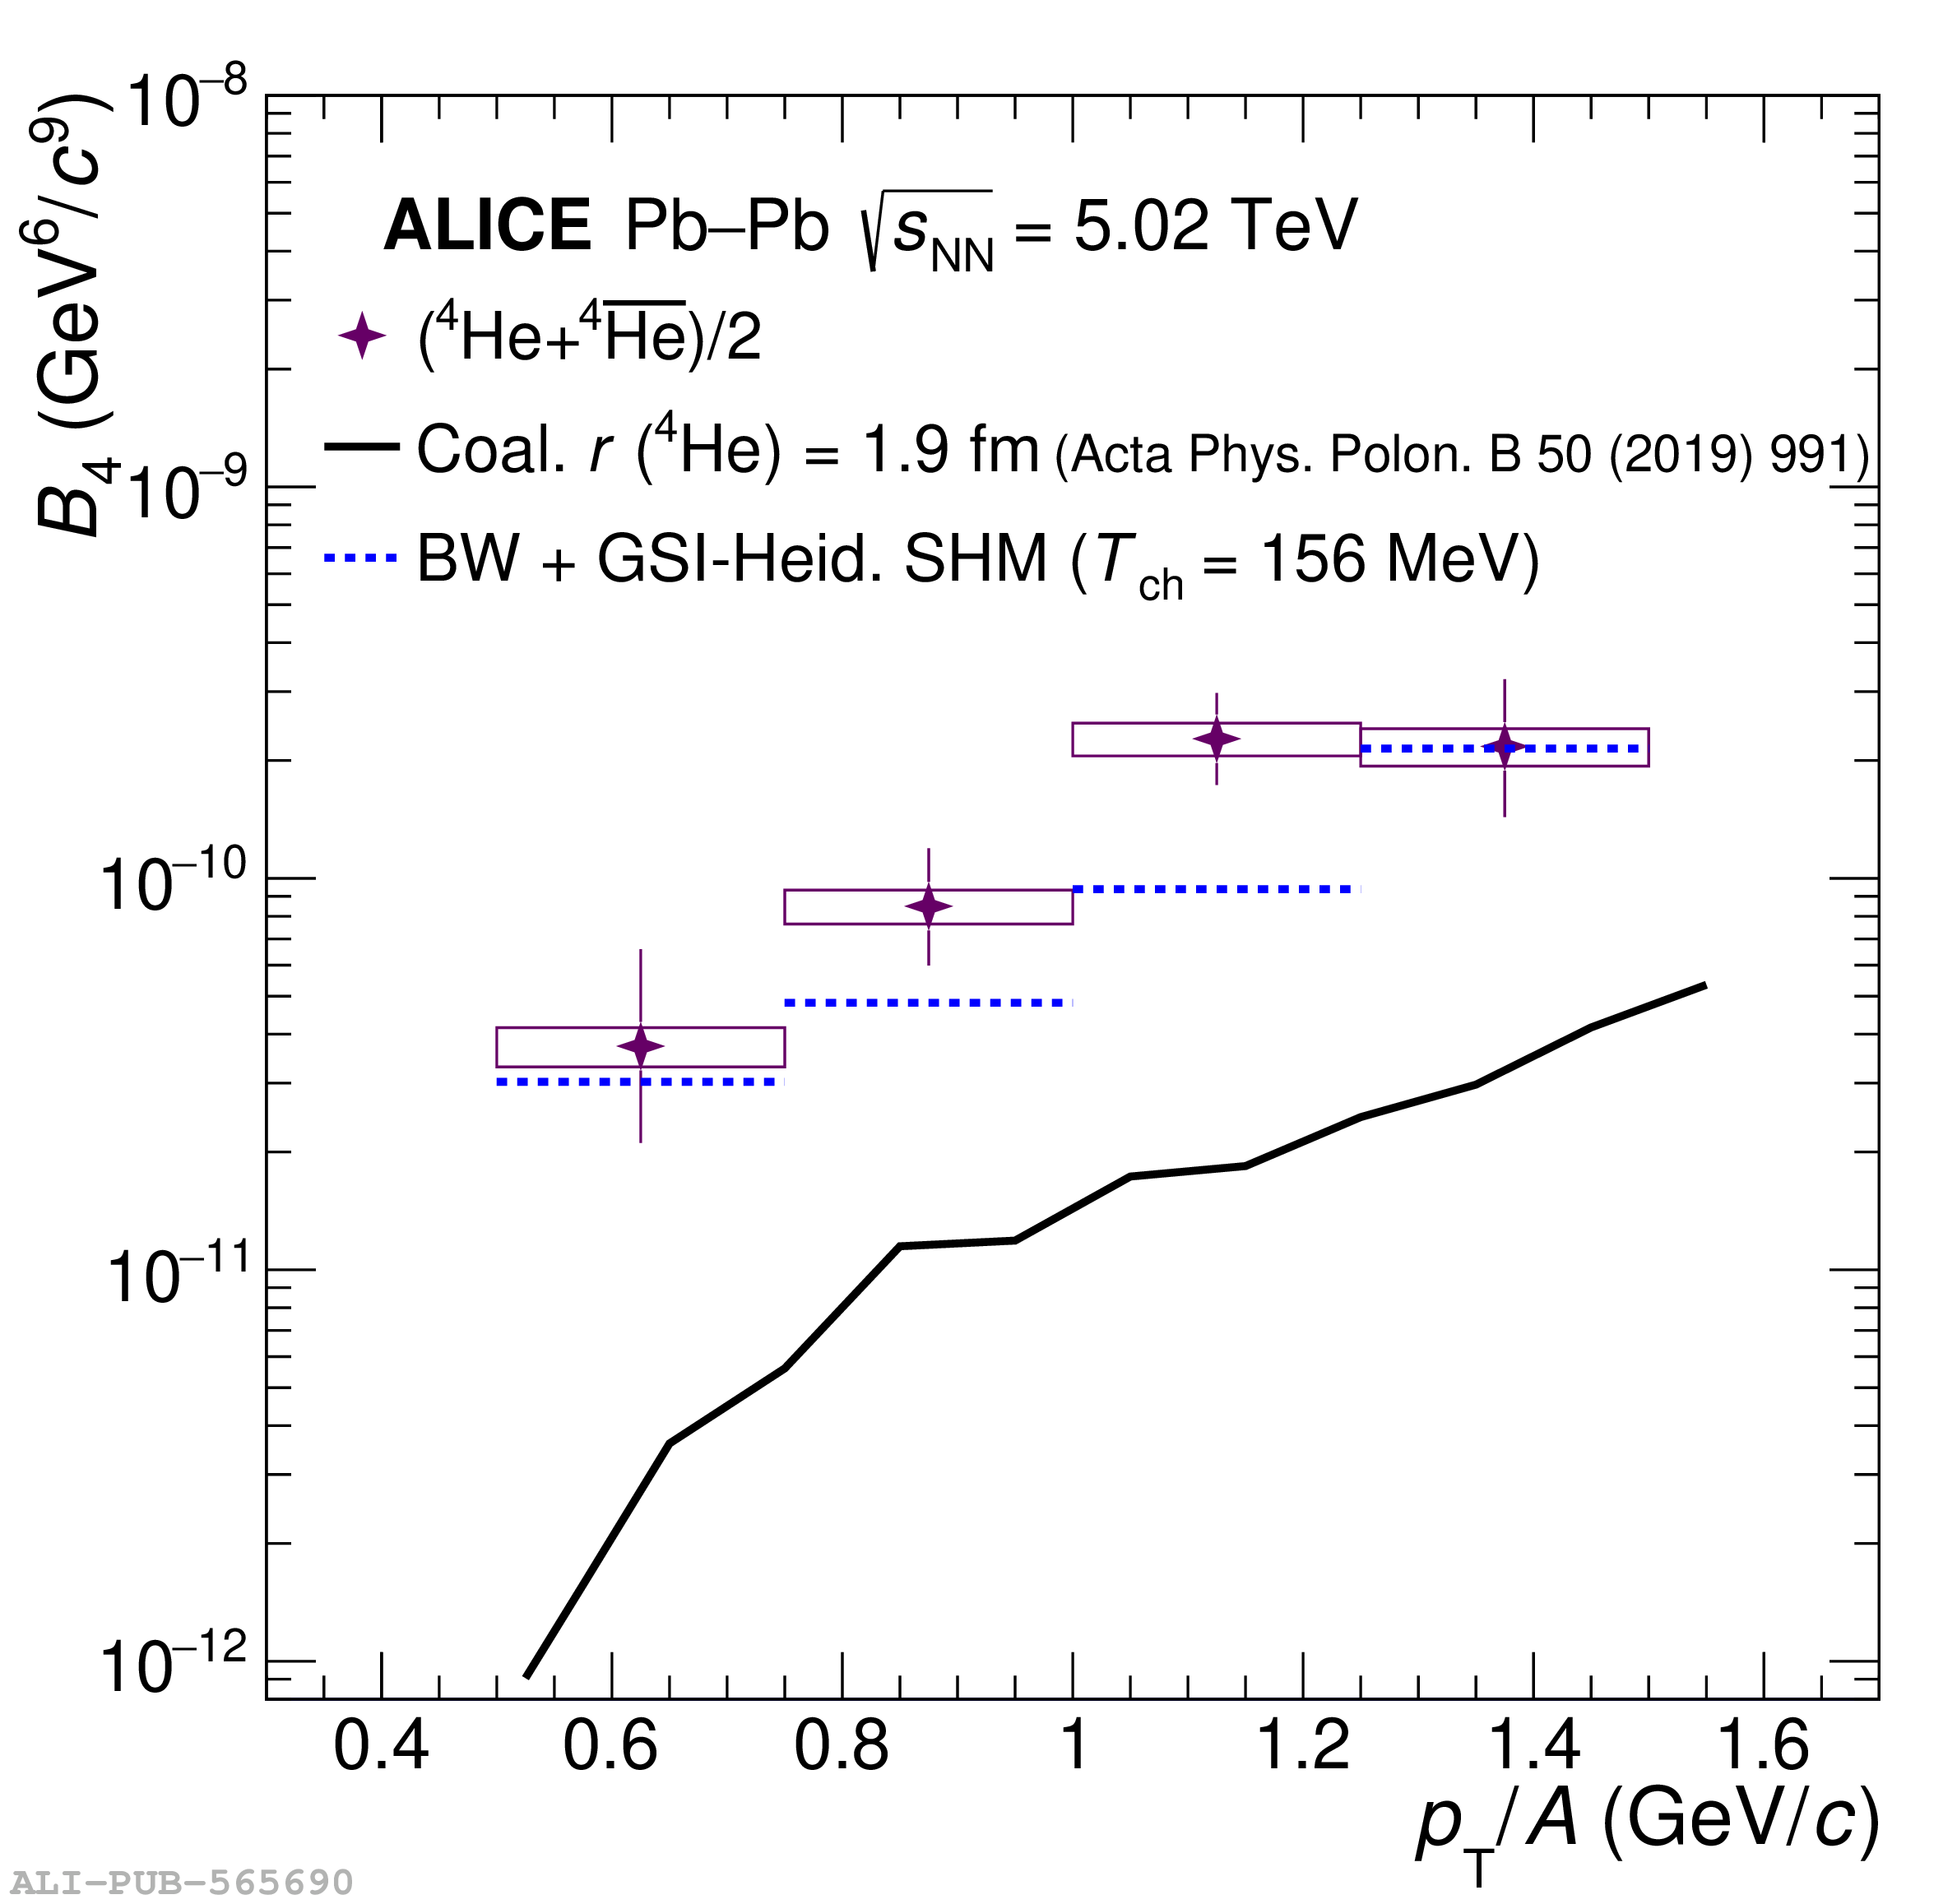 |
Figure 5
$^4$He/p ratios for the measured data points as a function of charged-particle multiplicity $\langle {\rm d}N_{\rm ch}/{\rm d}\eta \rangle_{|\eta_{\rm lab}|0.5}$ compared to model predictions. For comparison the result from the 10\% most central Pb-Pb collisions at $\sqrt{s_\mathrm{NN}} = 2.76$ TeV and the upper limit at 90% CL from p-Pb collisions at $\sqrt{s_\mathrm{NN}} = 5.02$ TeV is also shown. The thermal model curves are from the CSM . For the coalescence model two different approaches are displayed: analytical and UrQMD hybrid coalescence . The analytical coalescence is shown for five different substructures and the thickness of the bands reflects the uncertainties of the calculation. For the UrQMD model the band is representing the statistical uncertainty of the prediction. | 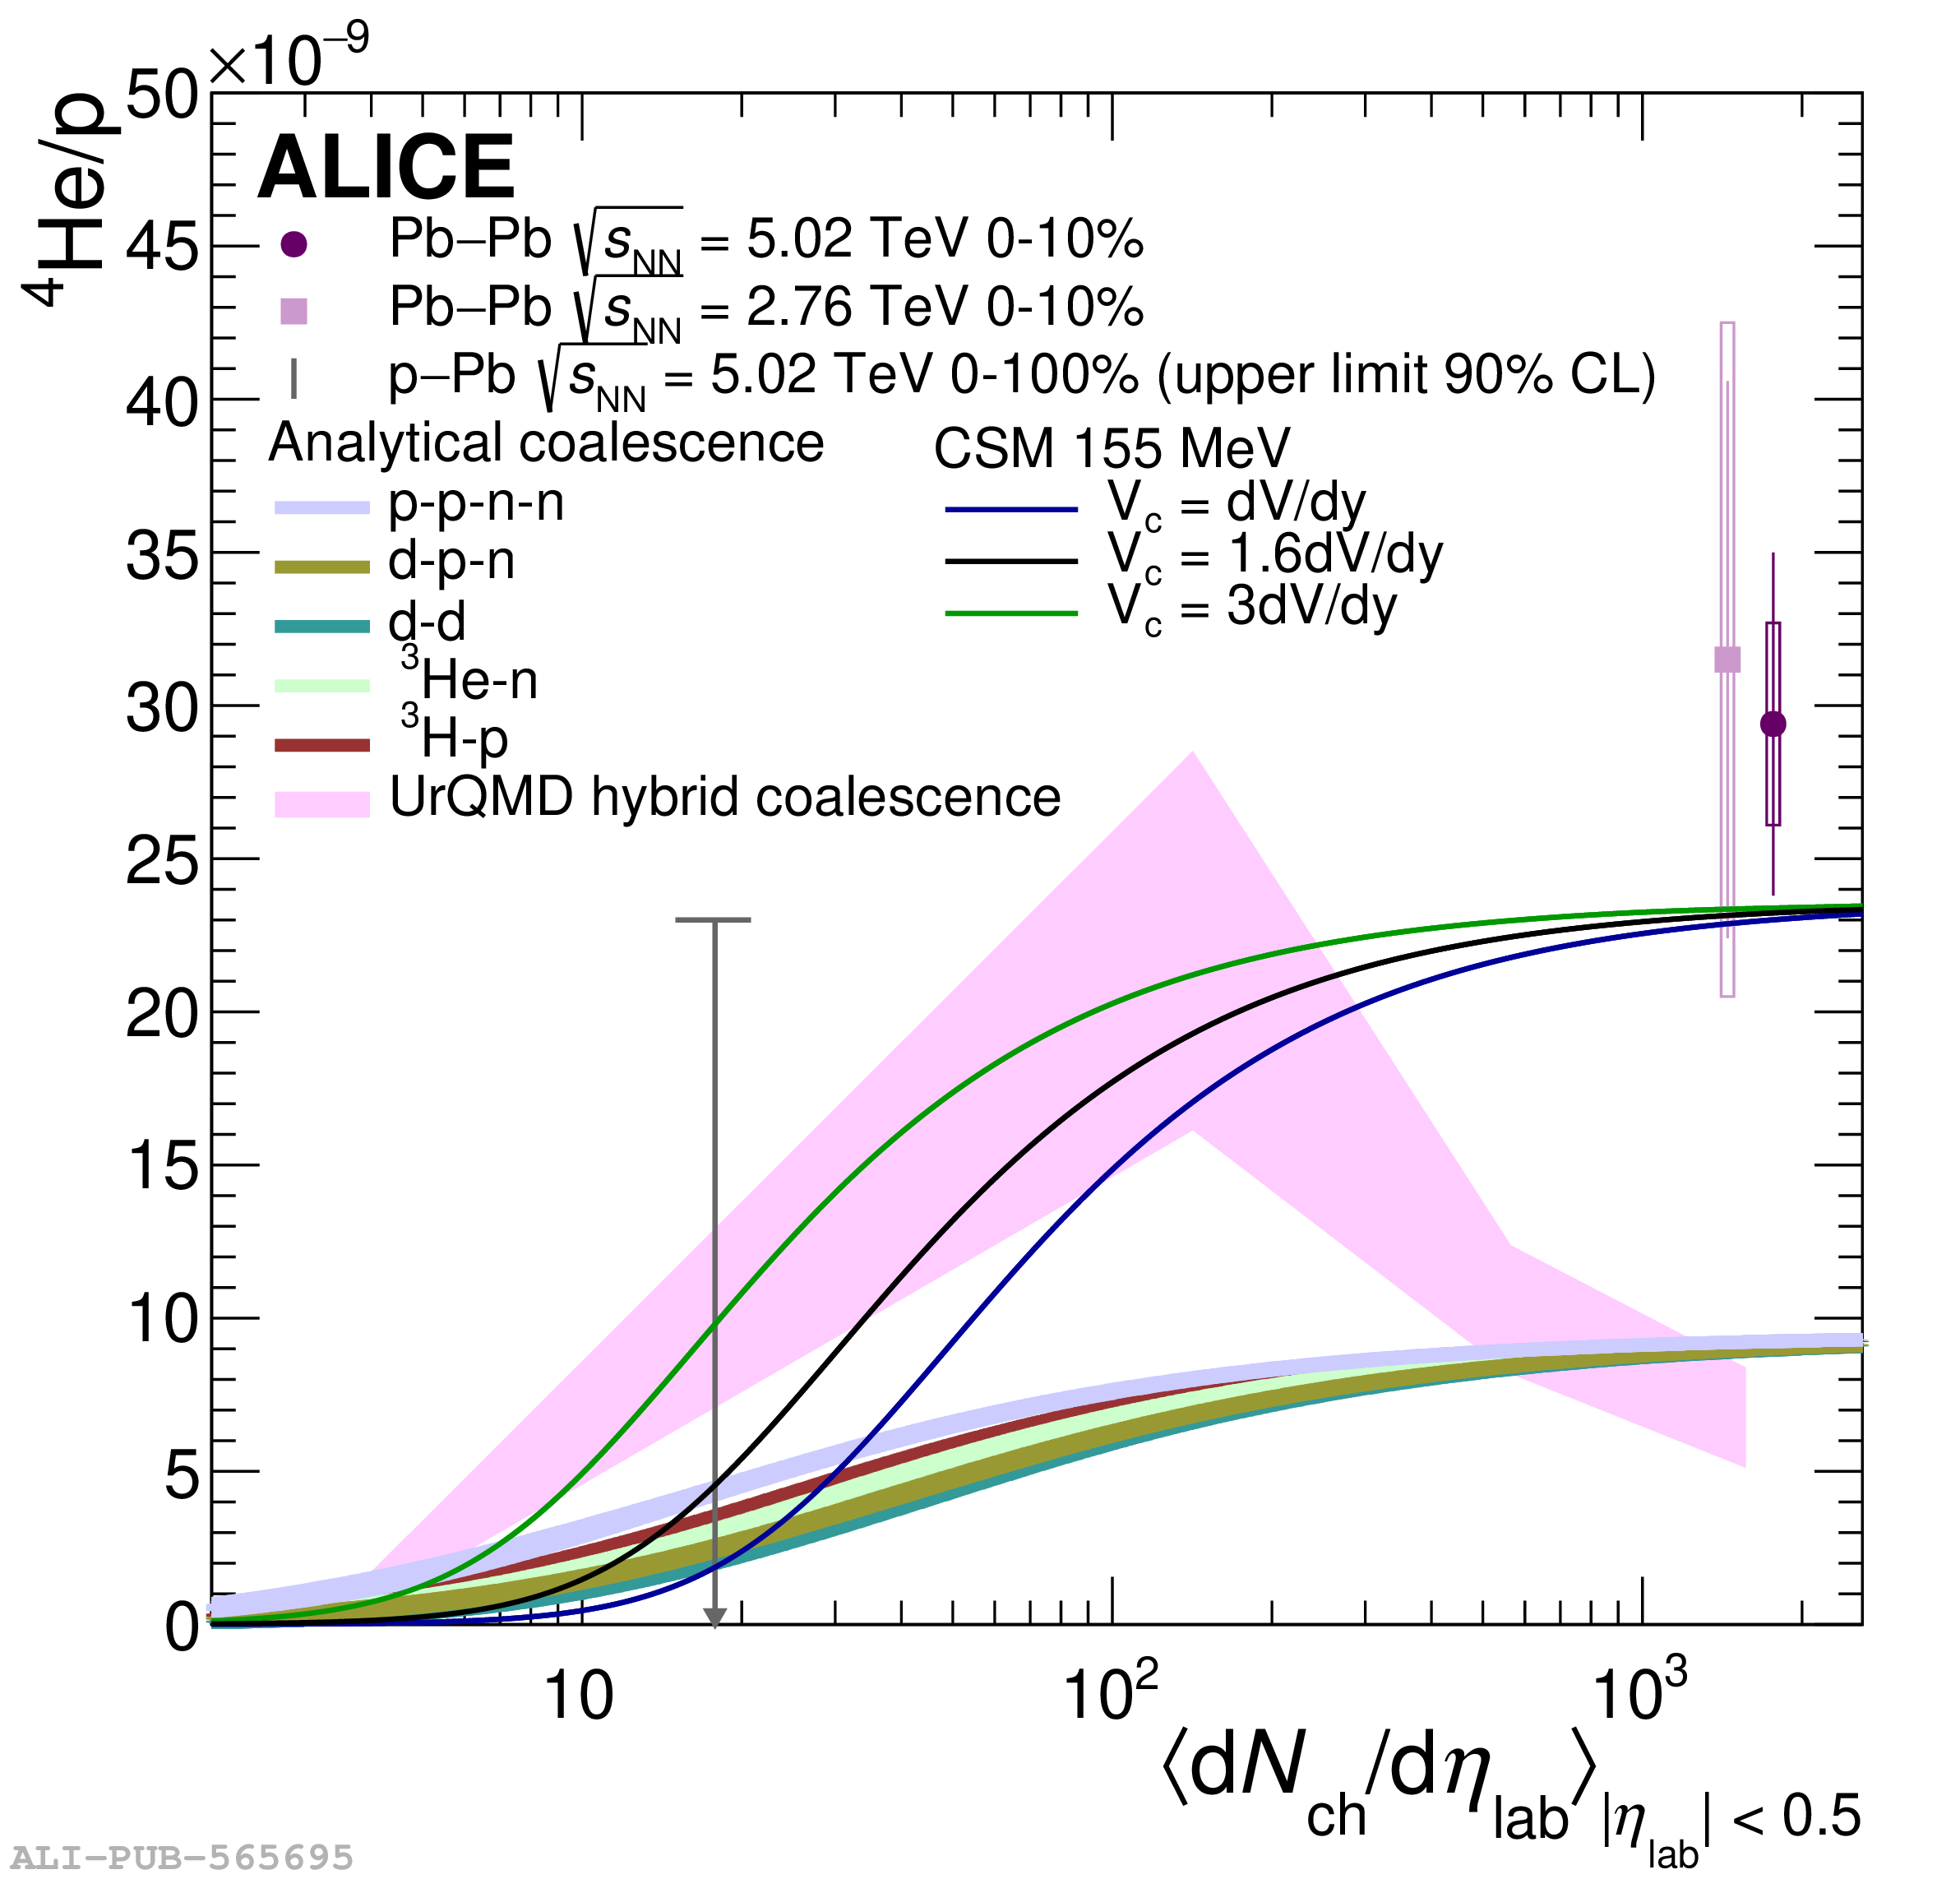 |