(Upper panel) The \pT spectra of \simplekstarch in inelastic pp collisions at \sqrtS = 5.02 and 13 TeV (full symbols) are compared to the \pT spectra of \Kpm mesons (open symbols) at the same energies . Statistical and systematic uncertainties are reported as error bars and boxes, respectively. Red, blue and black lines represent the \K spectra predicted with PYTHIA6-Perugia 2011 , PYTHIA8-Monash 2013 and EPOS-LHC , respectively. (Middle panels) The ratios of the rebinned predictions to the measured \pT distributions for \Kpm are reported in the two middle panels. The shaded bands represent the fractional uncertainties of the data points. (Bottom panels) The ratio of each measured \pT distribution for \simplekstarch mesons at \sqrtS = 5.02 (red points) and 13 TeV (black points) to the \K spectrum at the same collision energy is reported in the bottom panels. Red, blue and black lines represent the \simplekstarch/K ratio predicted with PYTHIA6-Perugia 2011 , PYTHIA8-Monash 2013 and EPOS-LHC , respectively. | 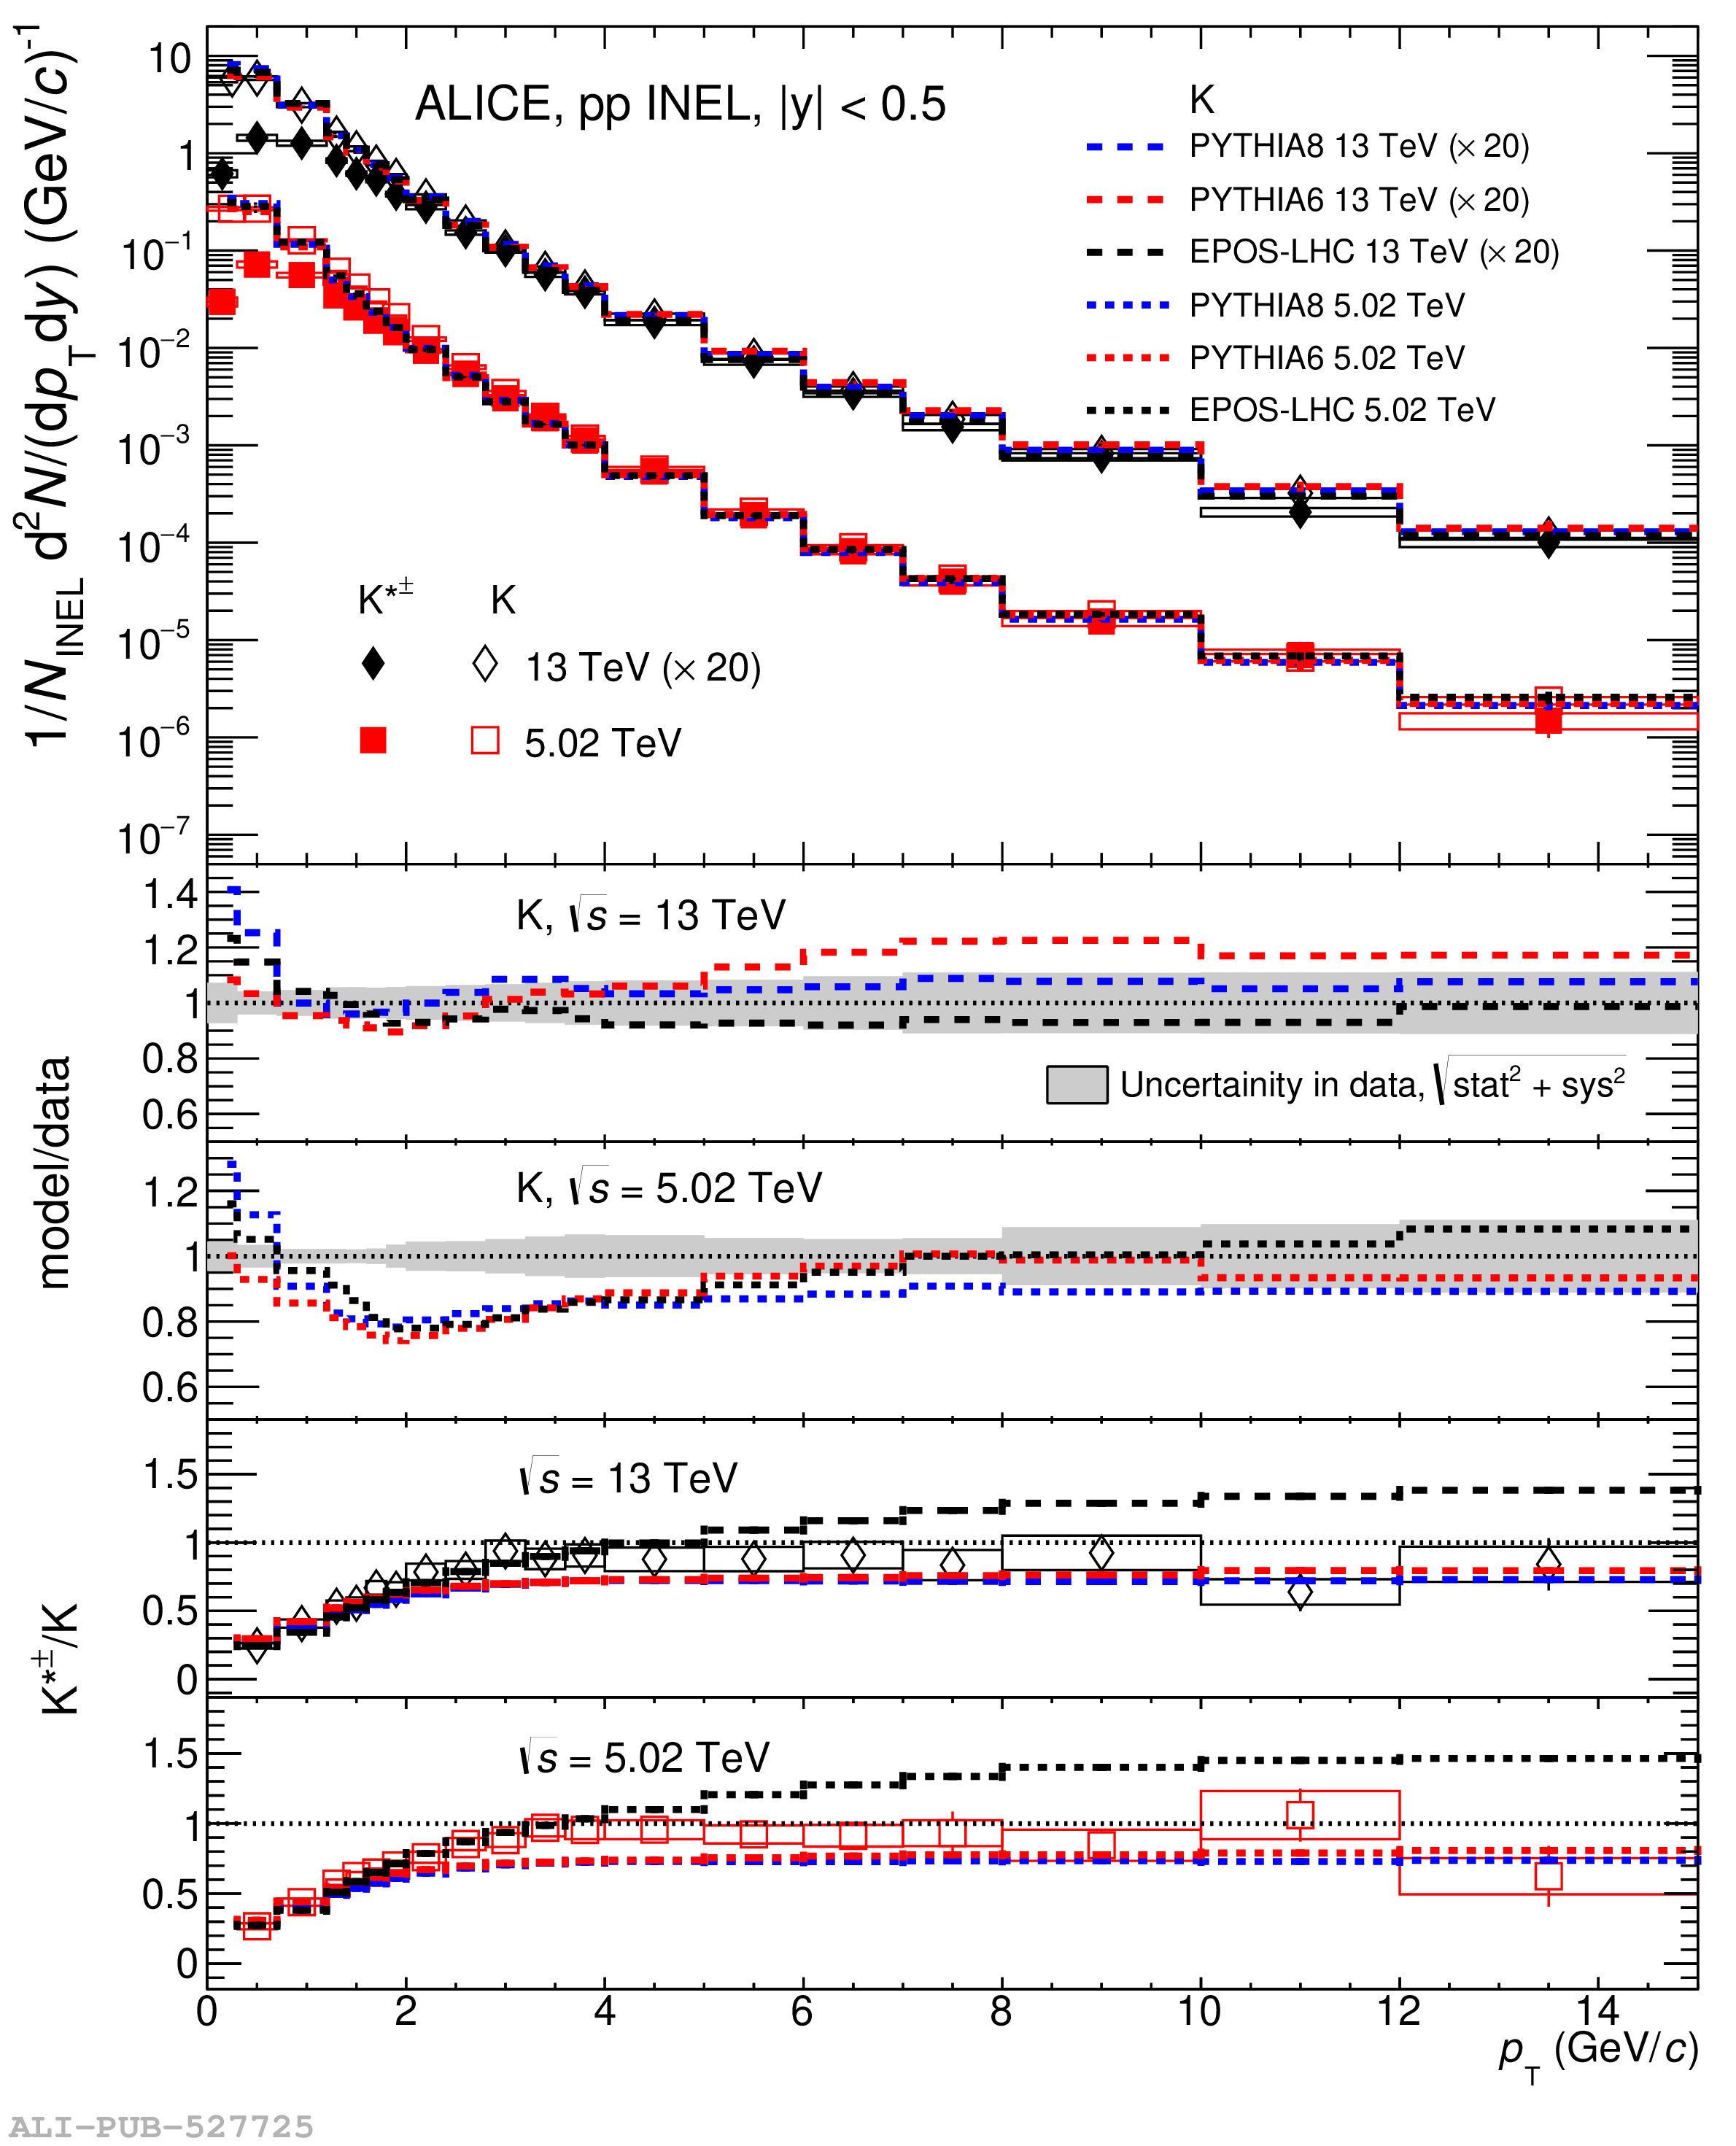 |