(Left panels) The \kshort\ppm invariant mass distributions at \modrap $<$ 0.5 in pp collisions at \sqrtS = 5.02, 8, and 13 TeV. The background shape estimated by the event-mixing technique is shown with empty red circles. Statistical uncertainties are shown with error bars (Right panels) The \kshort\ppm invariant mass distributions in pp collisions at \sqrtS = 5.02, 8, and 13 TeV after background subtraction. The solid red curve is the result of the fit with Eq. \ref{eqn1}; the dashed red line describes the residual background distribution given by Eq. \ref{eqn2}. Statistical uncertainties are shown with error bars. |  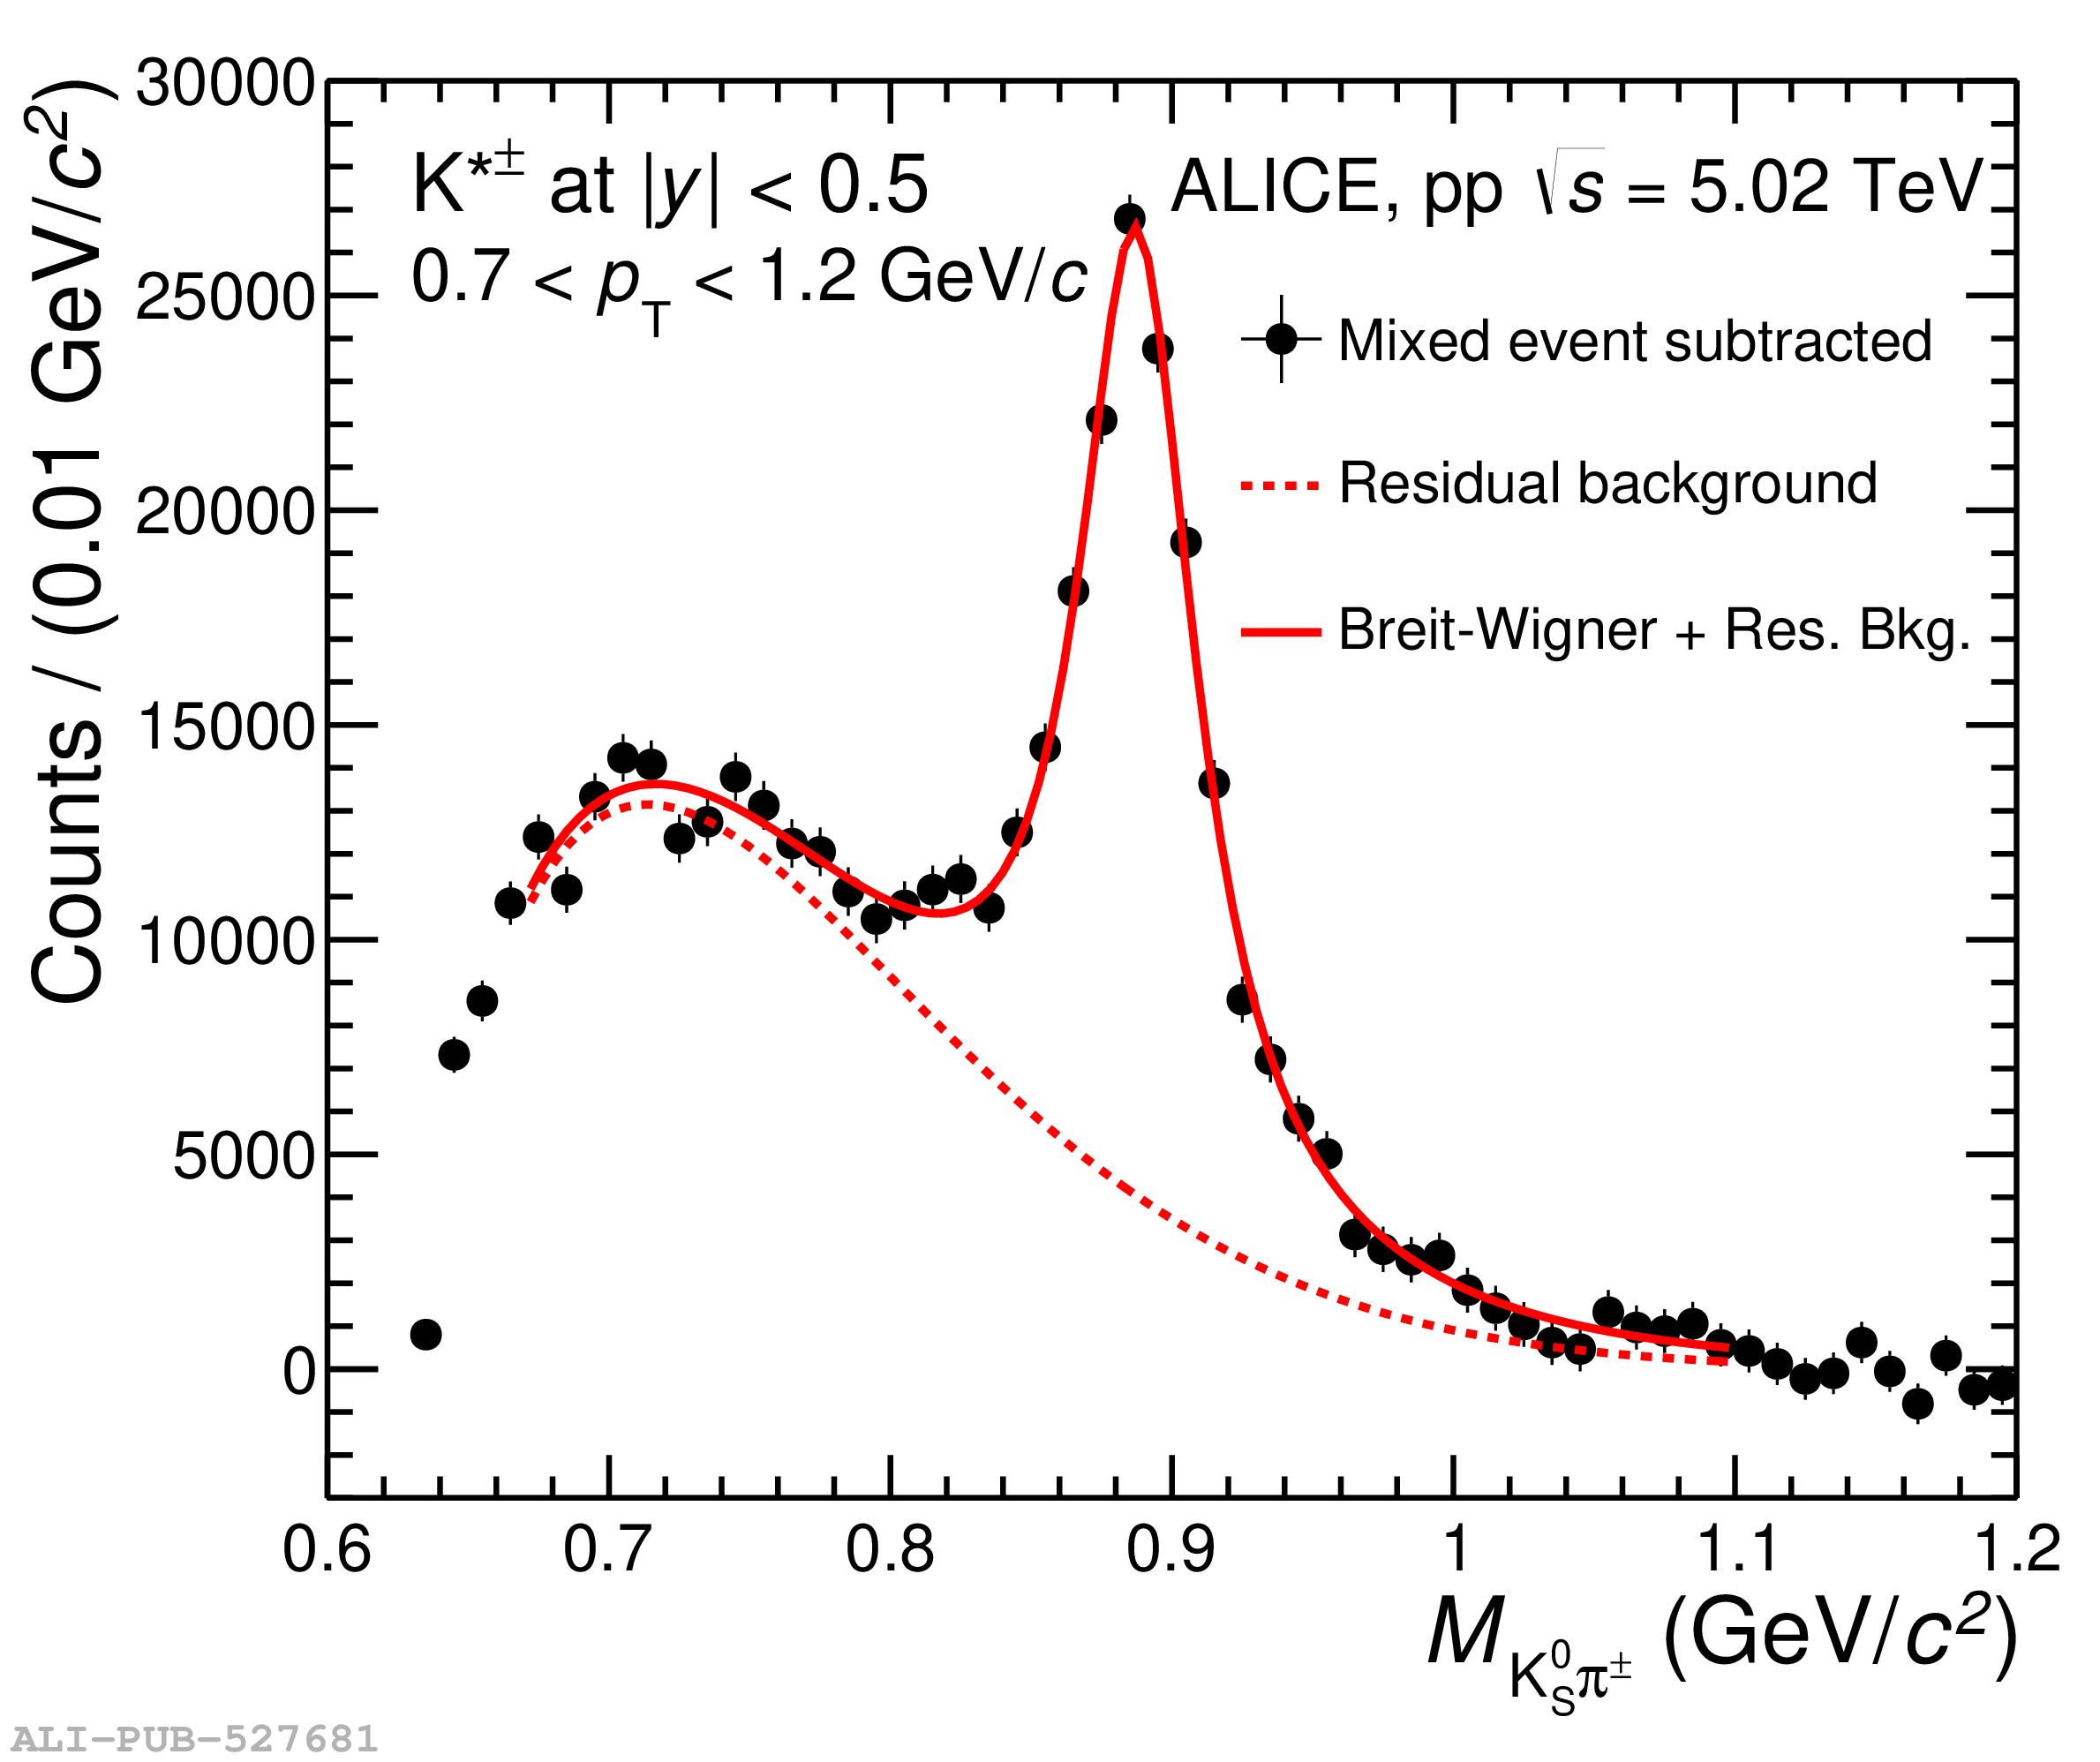 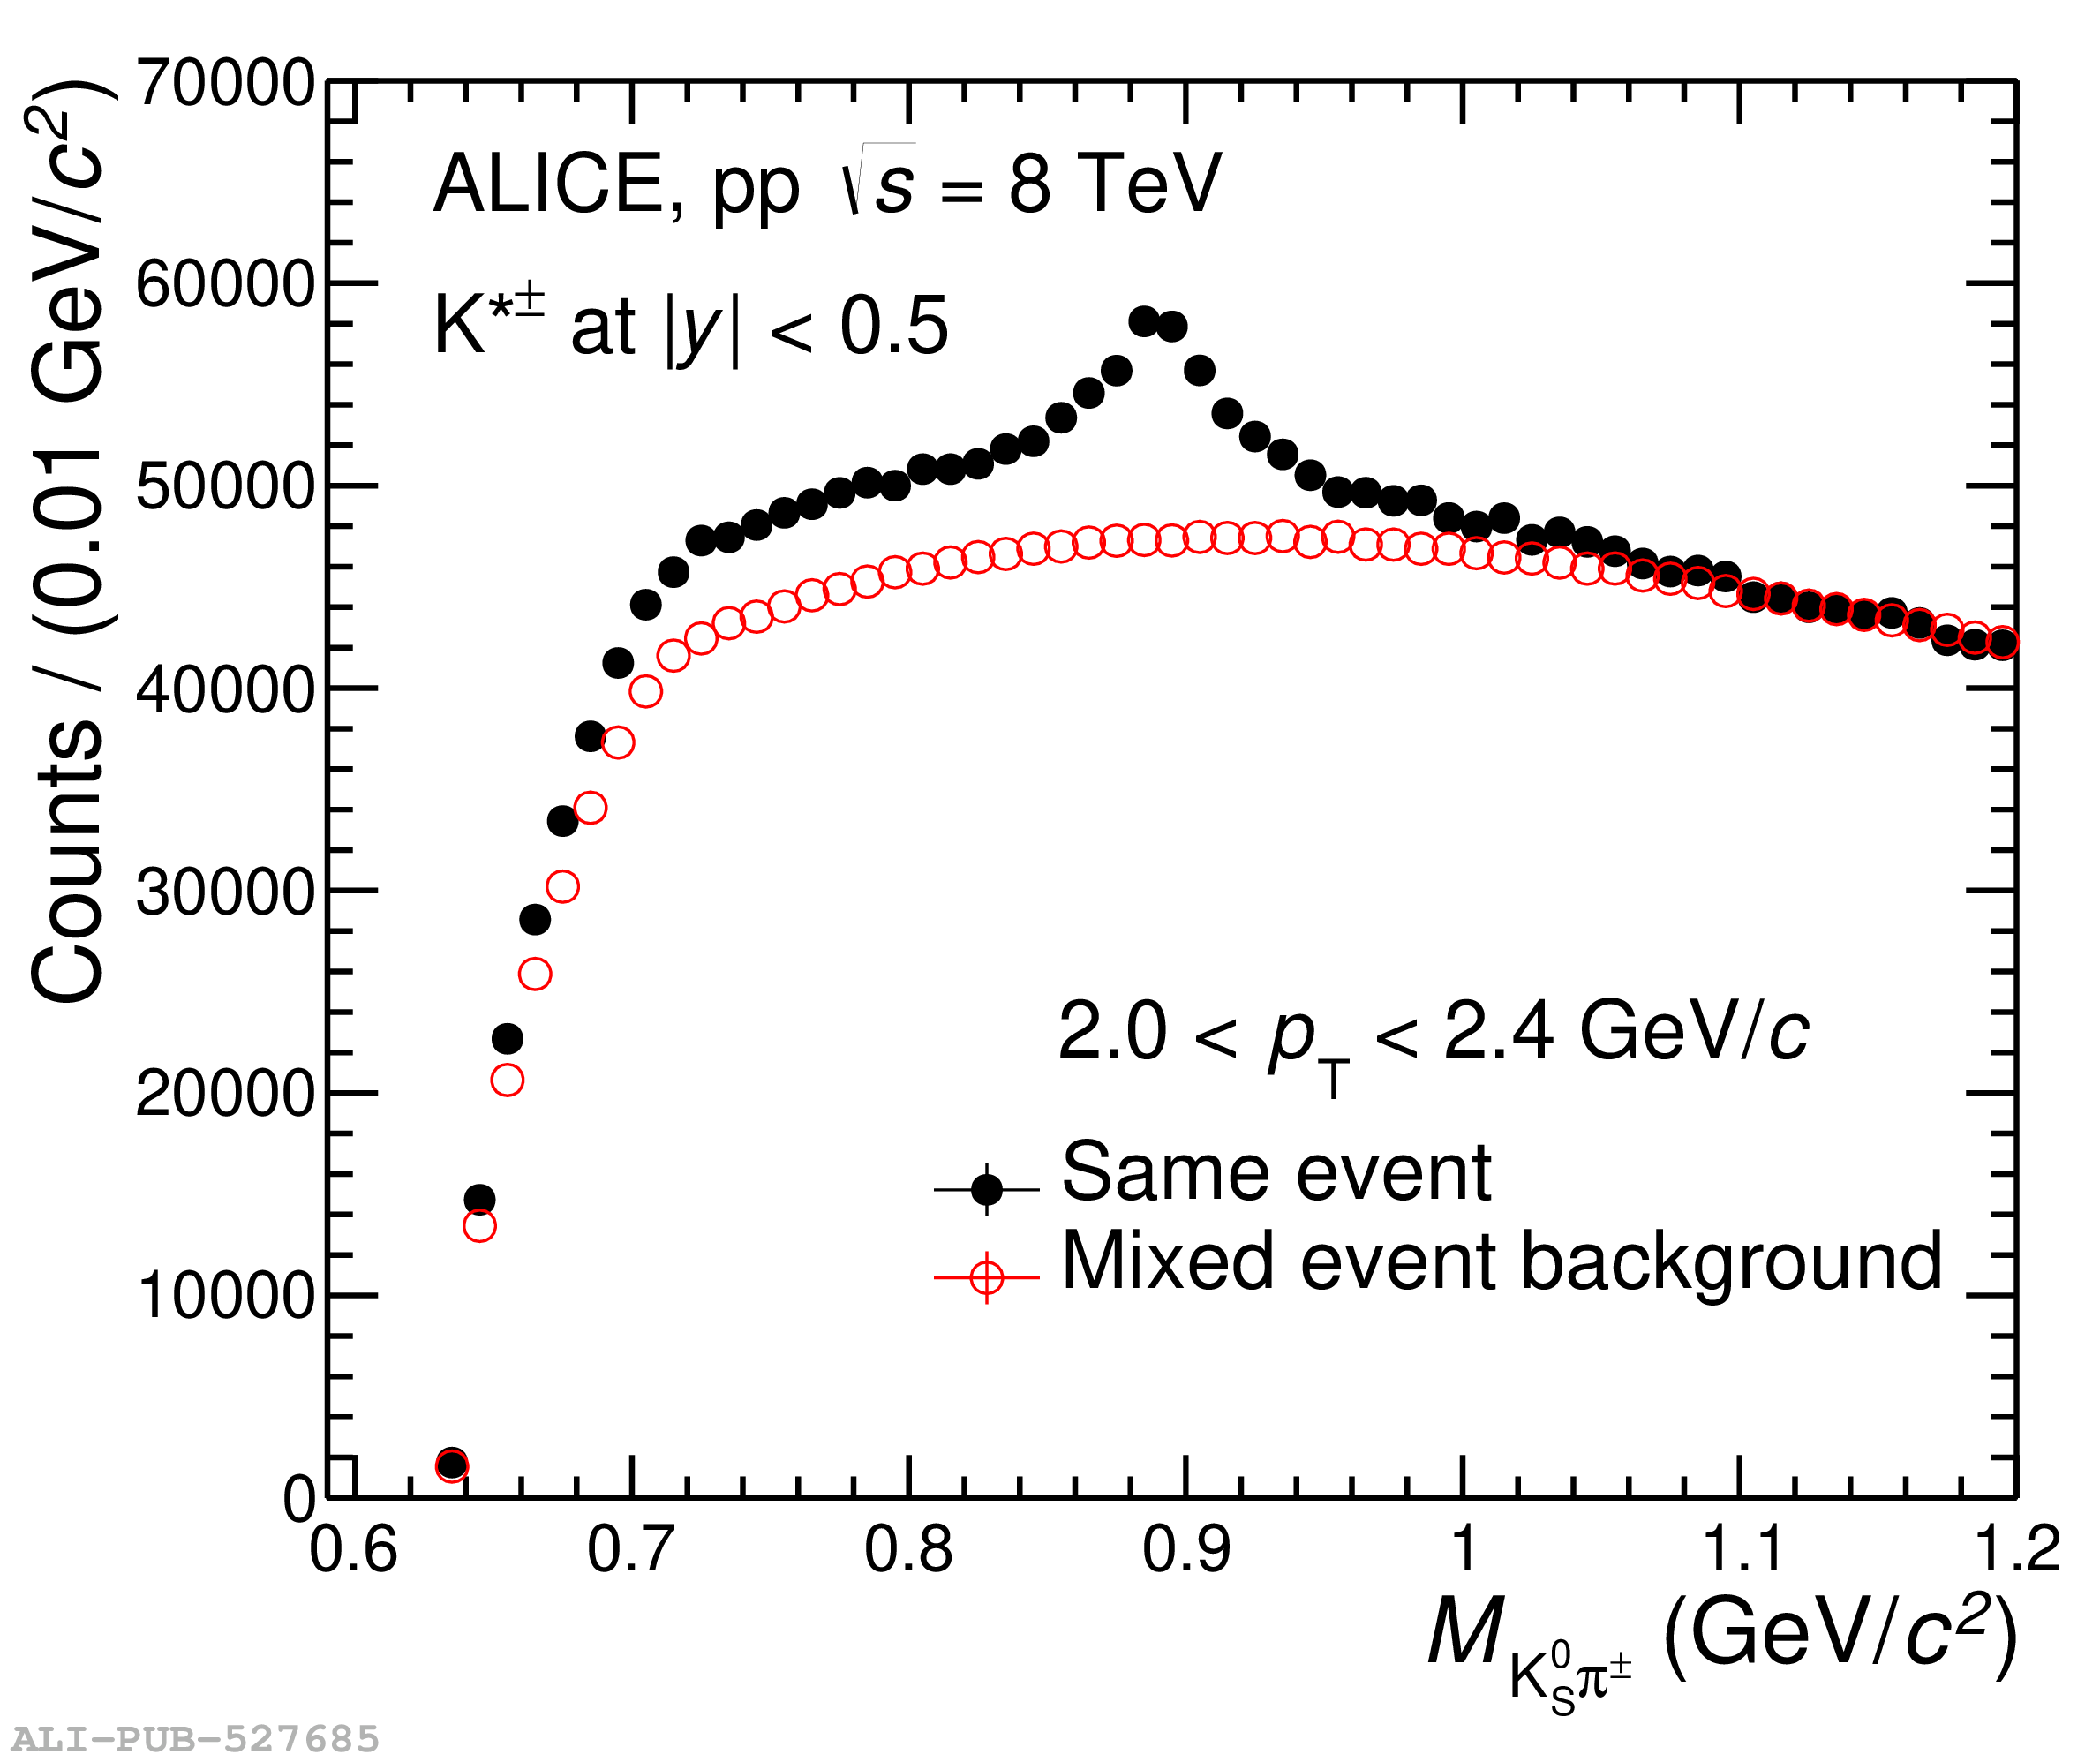 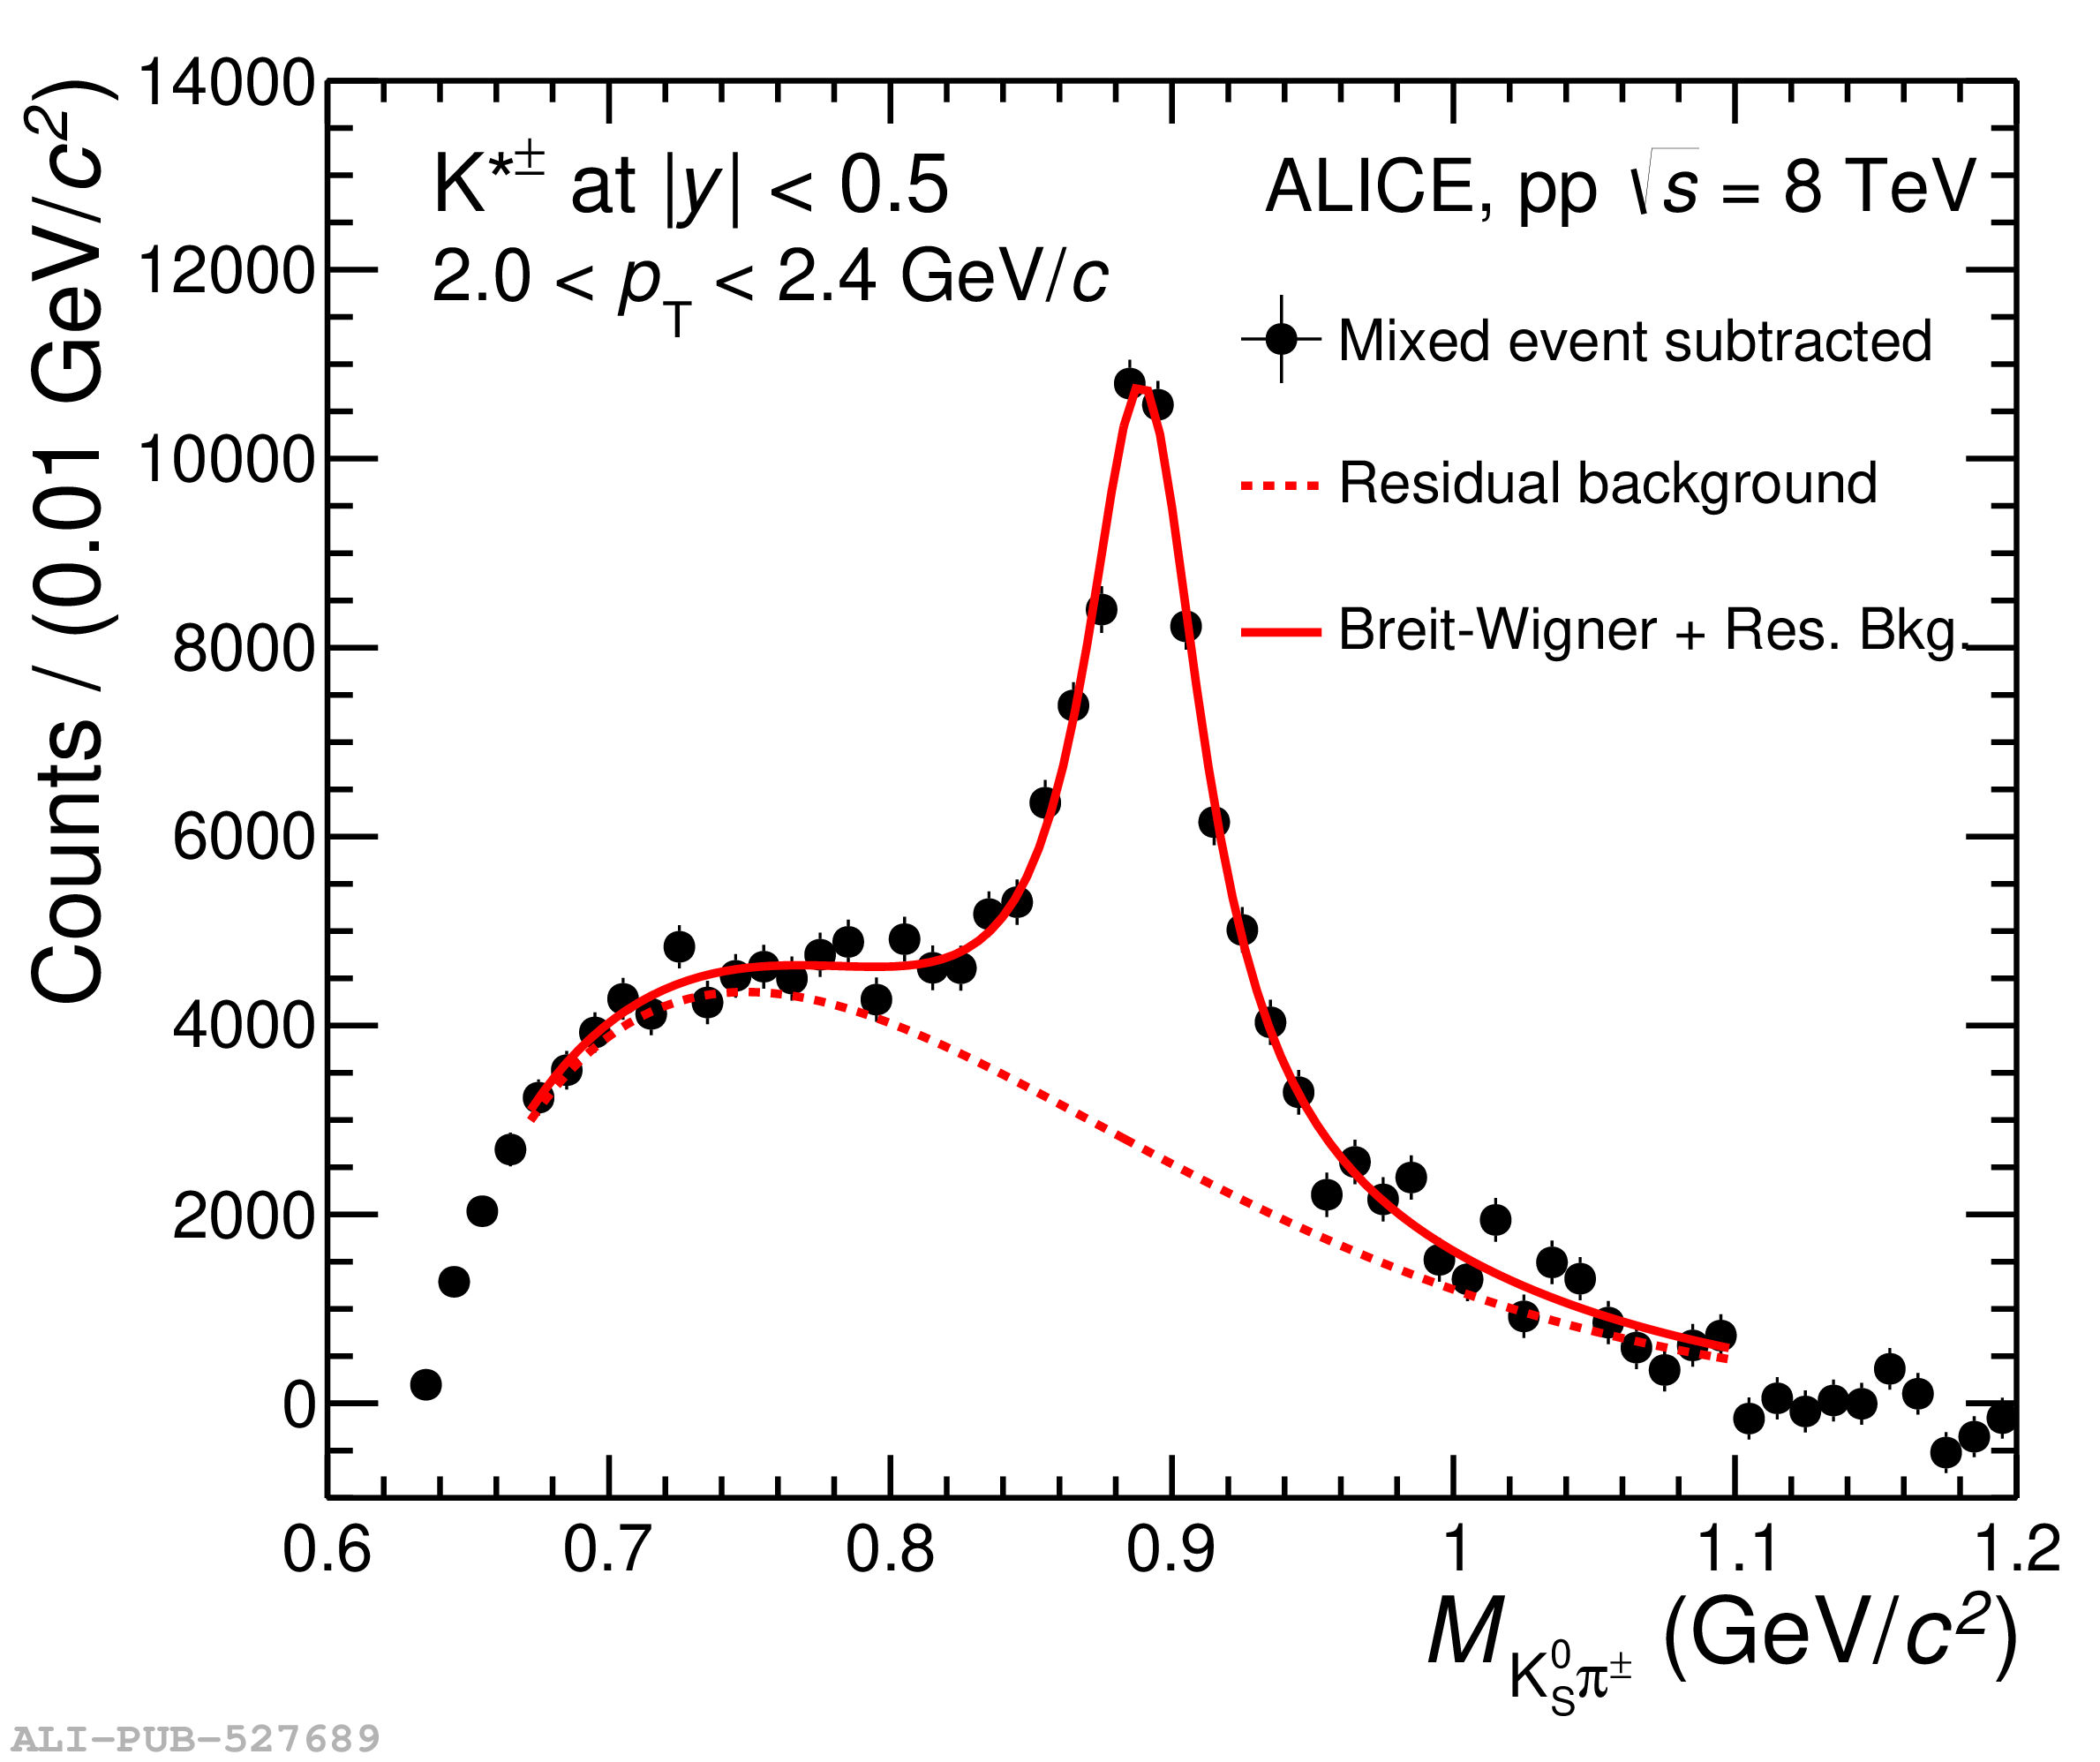  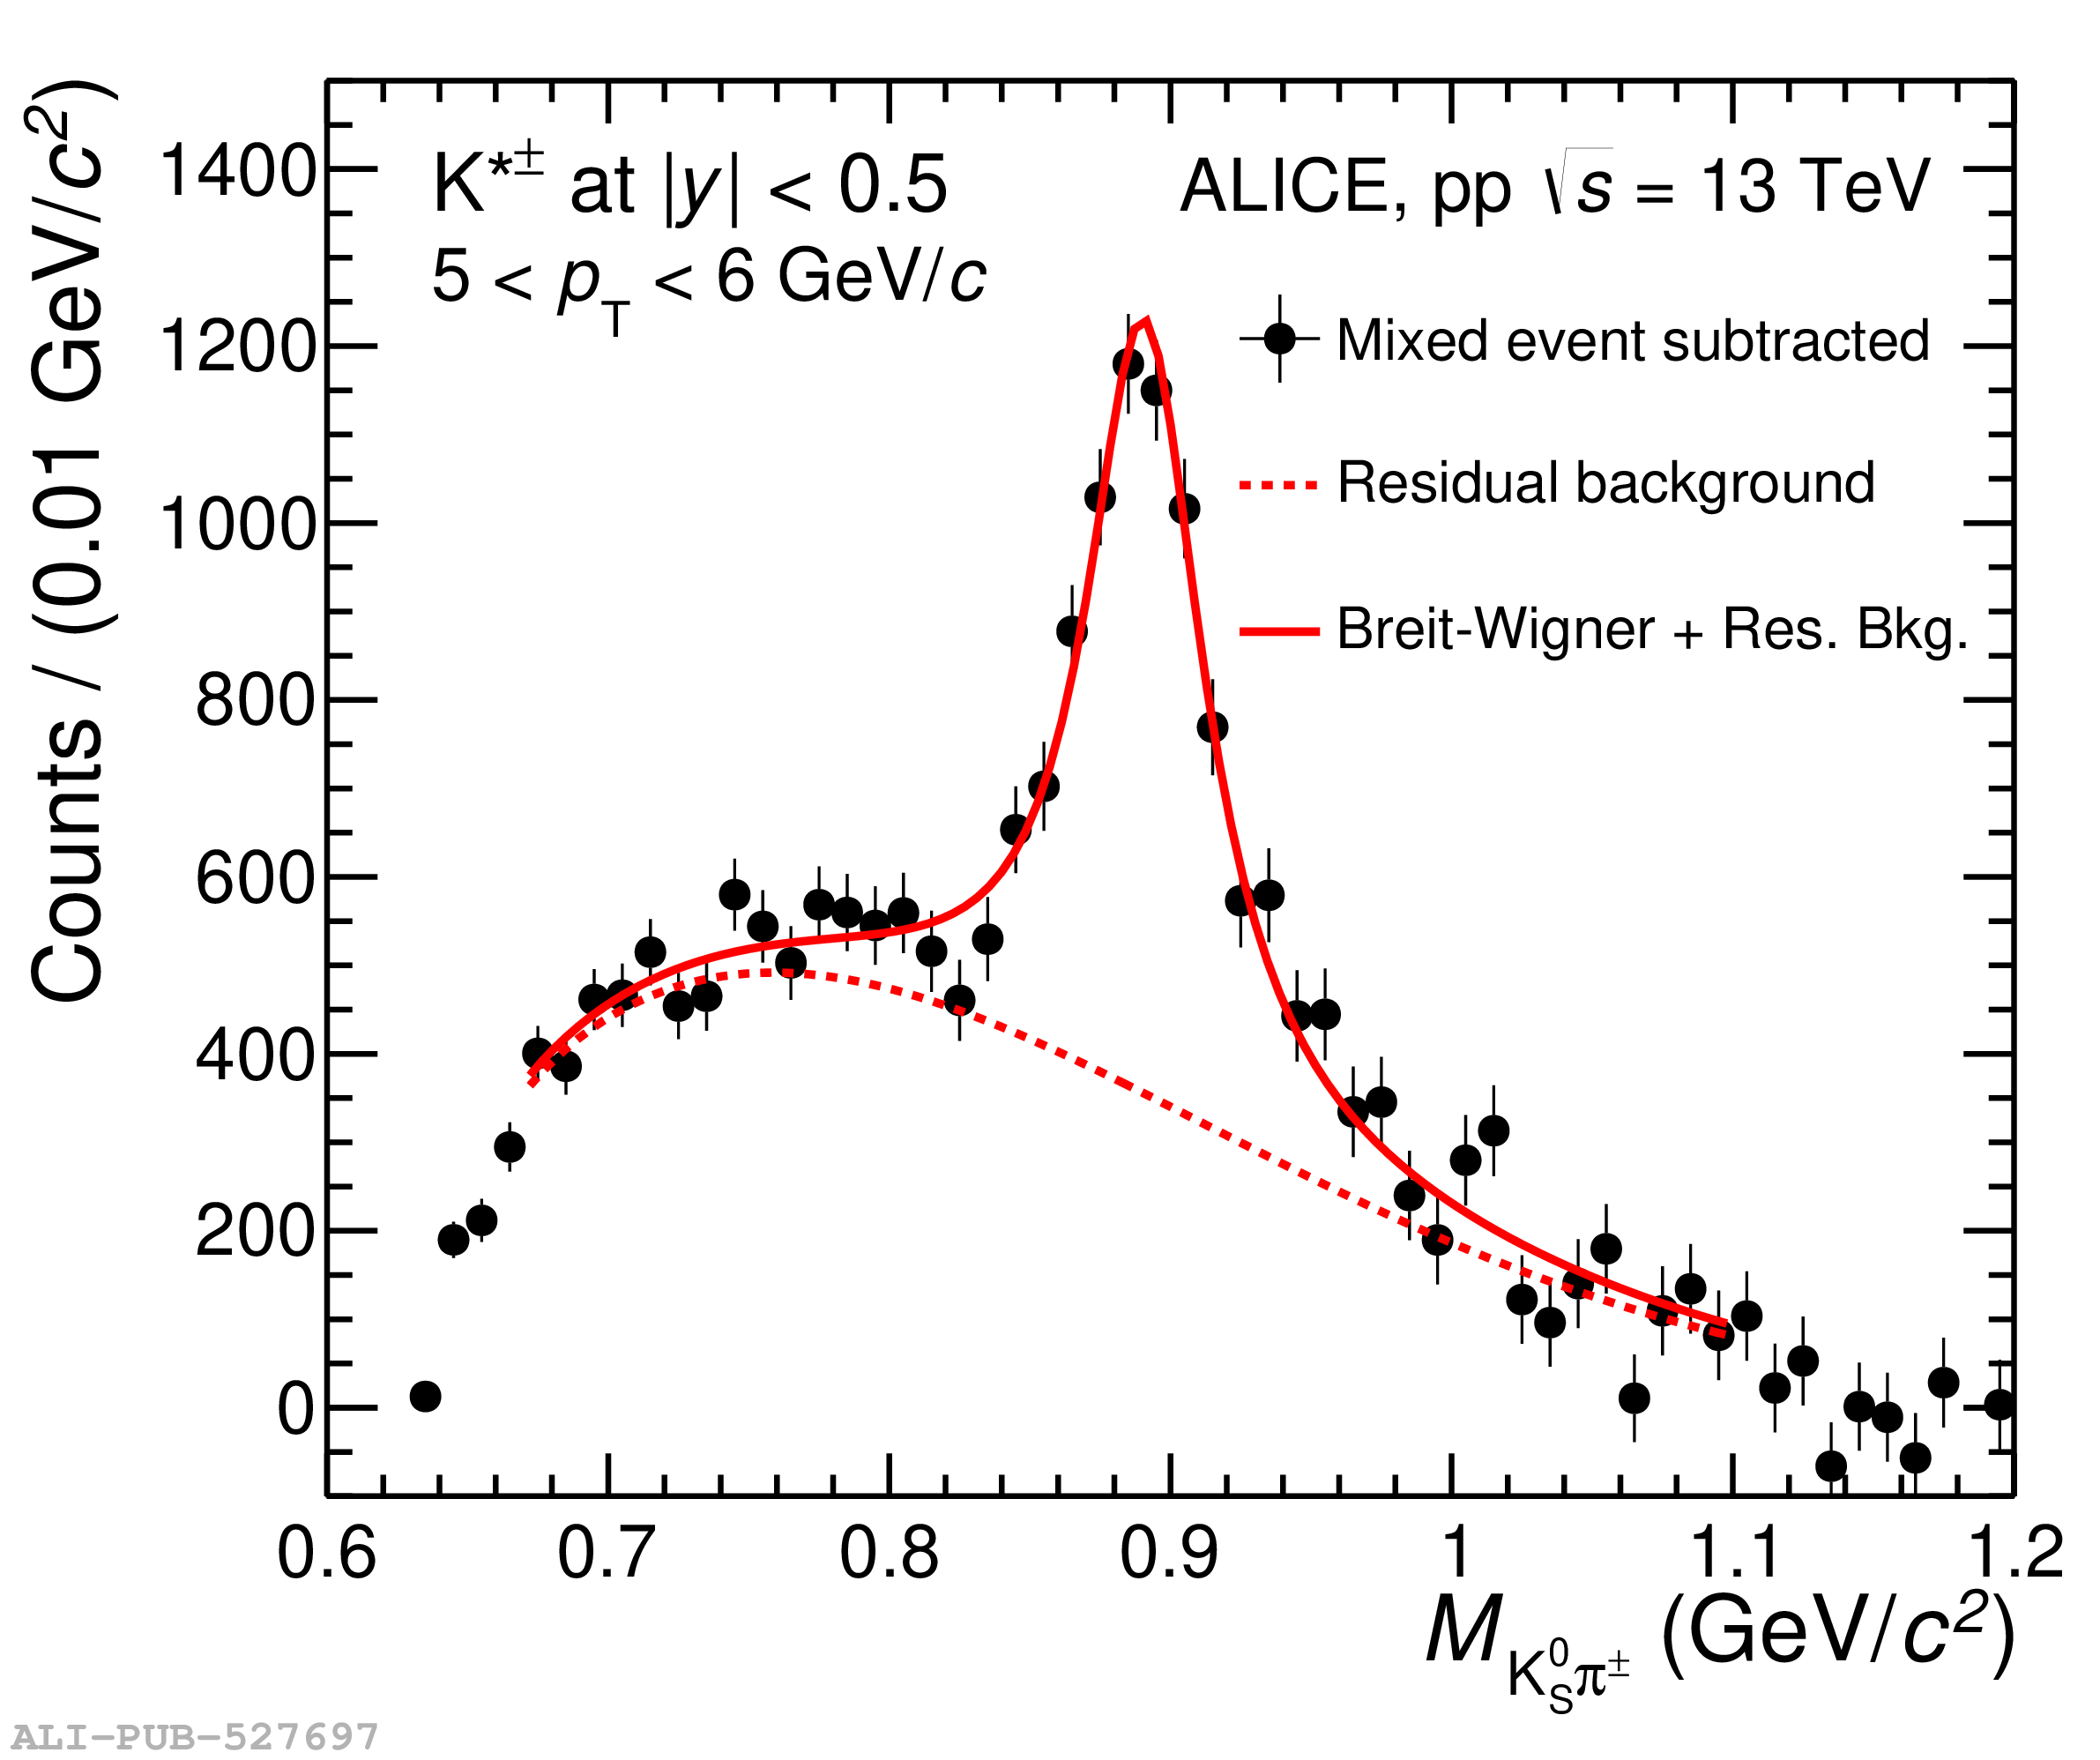 |