Near-side associated peak yields (top row) and widths (third row) measured in pp collisions at $\sqrt{s}$ = 13 TeV, for the four V0M multiplicity classes, shown with different marker styles. The ratios of yield (width) values in each V0M class with respect to those in the V0M class I are shown in the second (fourth) row. Results are presented as a function of the $\Dzero$-meson $\pt$, for $\ptass>$ 0.3 \GeVc and the sub-ranges 0.3 $<\ptass<$ 1 \GeVc, 1 $<\ptass<$ 2 \GeVc, and 2 $<\ptass<$ 3 \GeVc (from left to right). Statistical and systematic uncertainties are shown as vertical error bars and boxes, respectively. | 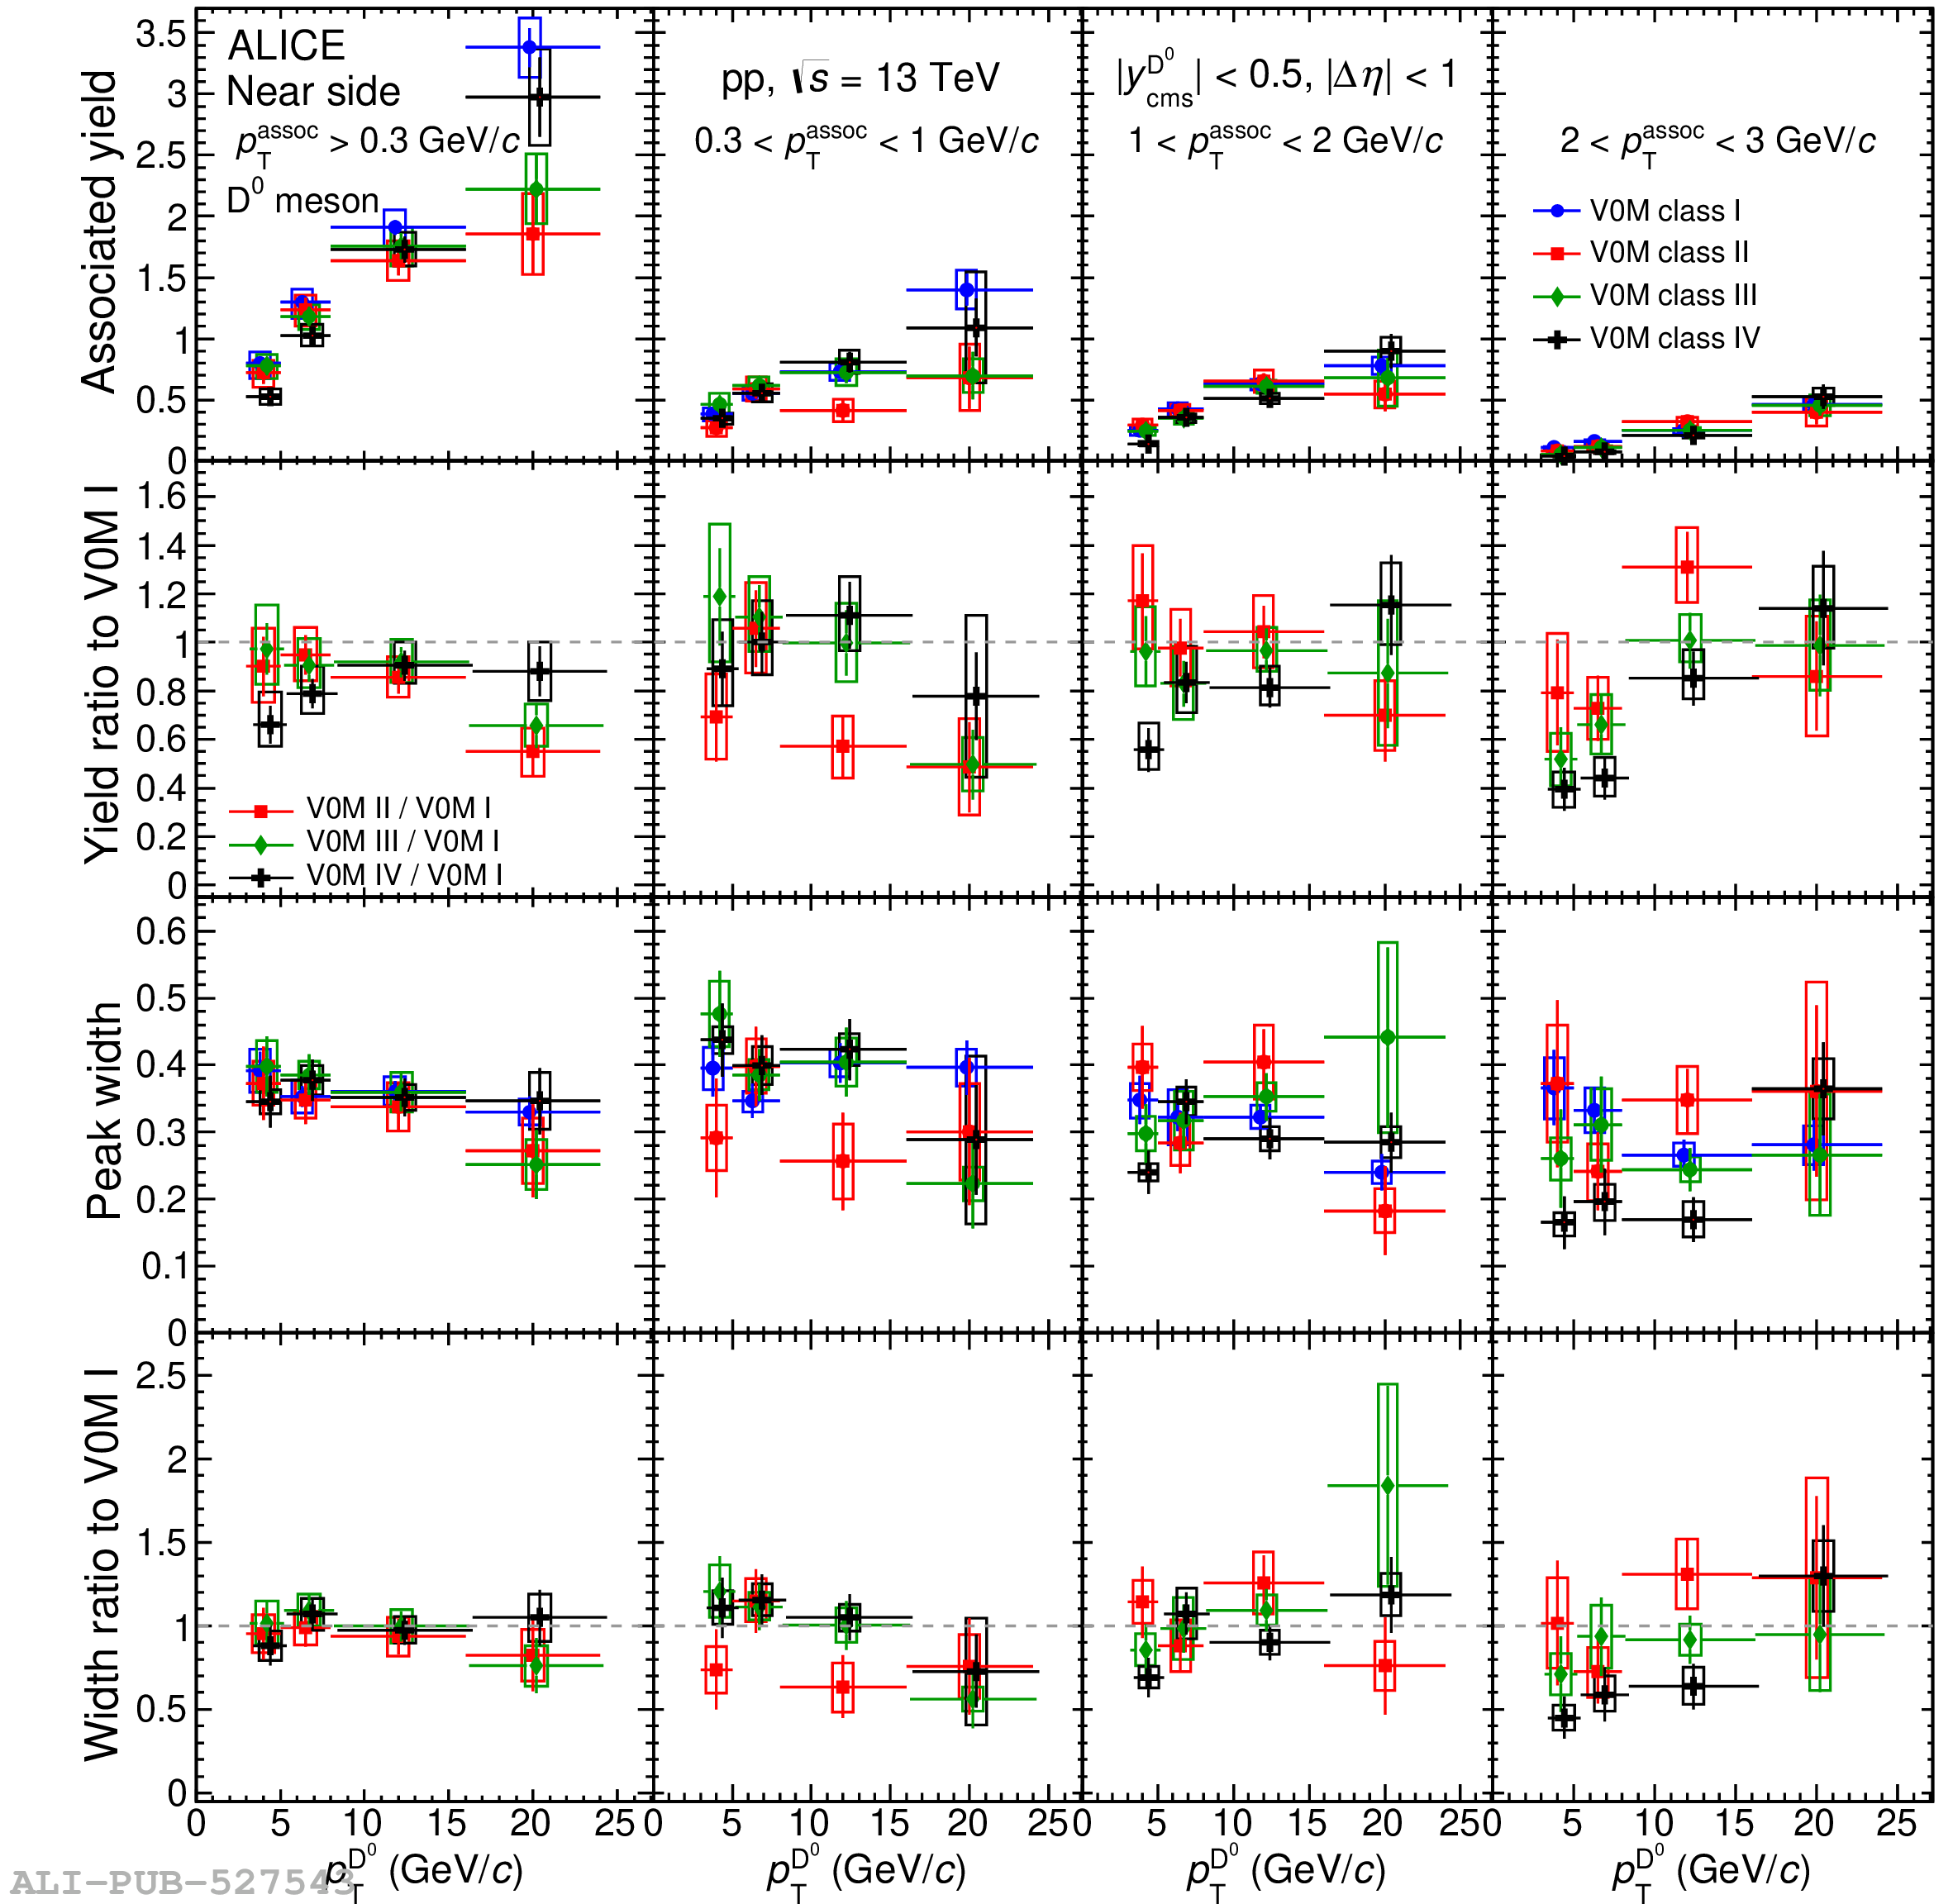 |