Top: Self-normalized yield of $\Upsilon$ as a function of self-normalized charged-particle multiplicity, compared to inclusive J/$\psi$ measured in the forward rapidity region at 5.02 TeV , 7 TeV , and 13 TeV , and to inclusive J/$\psi$ measured in the central rapidity region at 13 TeV . The error bars represent the statistical uncertainty on the quarkonium yields, while the quadratic sum of the point-by-point systematic uncertainties on the quarkonium yields as well as on $\textrm{d}N_{\mathrm{ch}} / \textrm{d}\eta$ / $\langle \textrm{d}N_{\mathrm{ch}}/\textrm{d}\eta \rangle$ is depicted as boxes. Bottom: Self-normalized yield ratio of $\Upsilon$(1S) over J/$\psi$ as a function of self-normalized charged-particle multiplicity, compared to model computations from 3-pomeron CGC approach , PYTHIA 8.2 , comovers , and CPP .. |  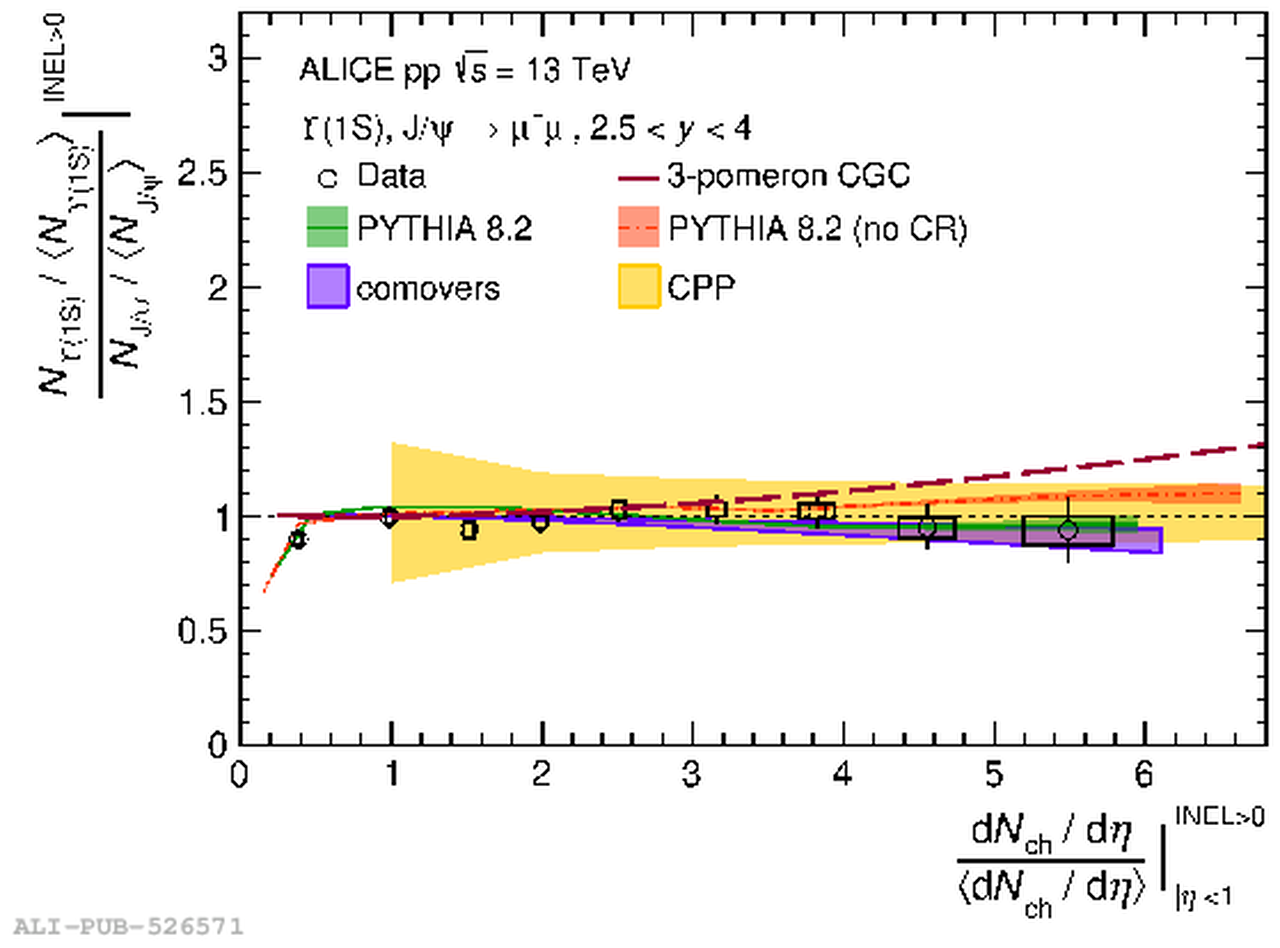 |