Understanding the role of parton mass and Casimir colour factors in the quantum chromodynamics parton shower represents an important step in characterising the emission properties of heavy quarks. Recent experimental advances in jet substructure techniques have provided the opportunity to isolate and characterise gluon emissions from heavy quarks. In this work, the first direct experimental constraint on the charm-quark splitting function is presented, obtained via the measurement of the groomed shared momentum fraction of the first splitting in charm jets, tagged by a reconstructed ${\rm D}^0$ meson. The measurement is made in proton-proton collisions at $\sqrt{s}$ = 13 TeV, in the low jet transverse-momentum interval of $15 \leq p_{\rm T}^{\rm jet~ch} <~ 30$ GeV/$c$ where the emission properties are sensitive to parton mass effects. In addition, the opening angle of the first perturbative emission of the charm quark, as well as the number of perturbative emissions it undergoes, is reported. Comparisons to measurements of an inclusive-jet sample show a steeper splitting function for charm quarks compared with gluons and light quarks. Charm quarks also undergo fewer perturbative emissions in the parton shower, with a reduced probability of large-angle emissions.
Phys. Rev. Lett. 131 (2023) 192301
HEP Data
e-Print: arXiv:2208.04857 | PDF | inSPIRE
CERN-EP-2022-171
Figure group
Figure 1
The $z_{\rm g}$ distribution of prompt $\Dzero$-tagged jets compared to that of inclusive jets for $15 \leq p_{\rm T}^{\rm jet\,ch} \leq 30$ GeV/$c$ in pp collisions at $\sqrt{s}$ = 13 TeV, normalised to the total number of jets. Model/data ratios are shown in the bottom panels for PYTHIA 8 and POWHEG + PYTHIA 6 simulations. | 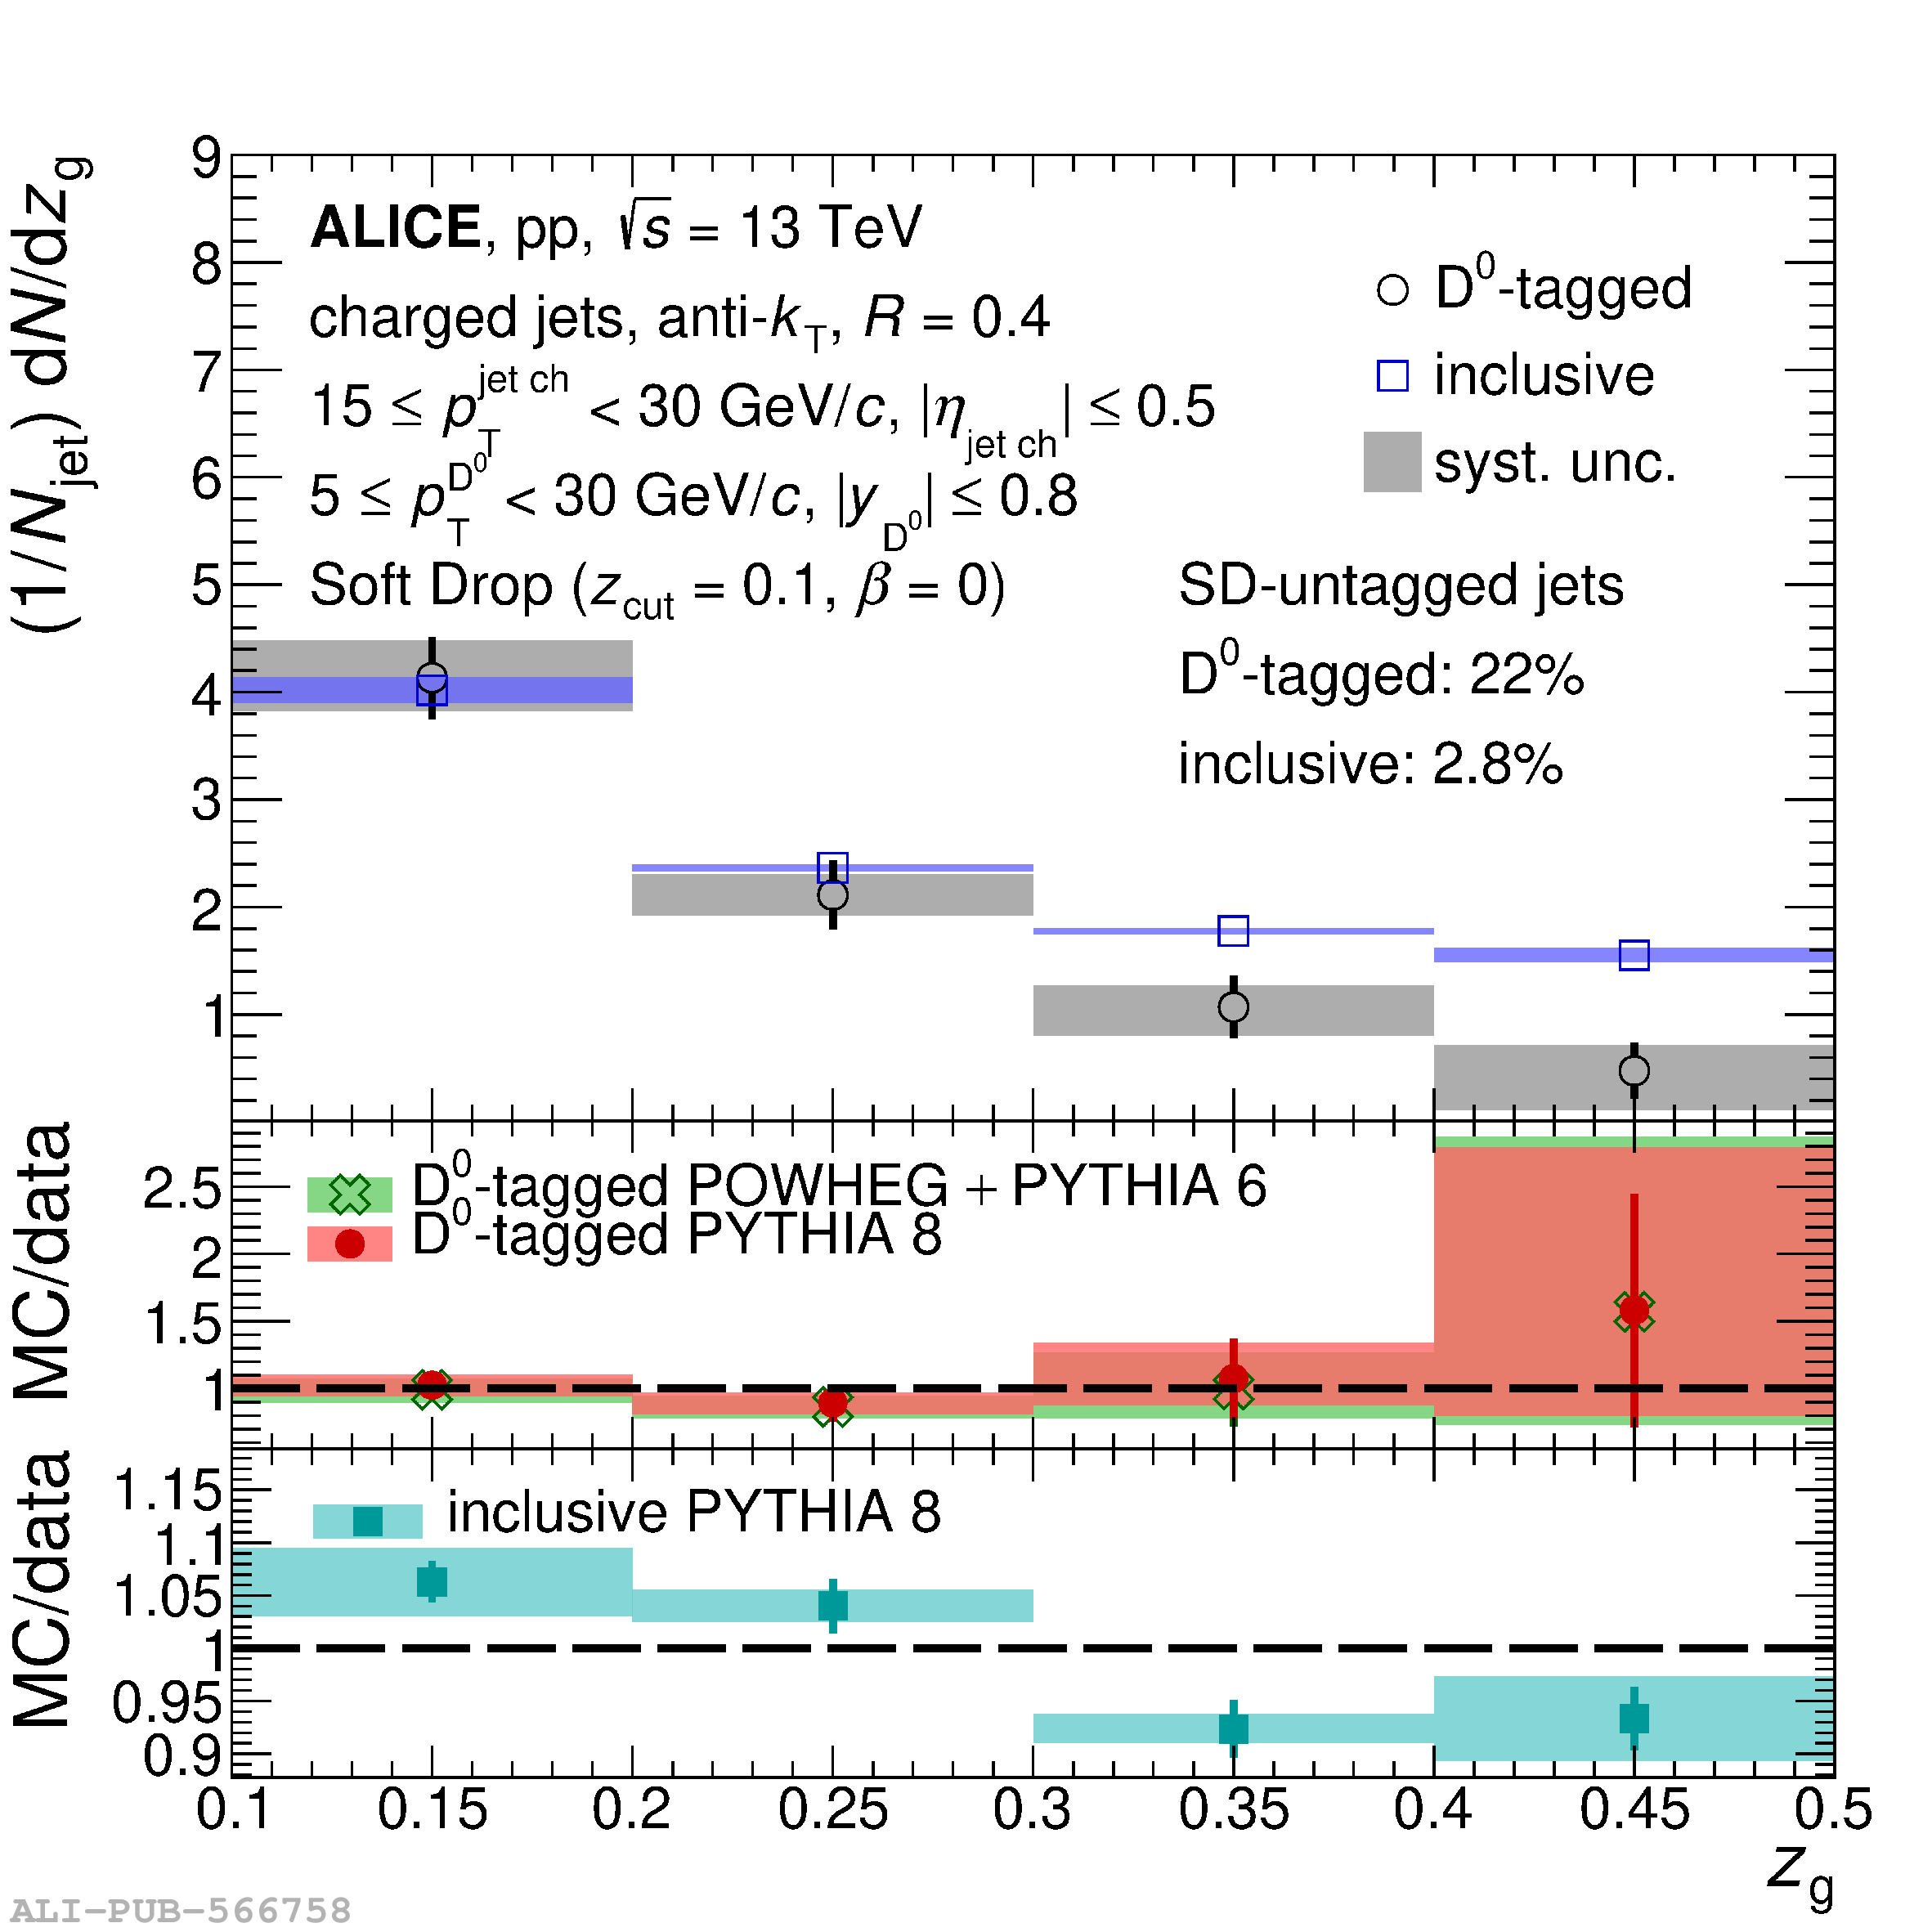 |
Figure 2
The $R_{\rm g}$ (left) and $n_{\rm SD}$ (right) distributions of prompt $\Dzero$-tagged jets compared to those of inclusive jets for $15 \leq p_{\rm T}^{\rm jet\,ch} \leq 30$ GeV/$c$ in pp collisions at $\sqrt{s}$ = 13 TeV. Model/data ratios are shown in the bottom panels for PYTHIA 8 and POWHEG + PYTHIA 6 simulations. | 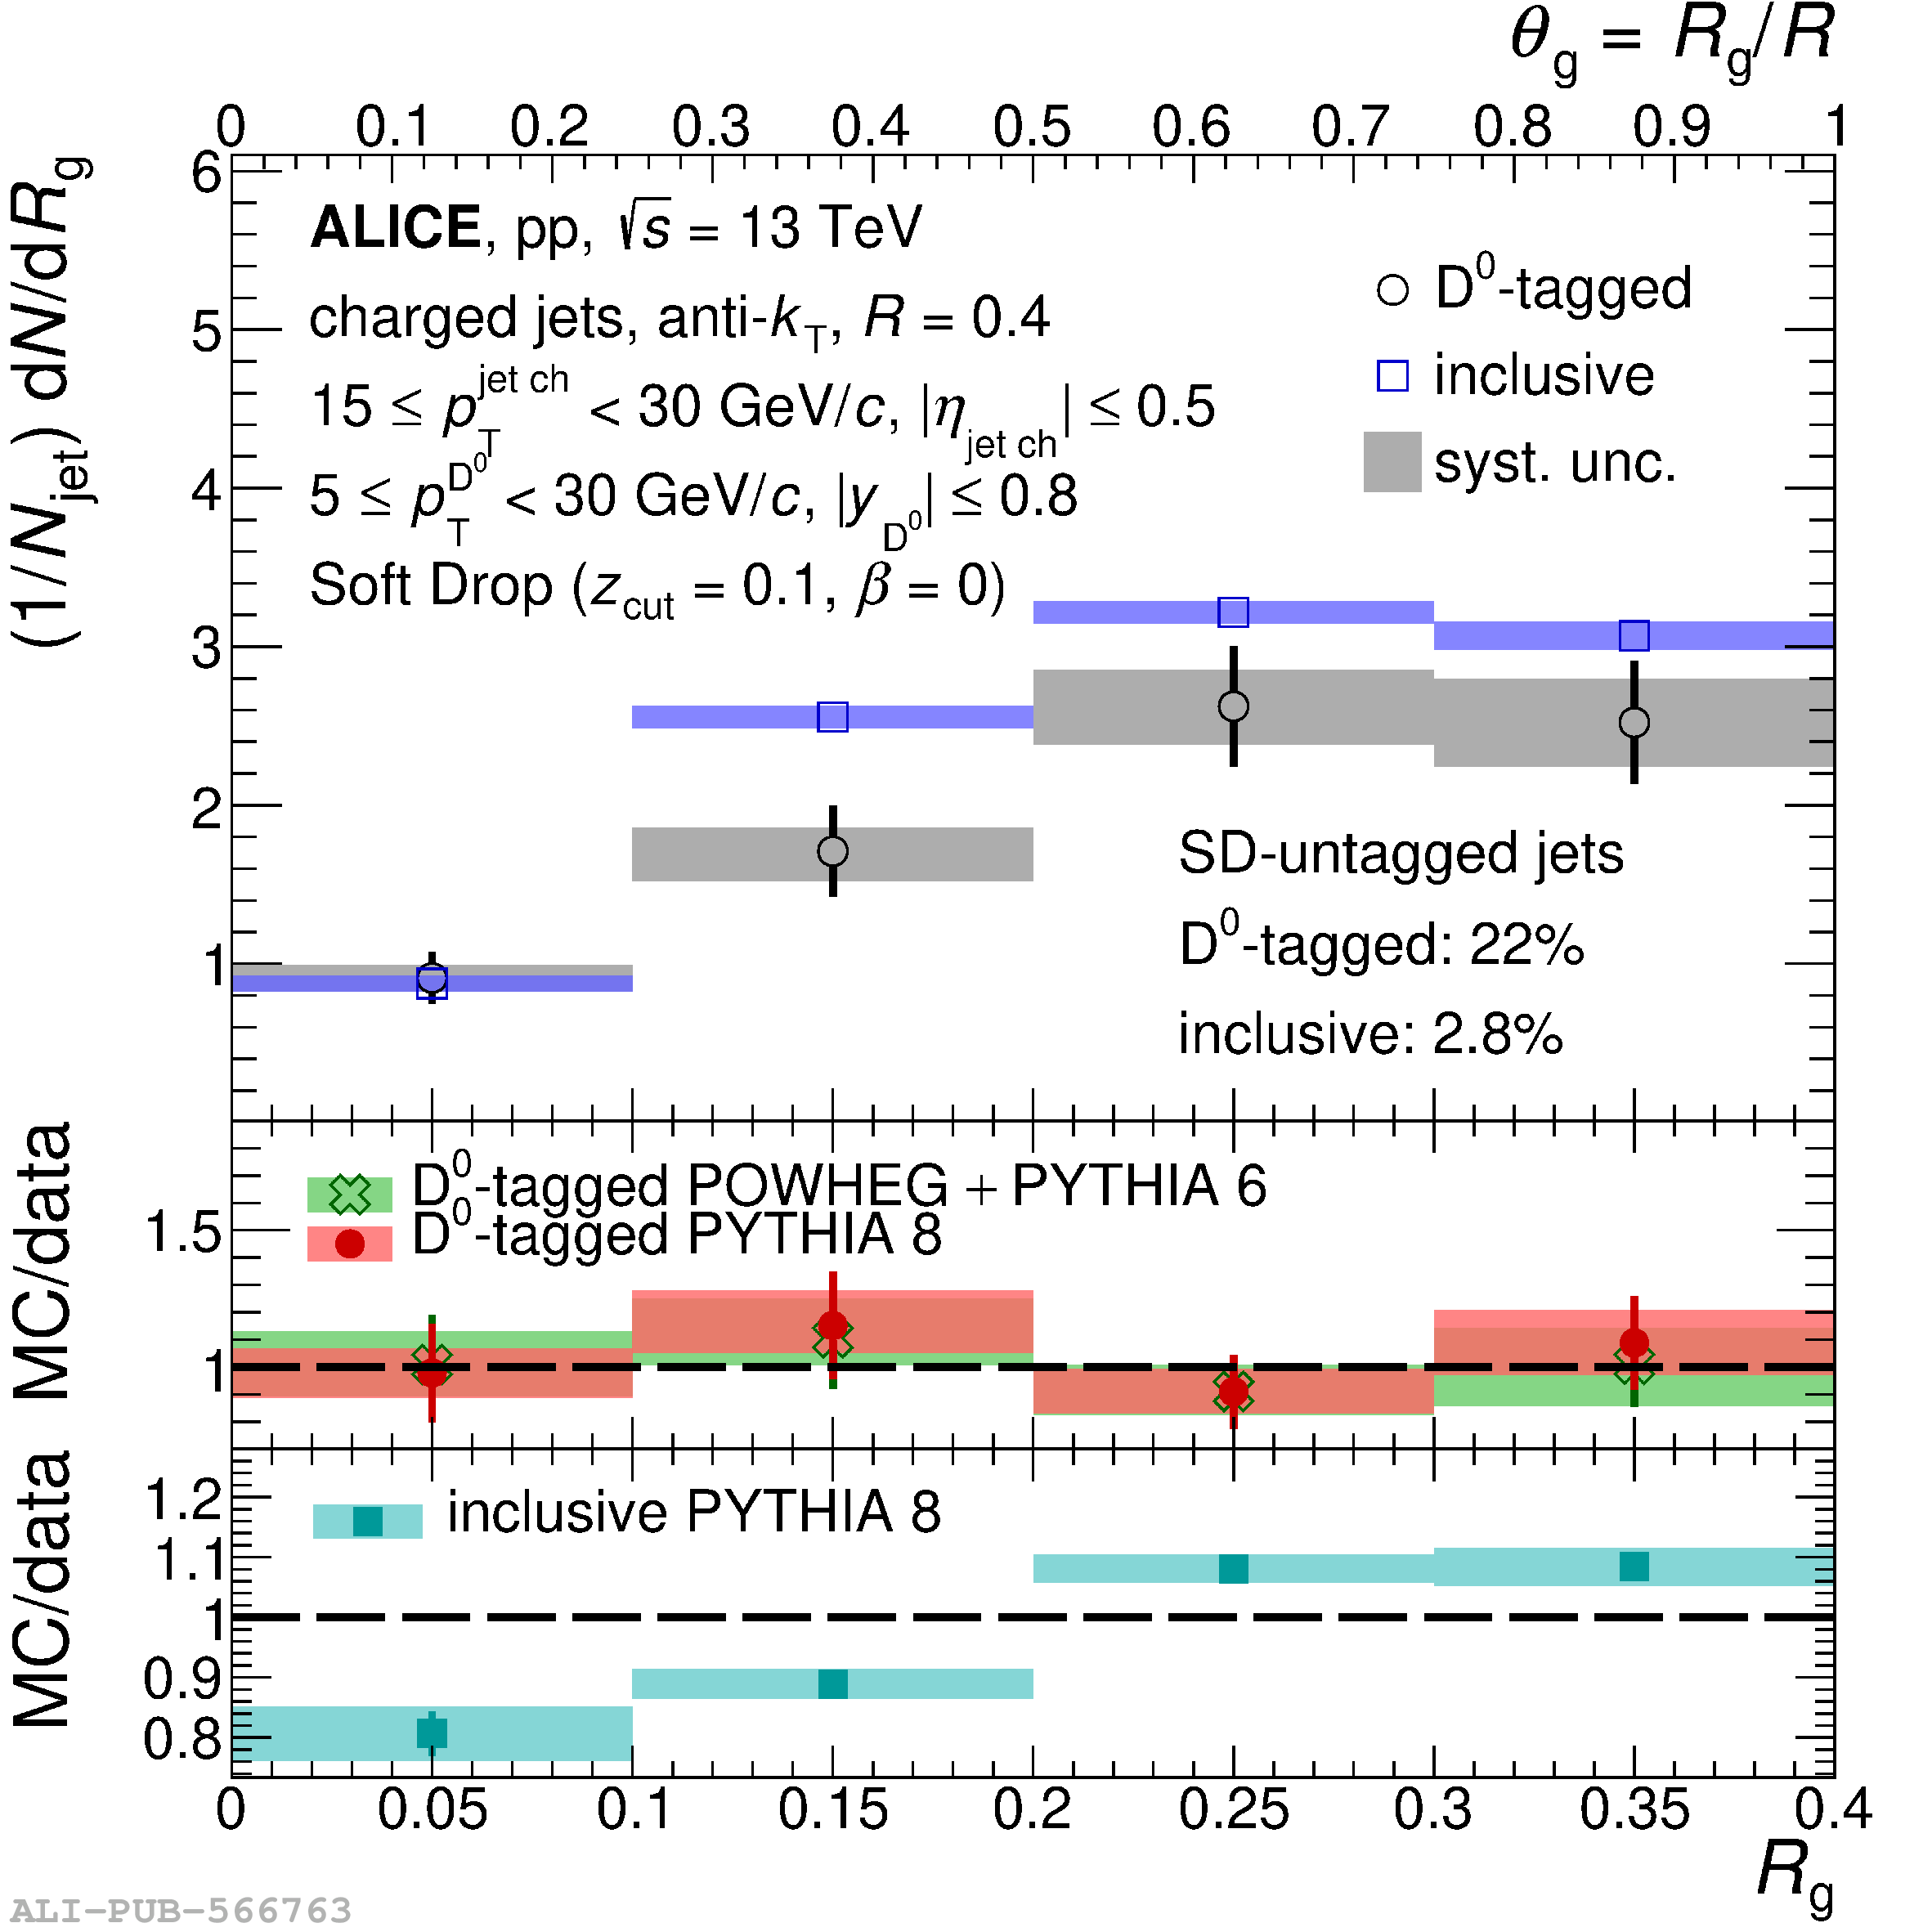 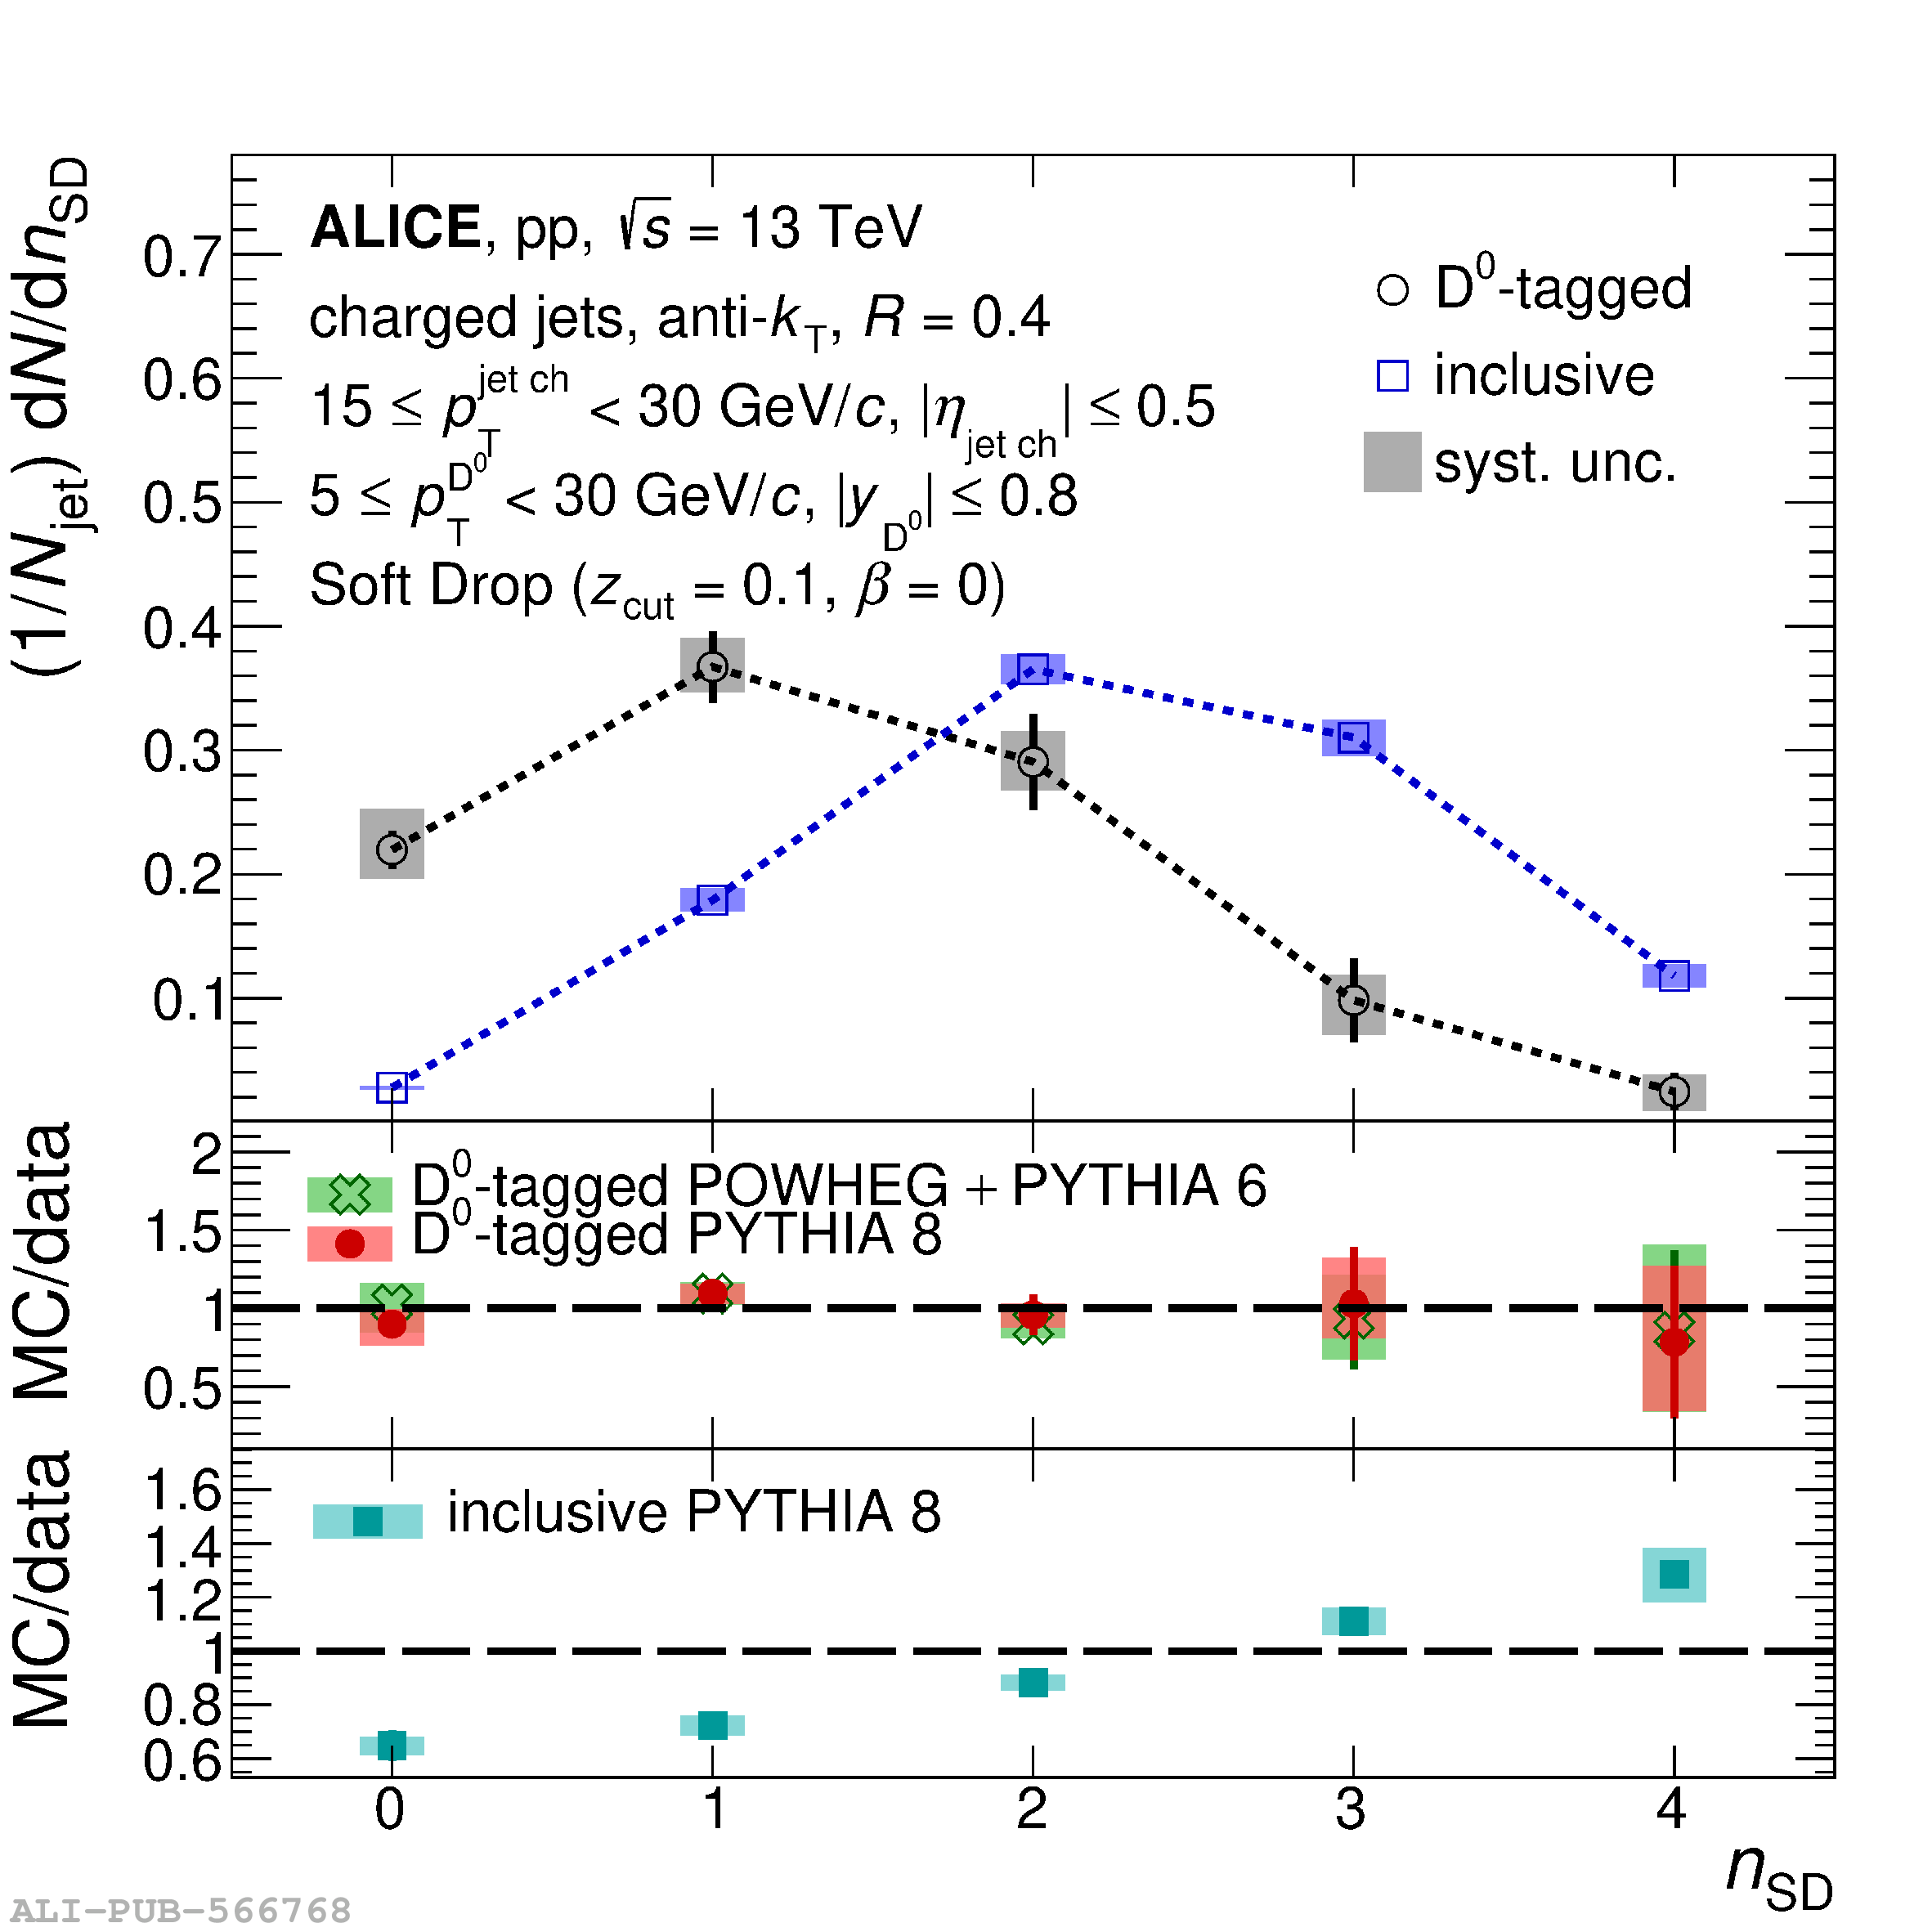 |
Figure A.1
The $z_{\rm g}$ distribution of prompt $\Dzero$-tagged jets compared to that of inclusive jets for $15 \leq p_{\rm T}^{\rm jet\,ch} \leq 30$ GeV/$c$ in pp collisions at $\sqrt{s}$ = 13 TeV, normalised to the number of jets passing the Soft Drop condition. Model/data ratios are shown in the bottom panels for soft-collinear effective theory calculations . | 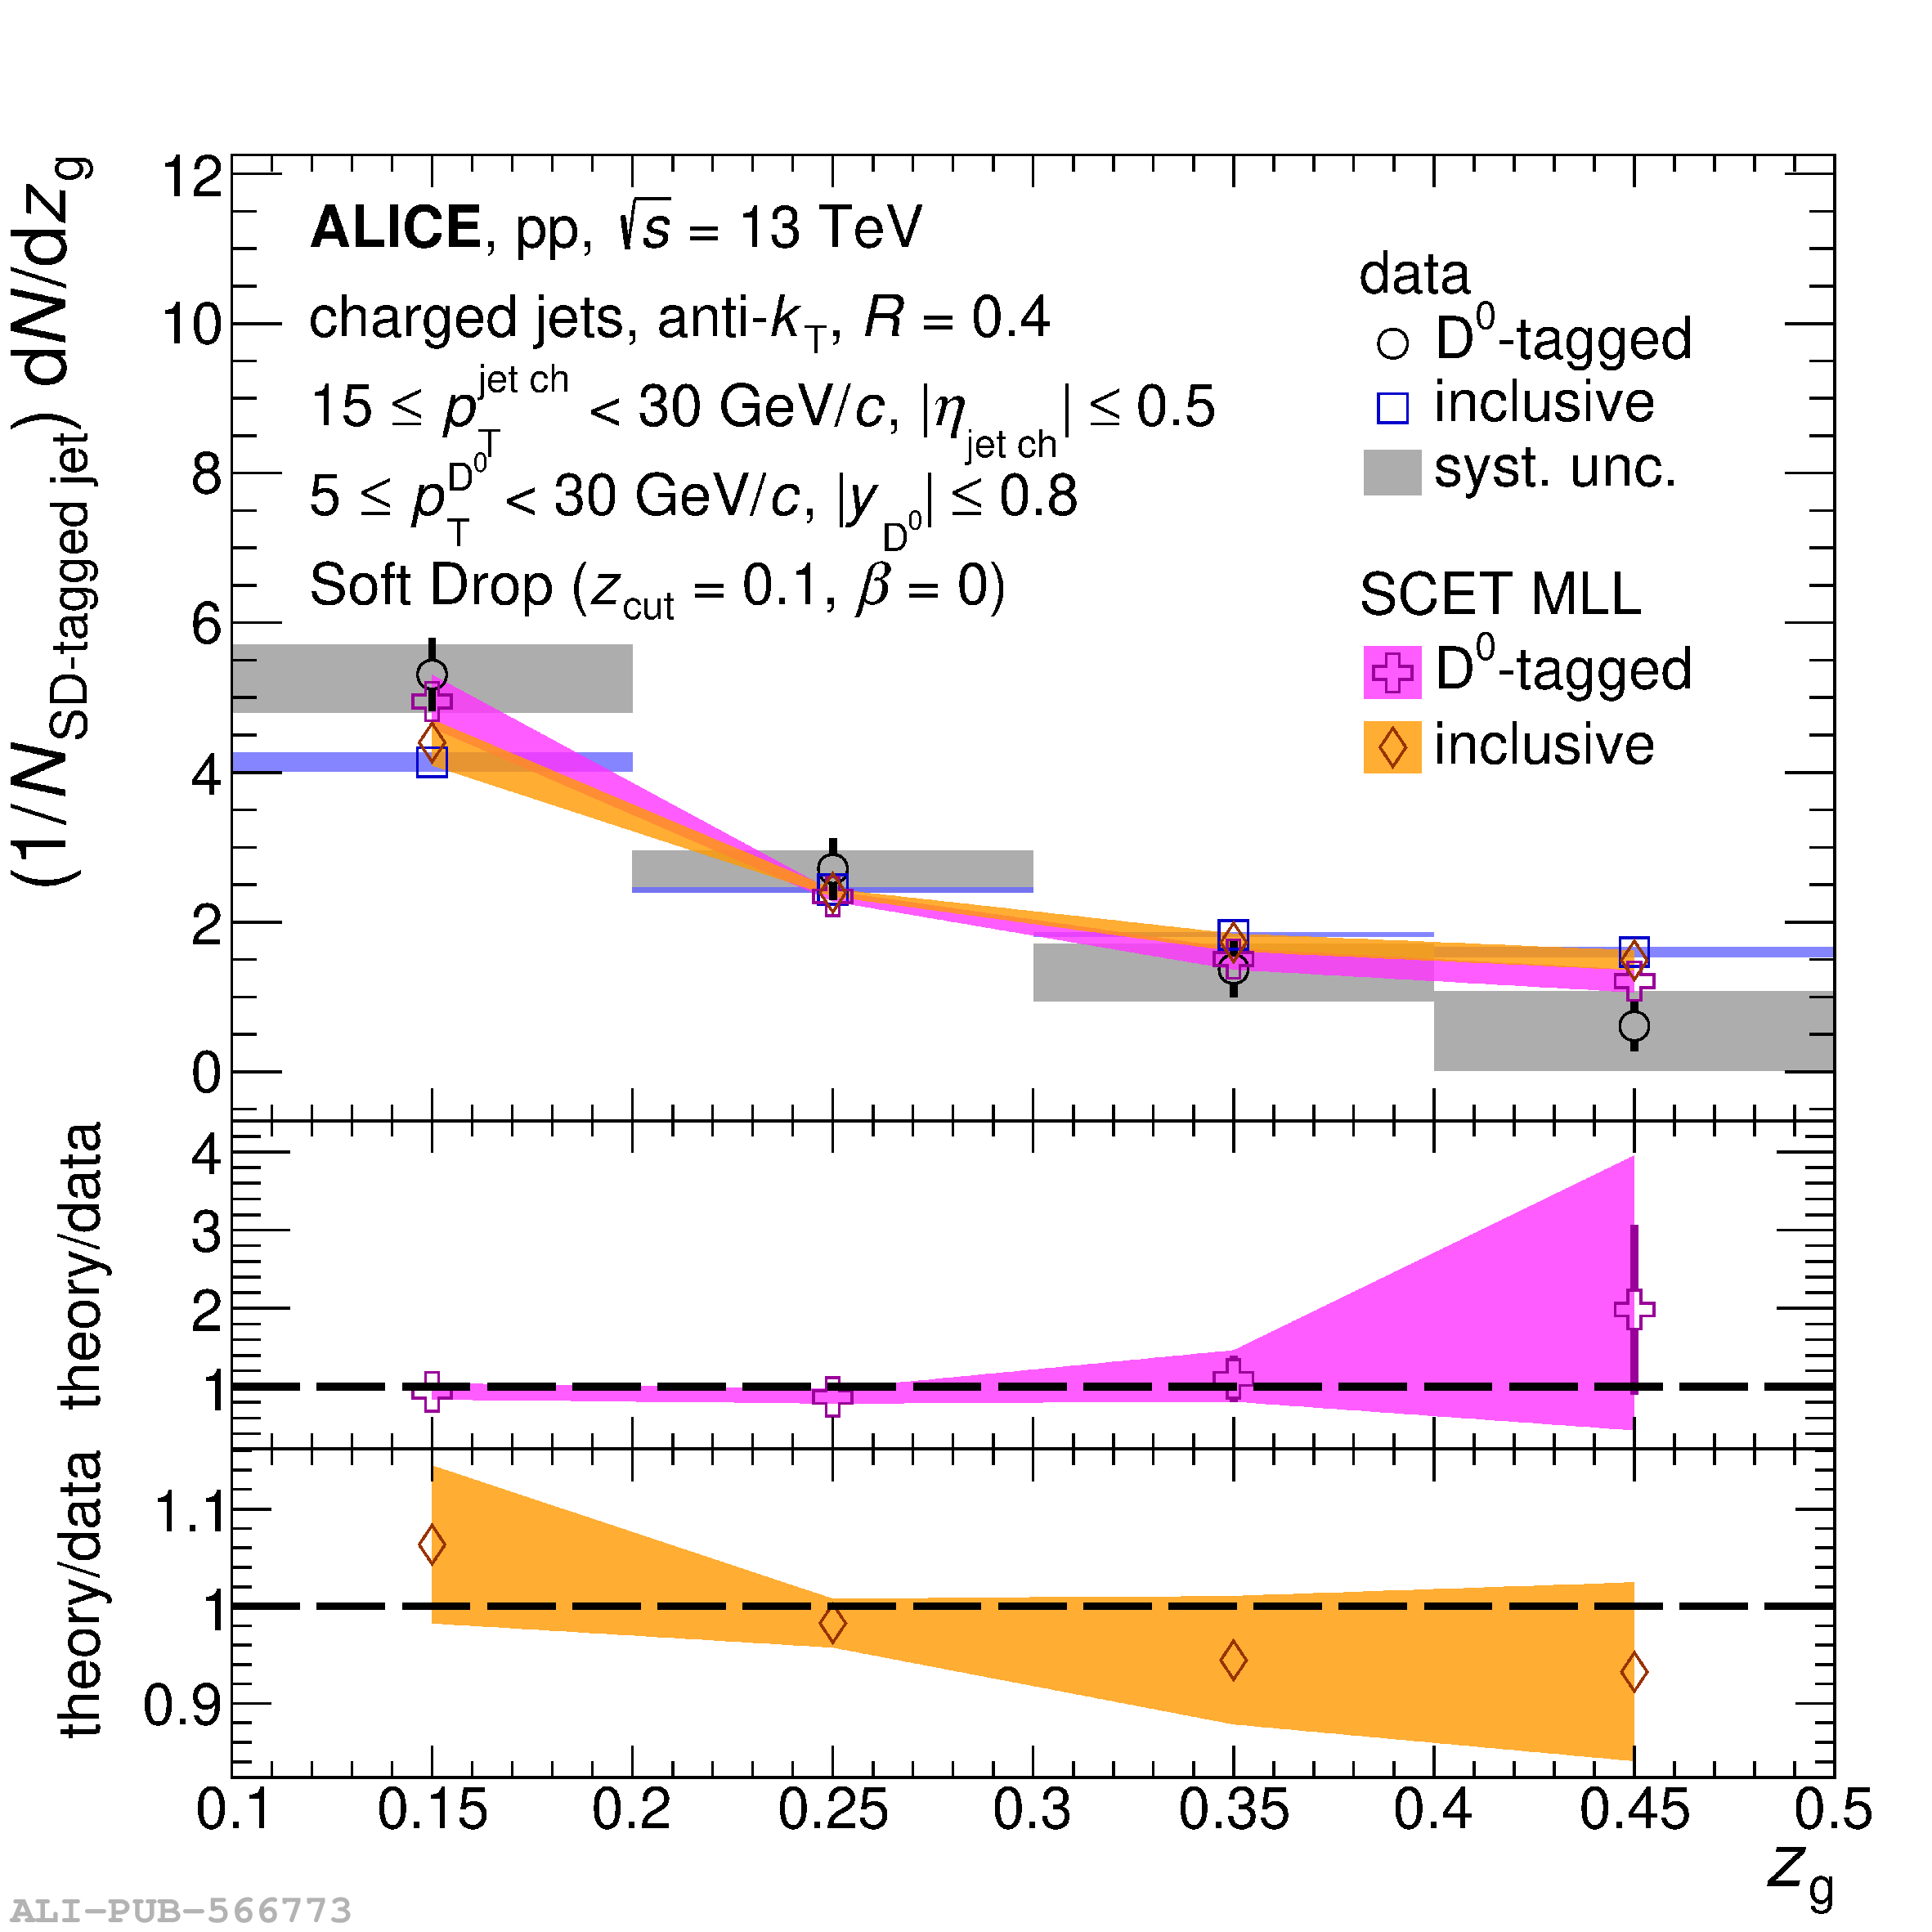 |
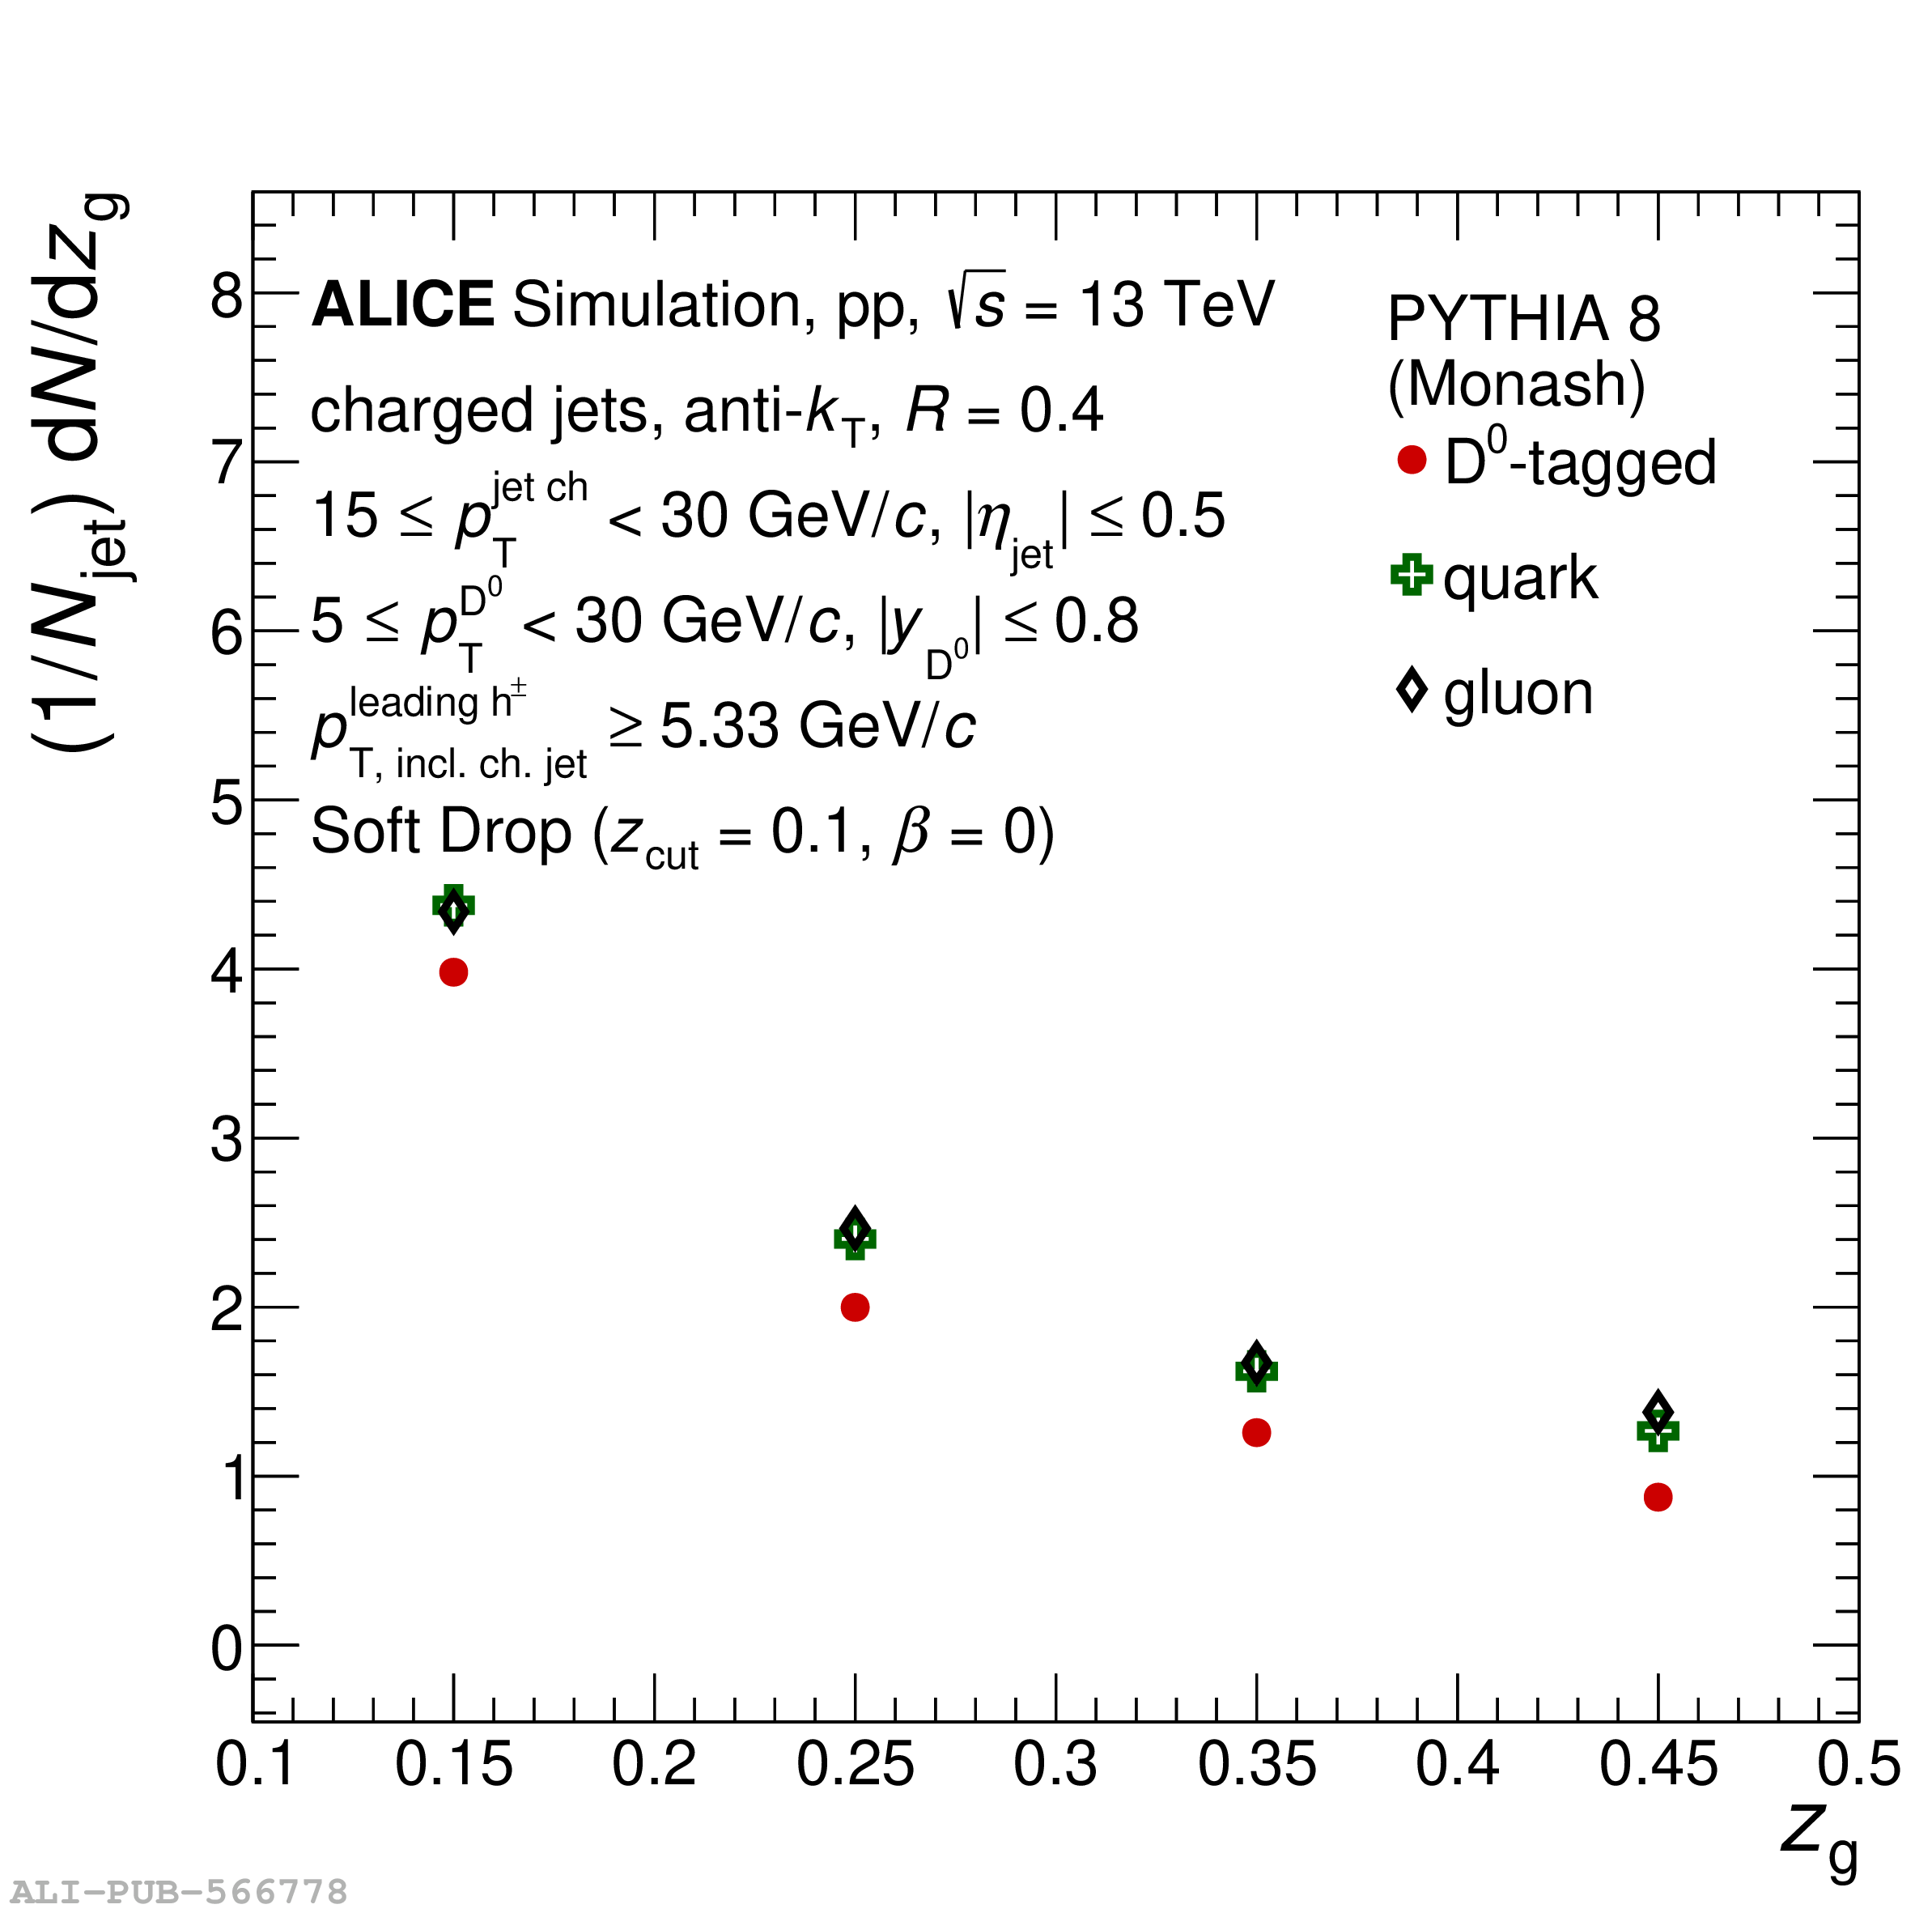
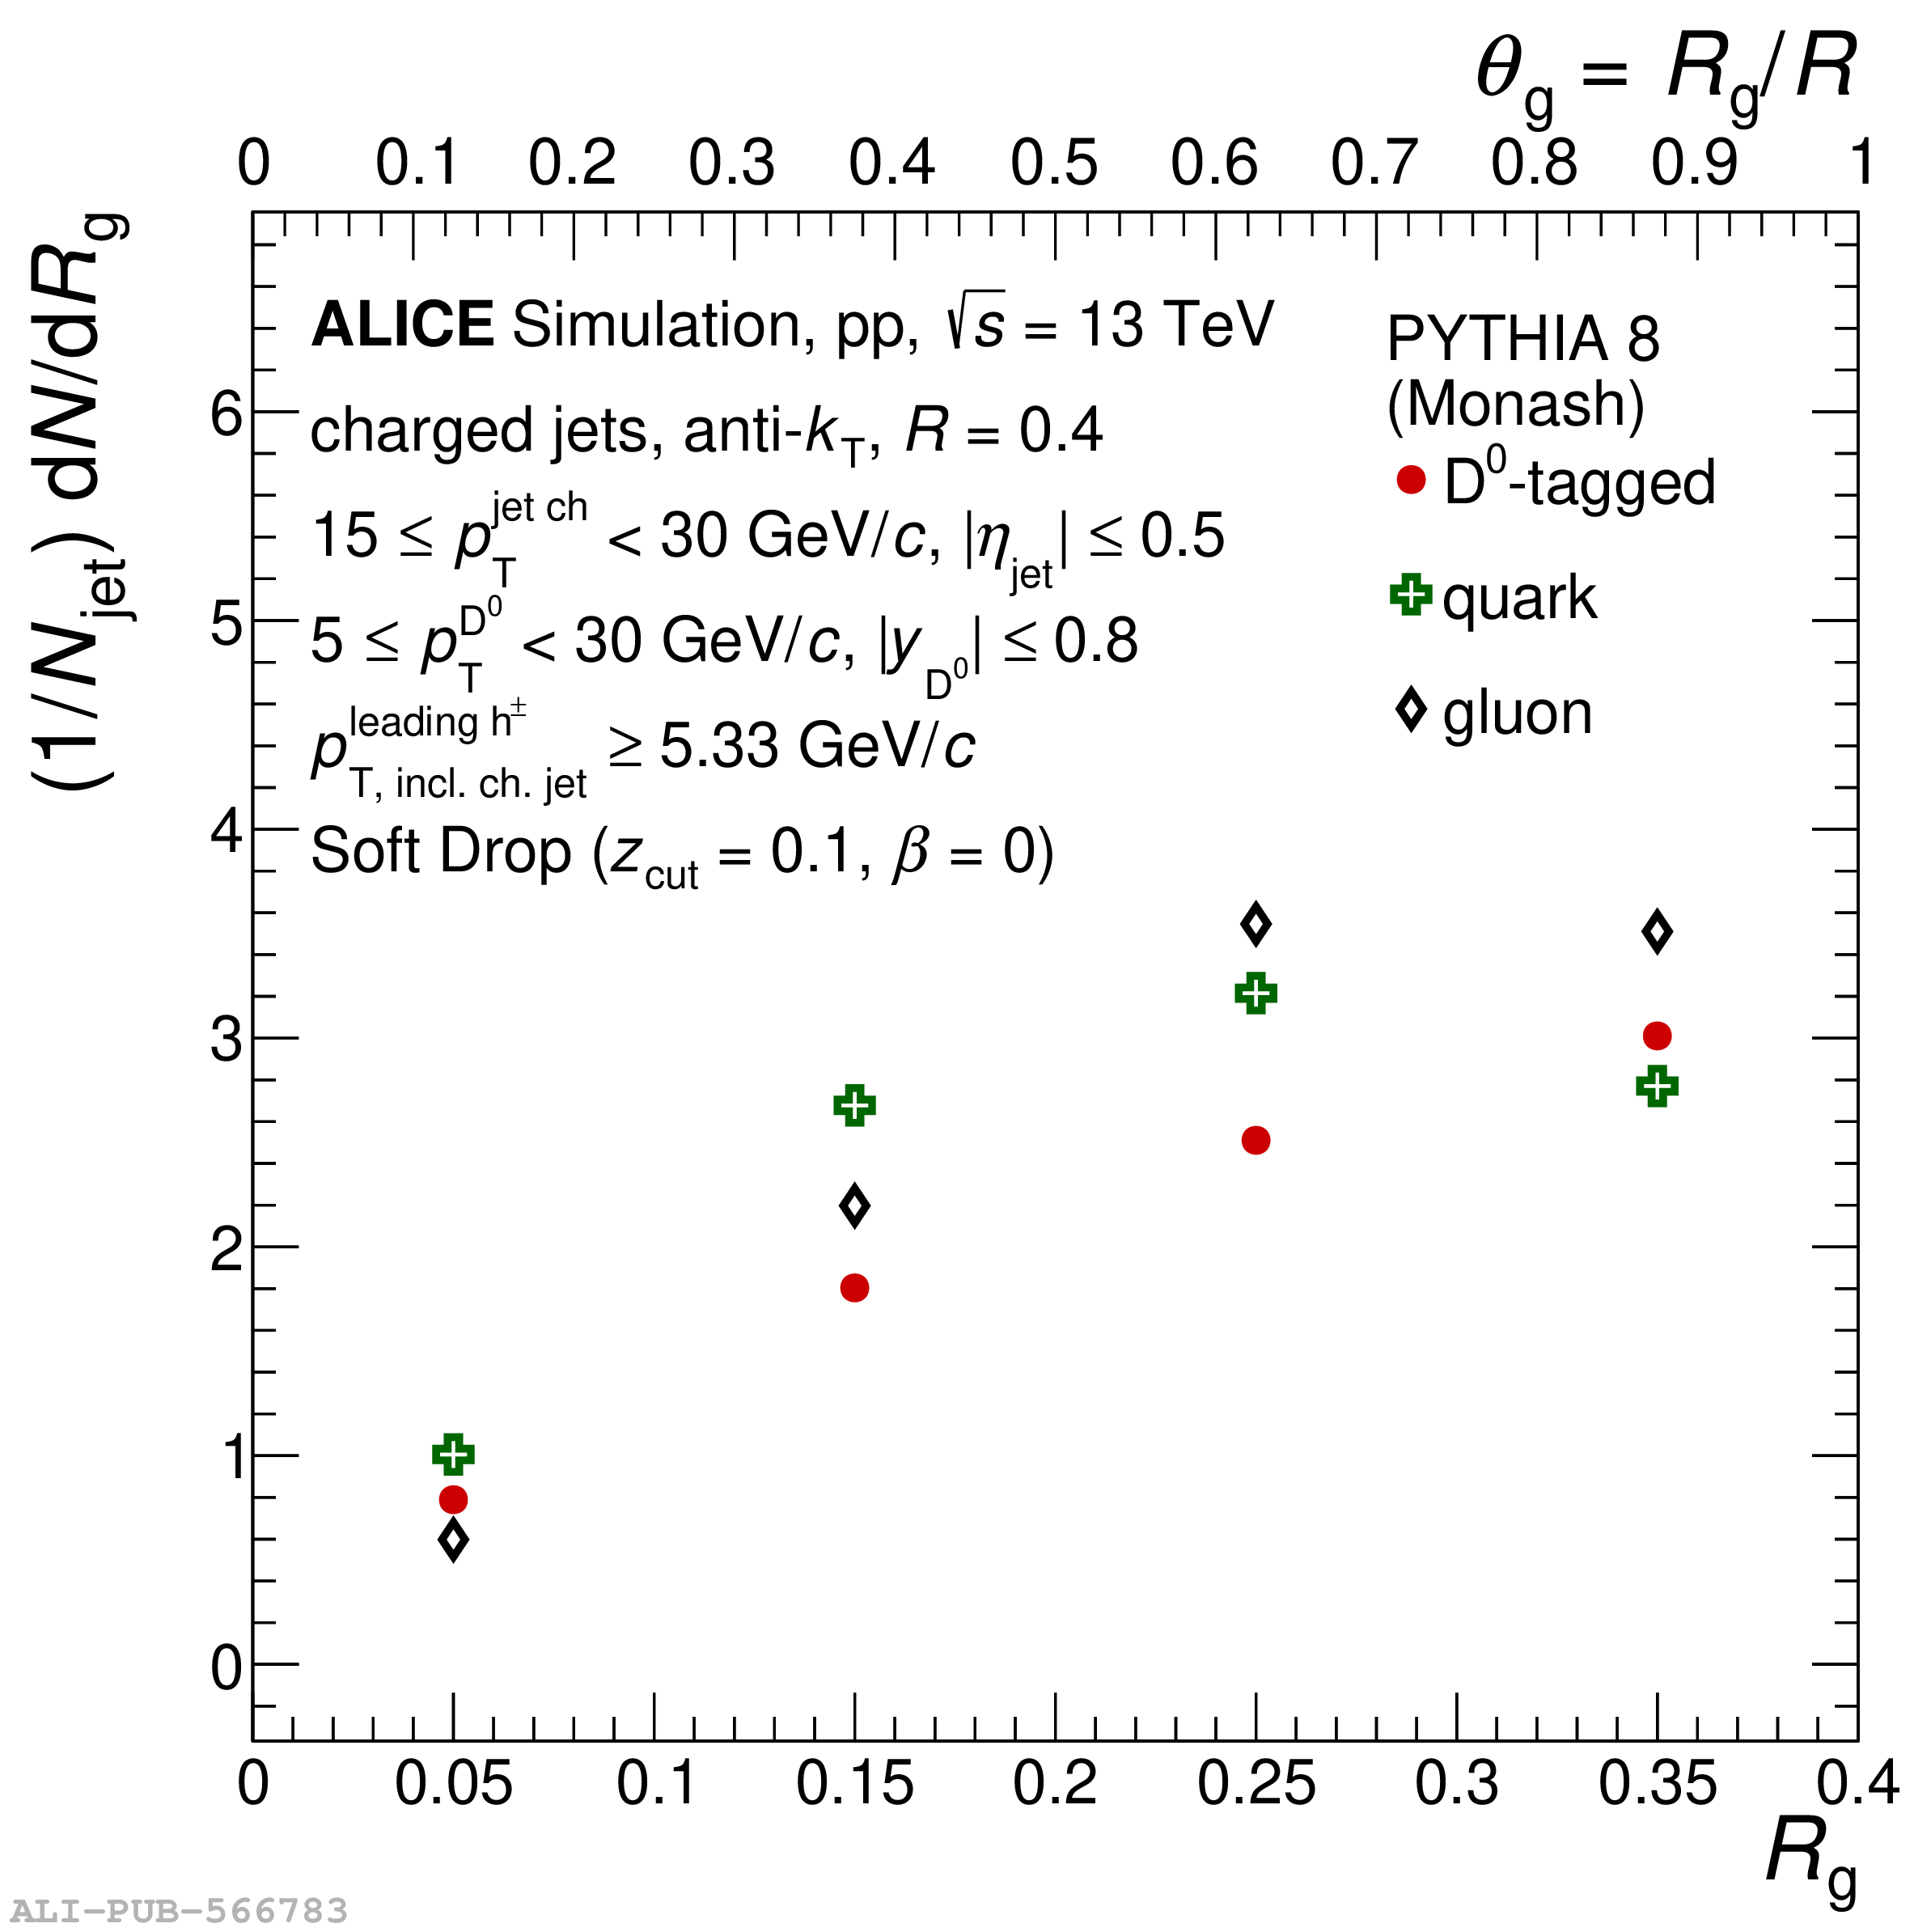
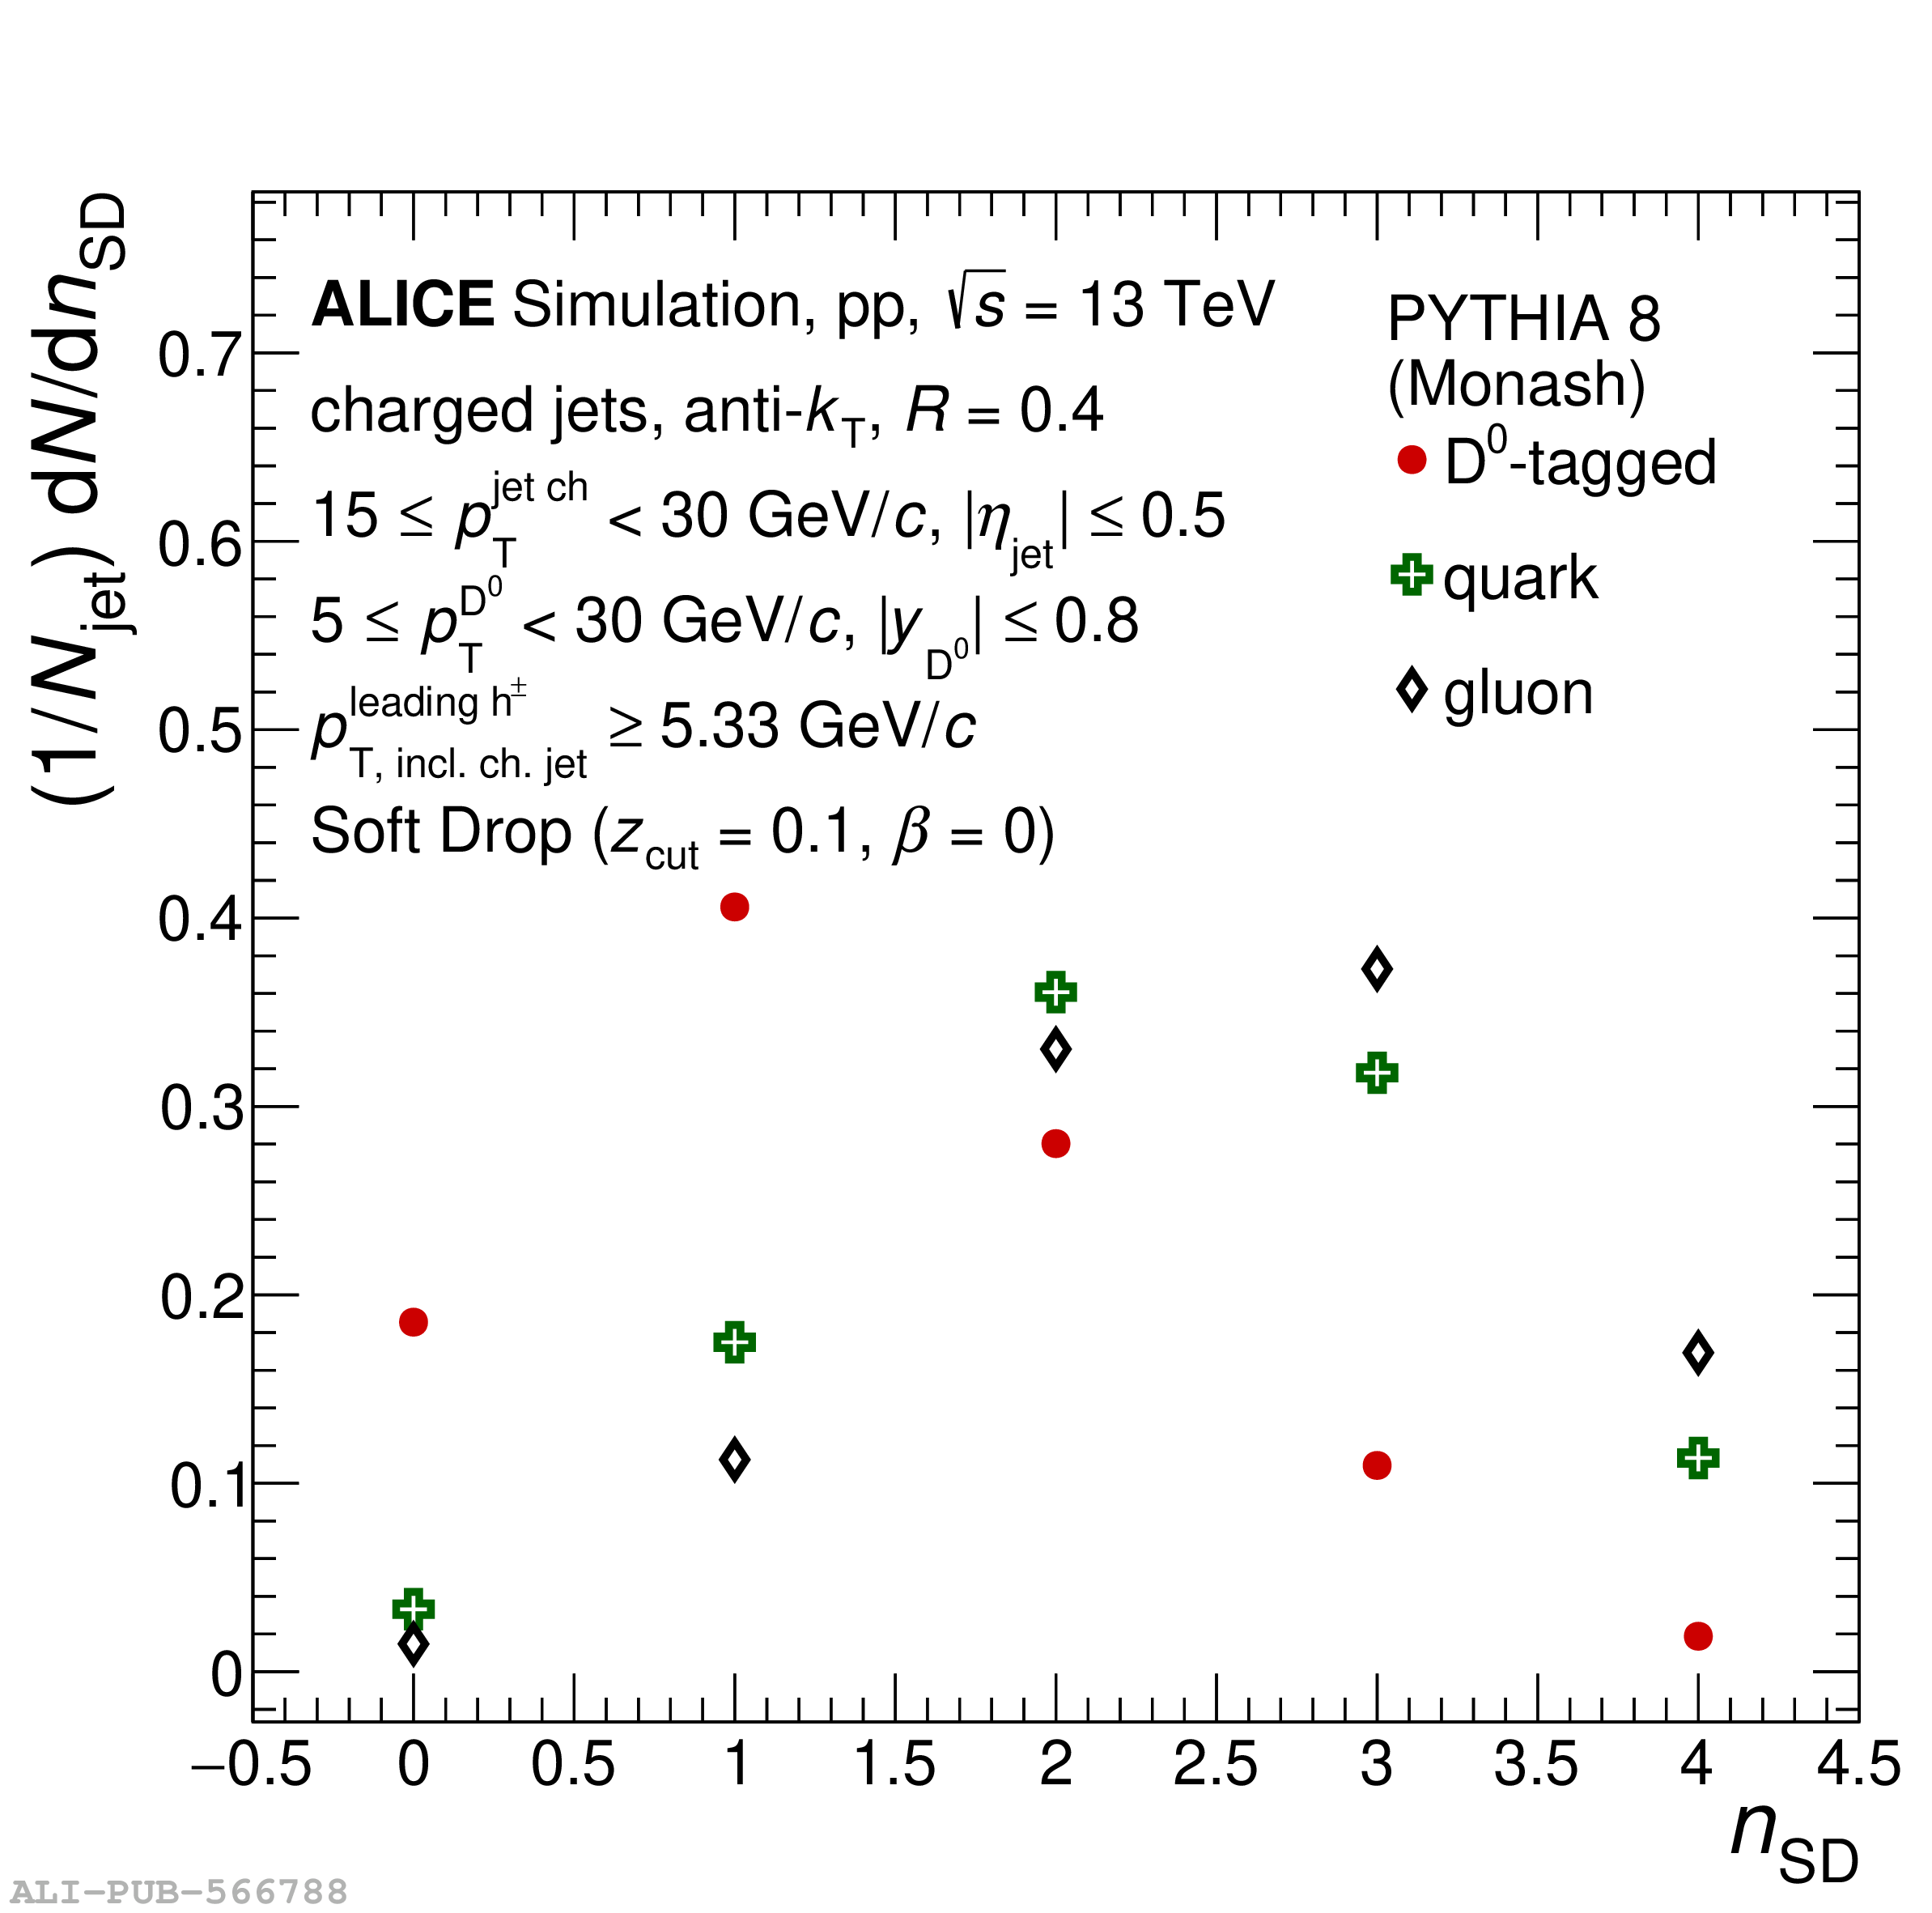
Figure A.5
The systematic uncertainties of the measured $z_{\rm g}$ distribution of prompt $\Dzero$-tagged jets for each uncertainty category, relative to the central value of the measurement in each interval, are presented. The statistical uncertainty relative to the central value is also shown. |  |
Figure A.6
The systematic uncertainties of the measured $R_{\rm g}$ (left) and $n_{\rm SD}$ (right) distributions of prompt $\Dzero$-tagged jets for each uncertainty category, relative to the central value of the measurement in each interval, are presented. The statistical uncertainty relative to the central value is also shown. | 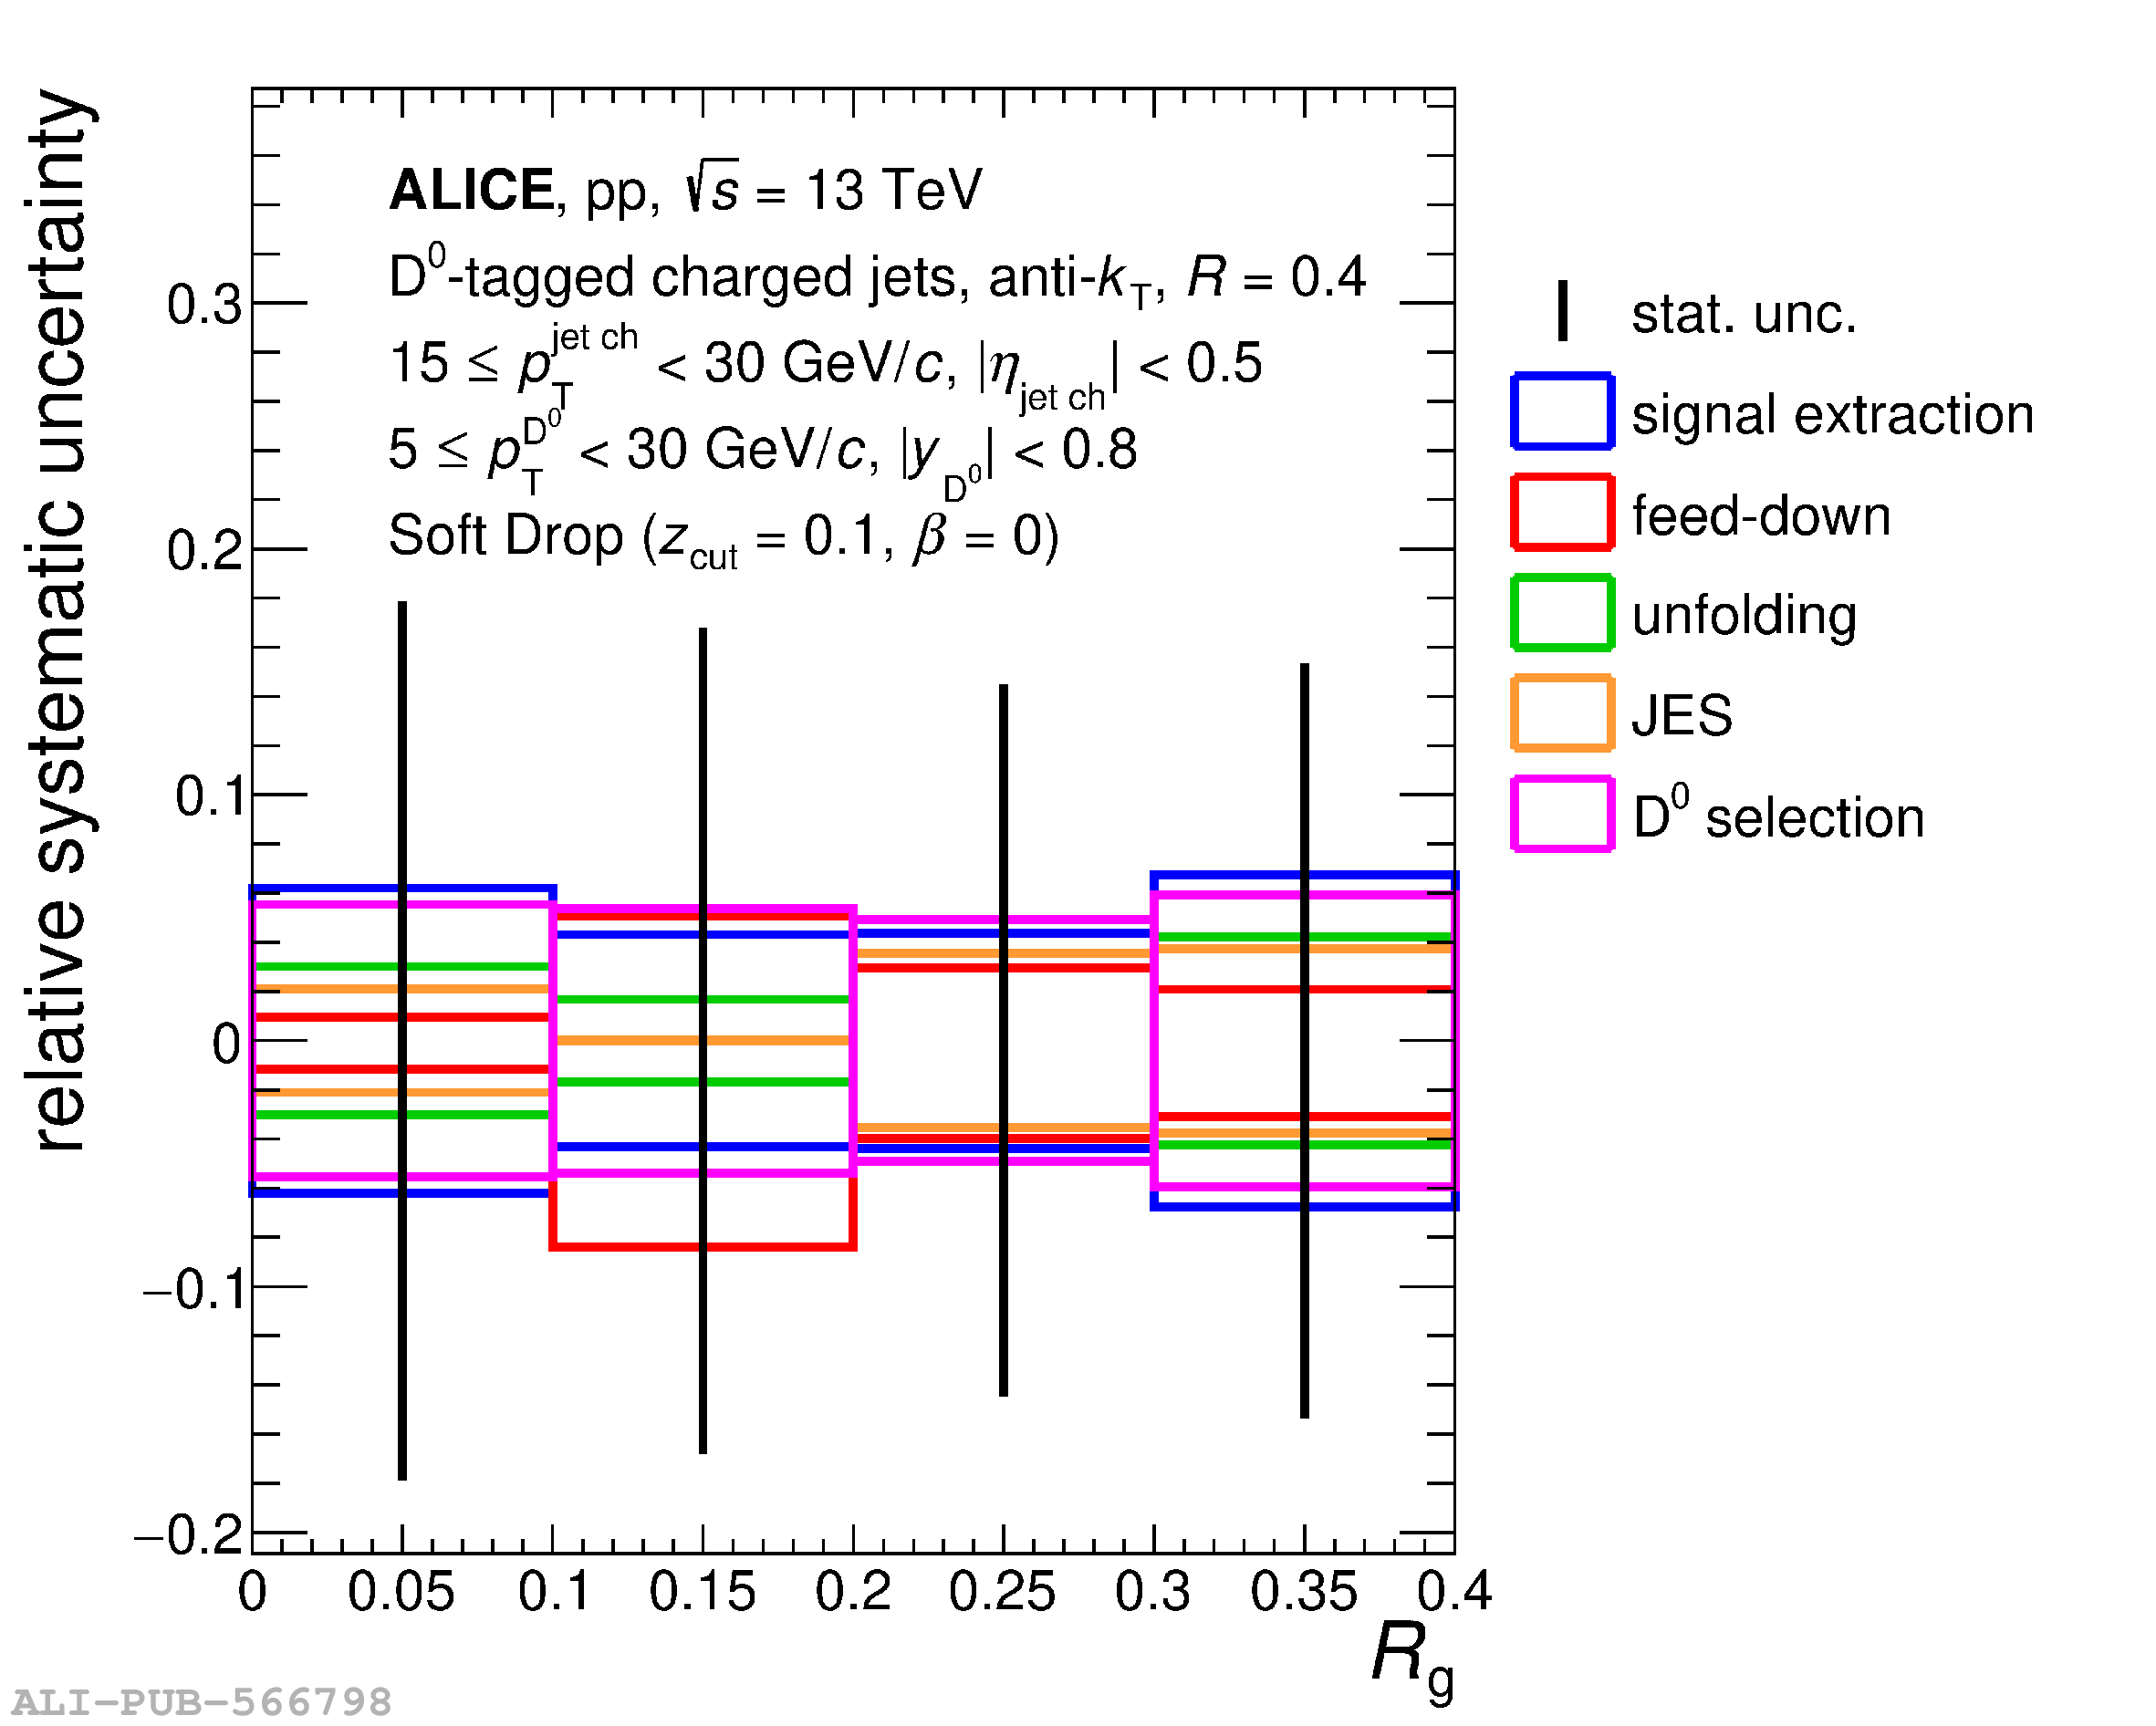 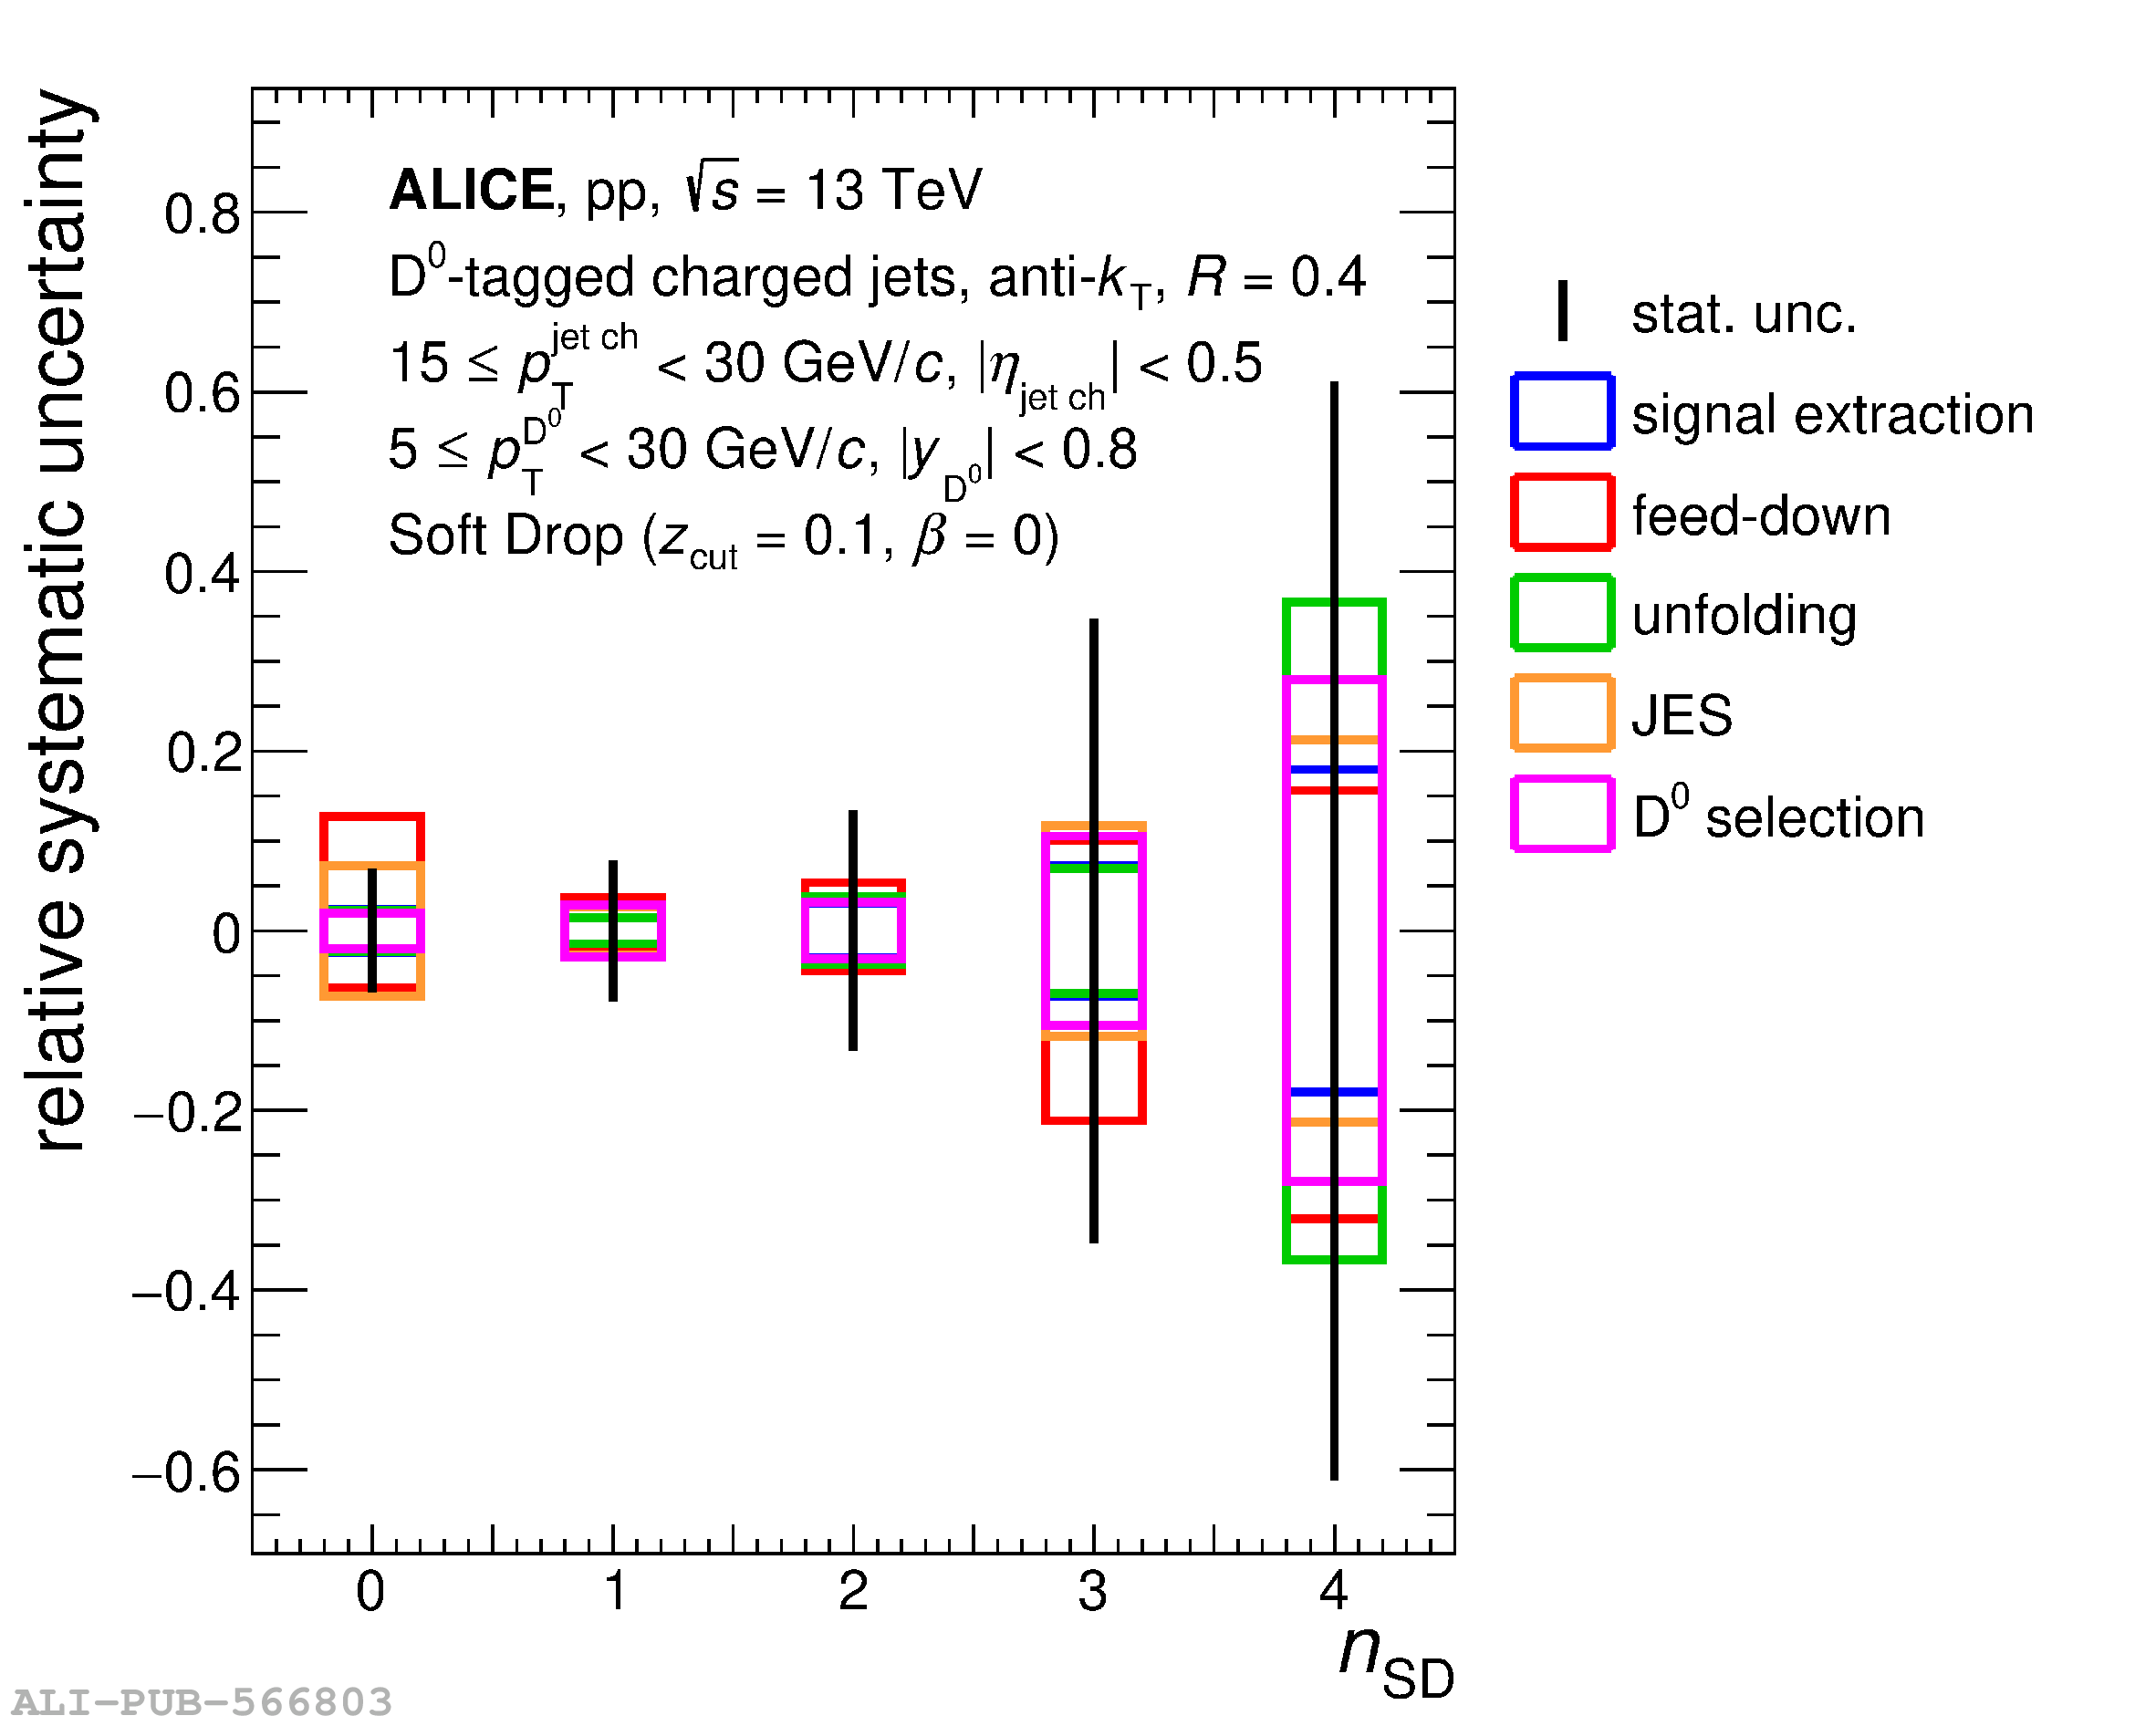 |
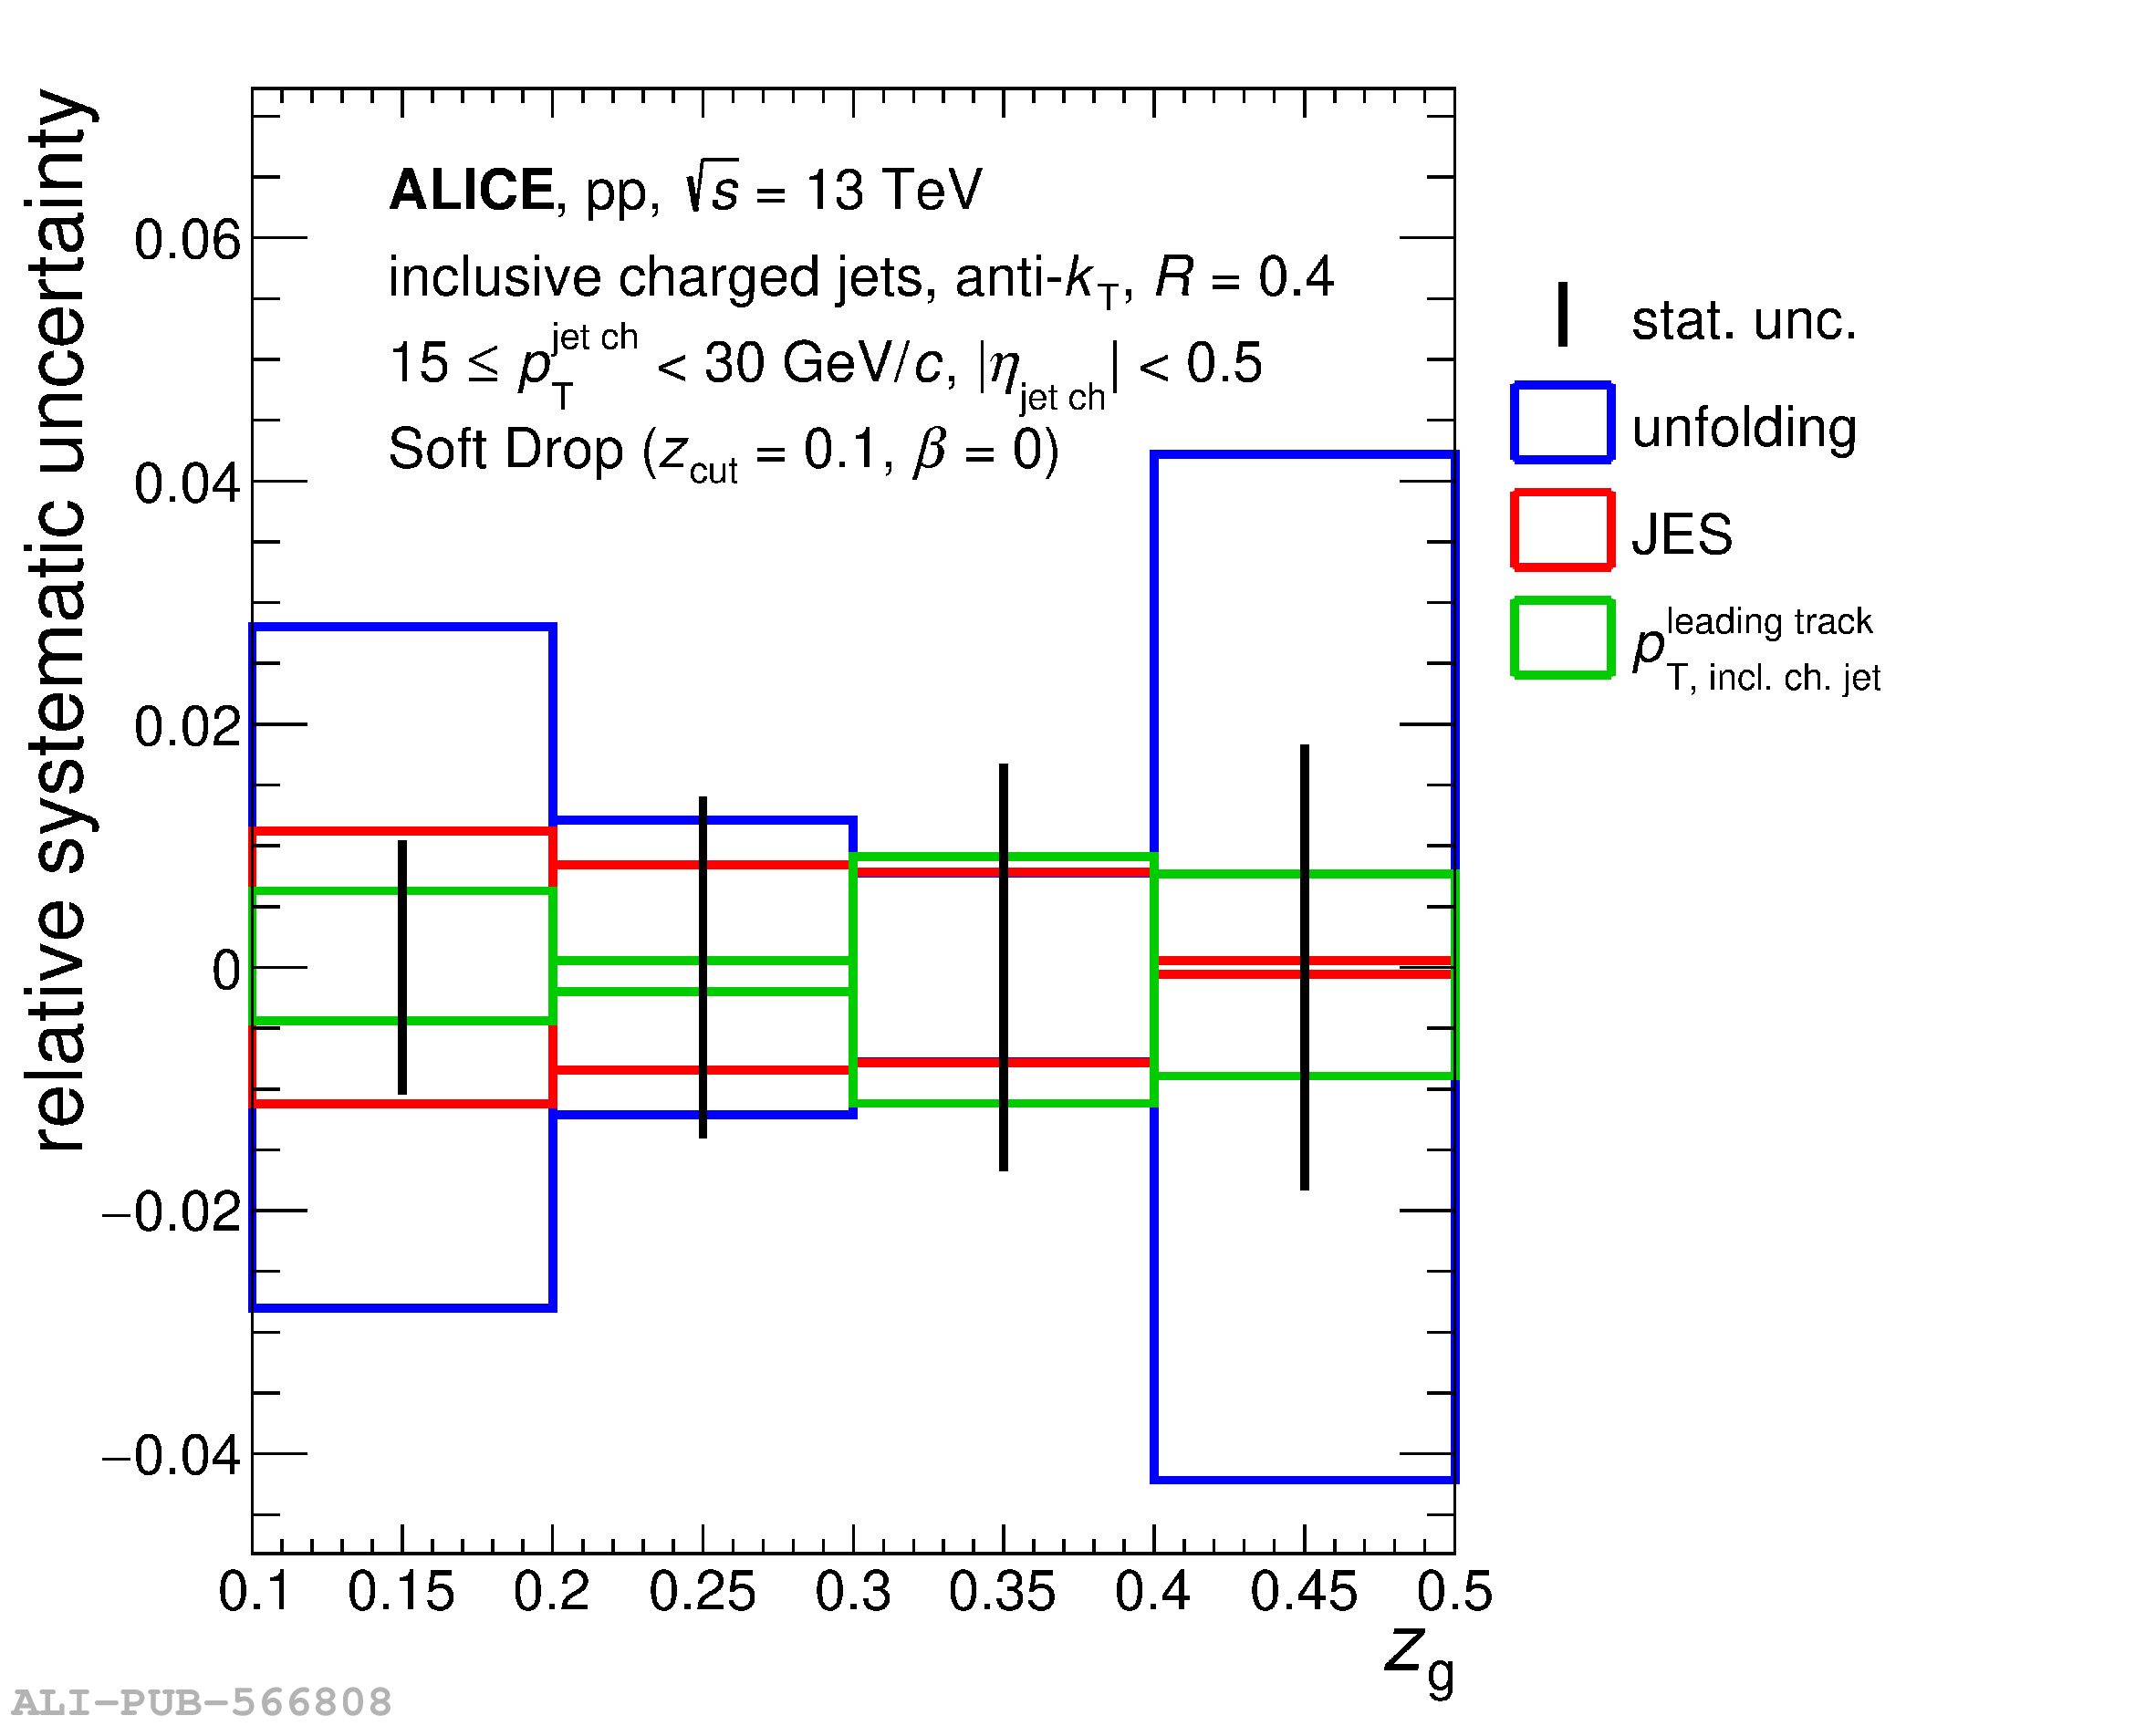
Figure A.8
The systematic uncertainties of the measured $\rg$ (left) and $\nsd$ (right) distributions of inclusive jets for each uncertainty category, relative to the central value of the measurement in each interval, are presented. The statistical uncertainty relative to the central value is also shown. | 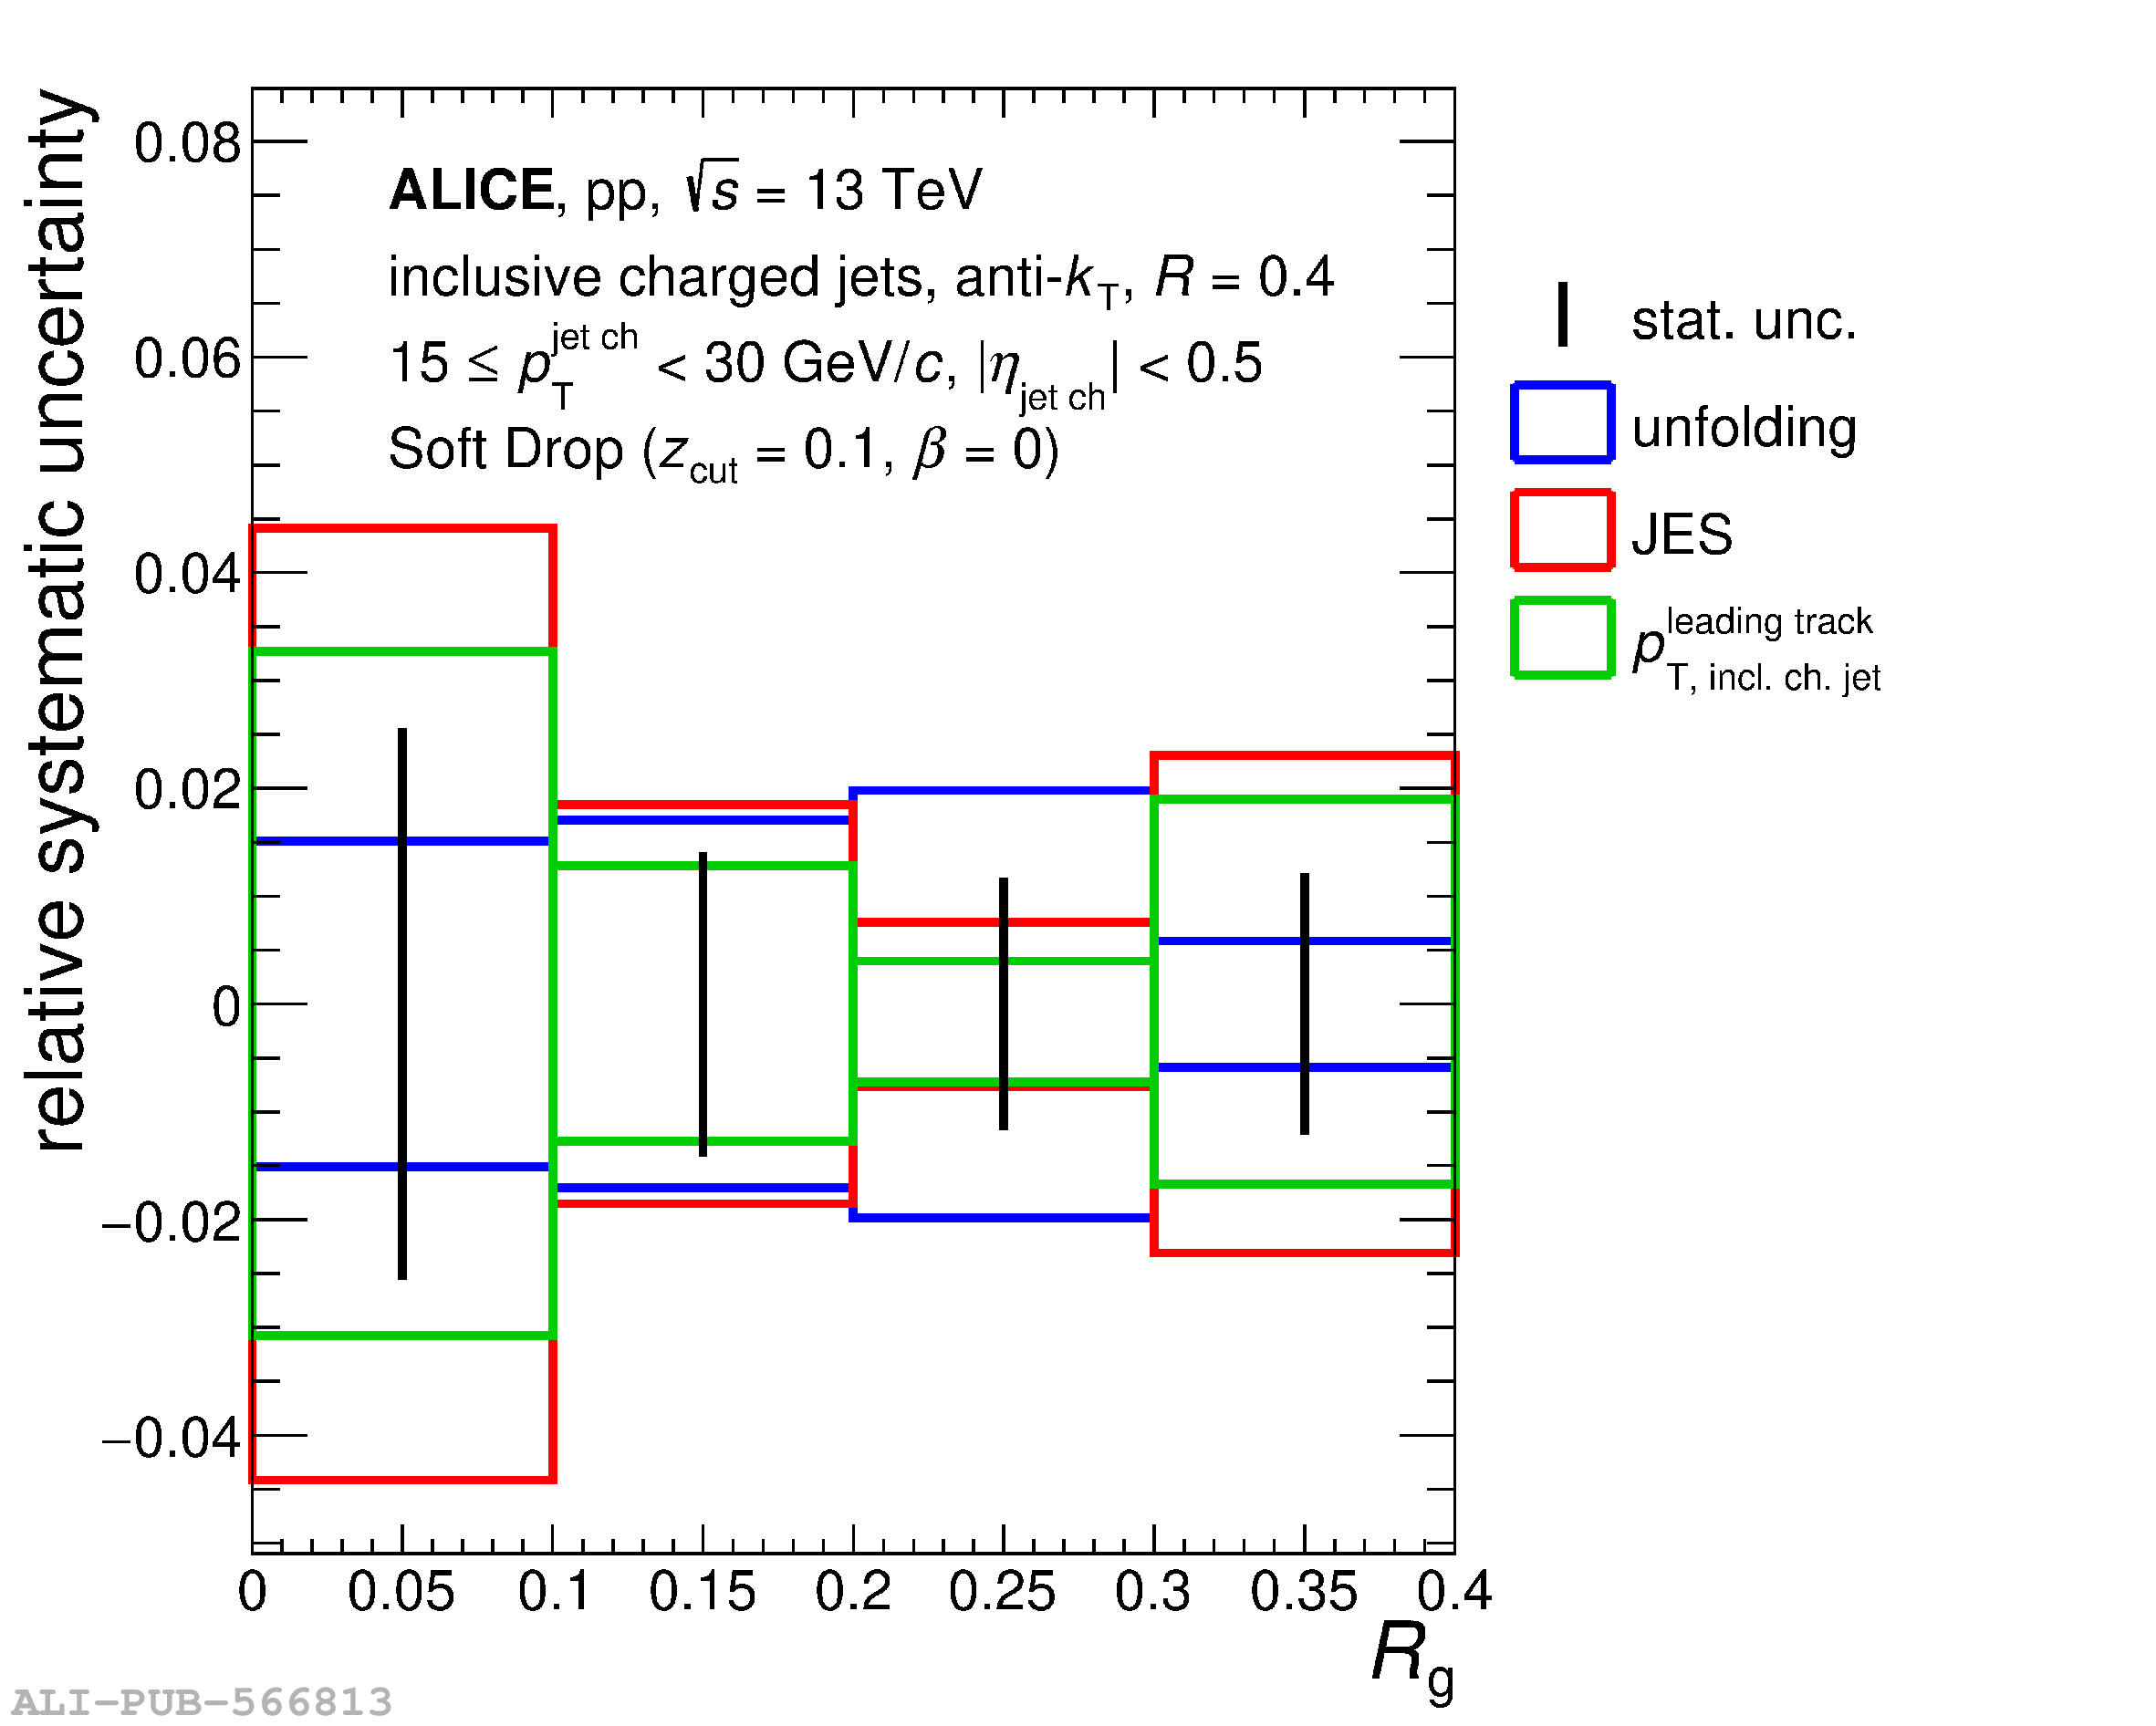 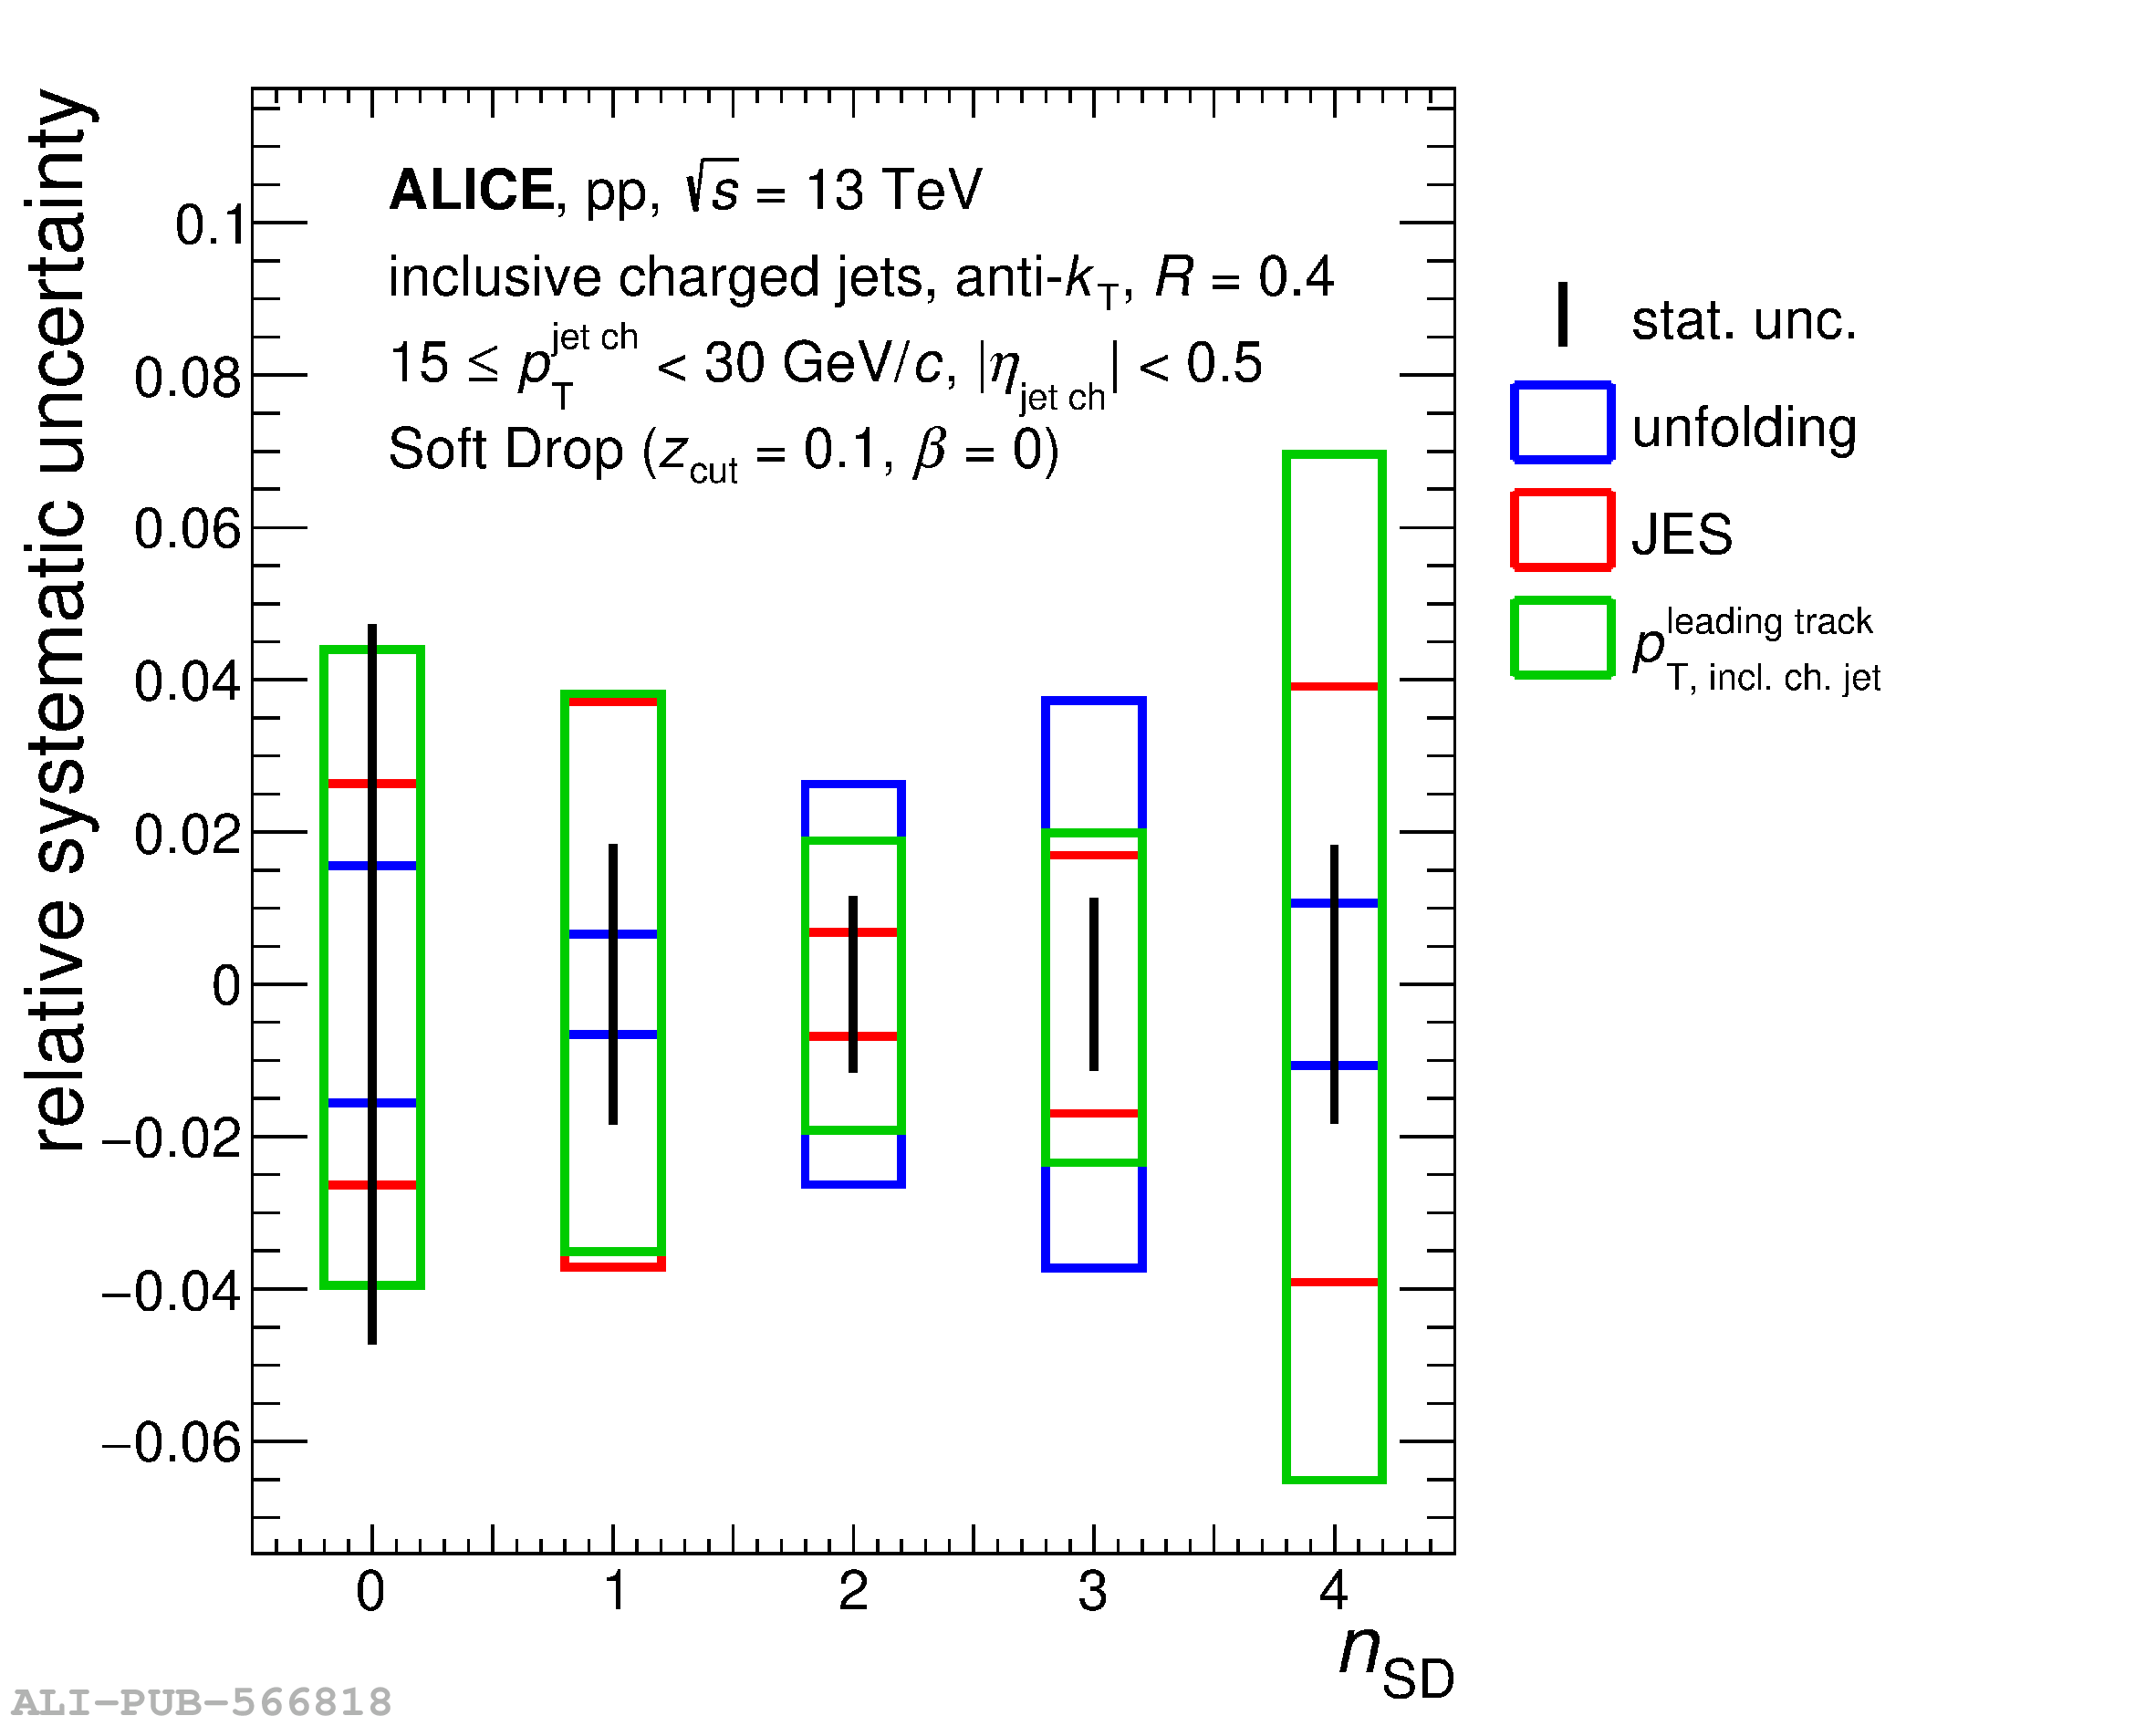 |