Left panel: $\rm \Xi_c^0/D^0$ and $\rm \Xi_c^+/D^0$ ratios as a function of $p_{\rm T}$ in pp collisions at $\sqrt{s}=13$ TeV Right panel: $\rm \Xi_c^0/\Lambda_c^+$ and $\rm \Xi_c^{0, +}/\Sigma_c^{0, +, ++}$ ratio as a function of $p_{\rm T}$ The error bars and empty boxes represent the statistical and systematic uncertainties, respectively. The systematic uncertainties on the BR are shown as shaded boxes. The measurements are compared with model calculations (see text for detail). | 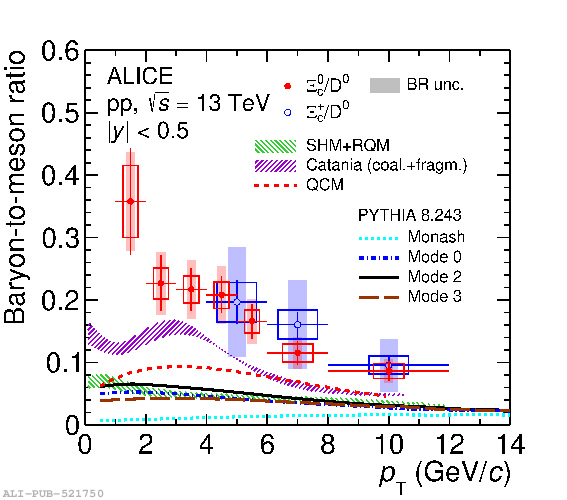 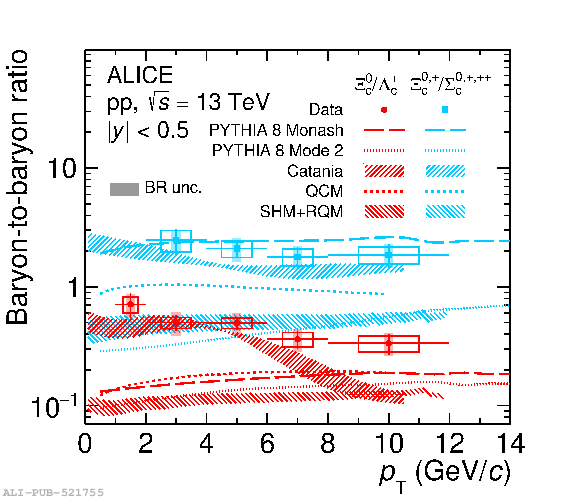 |