Measurement of visible cross sections in proton-lead collisions at $\sqrt{s_{\rm NN}}$ = 5.02 TeV in van der Meer scans with the ALICE detector

In 2013, the Large Hadron Collider provided proton-lead and lead-proton collisions at the center-of-mass energy per nucleon pair $\sqrt{s_{\rm{NN}}}=5.02$ TeV. Van der Meer scans were performed for both configurations of colliding beams, and the cross section was measured for two reference processes, based on particle detection by the T0 and V0 detectors, with pseudo-rapidity coverage $4.6<\eta< 4.9$, $-3.3<\eta<-3.0$ and $2.8<\eta< 5.1$, $-3.7<\eta<-1.7$, respectively. Given the asymmetric detector acceptance, the cross section was measured separately for the two configurations. The measured visible cross sections are used to calculate the integrated luminosity of the proton-lead and lead-proton data samples, and to indirectly measure the cross section for a third, configuration-independent, reference process, based on neutron detection by the Zero Degree Calorimeters.


JINST 9 (2014) 1100
e-Print: arXiv:1405.1849 | PDF | inSPIRE
CERN-PH-EP-2014-087

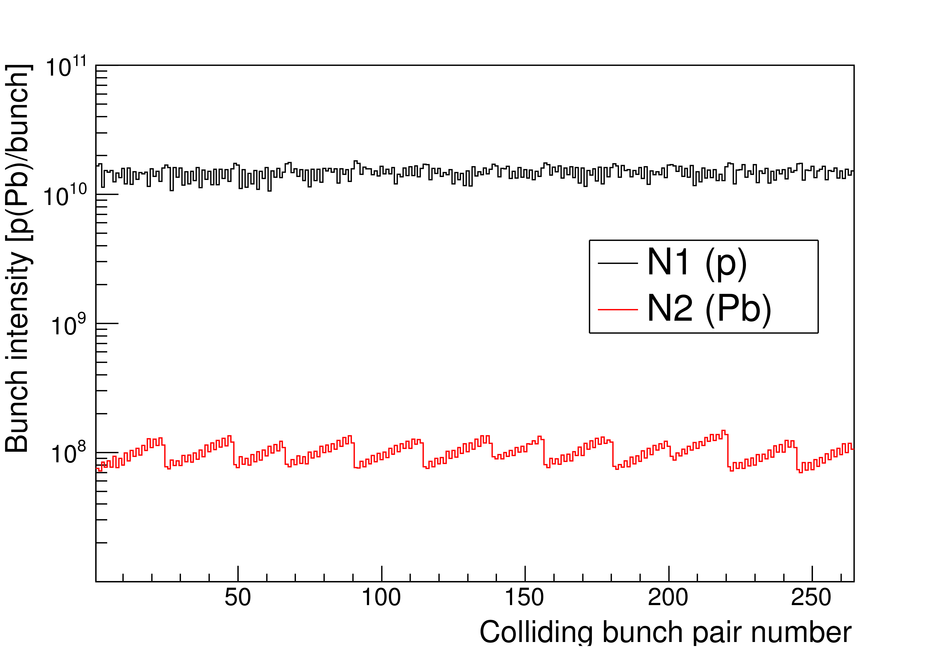
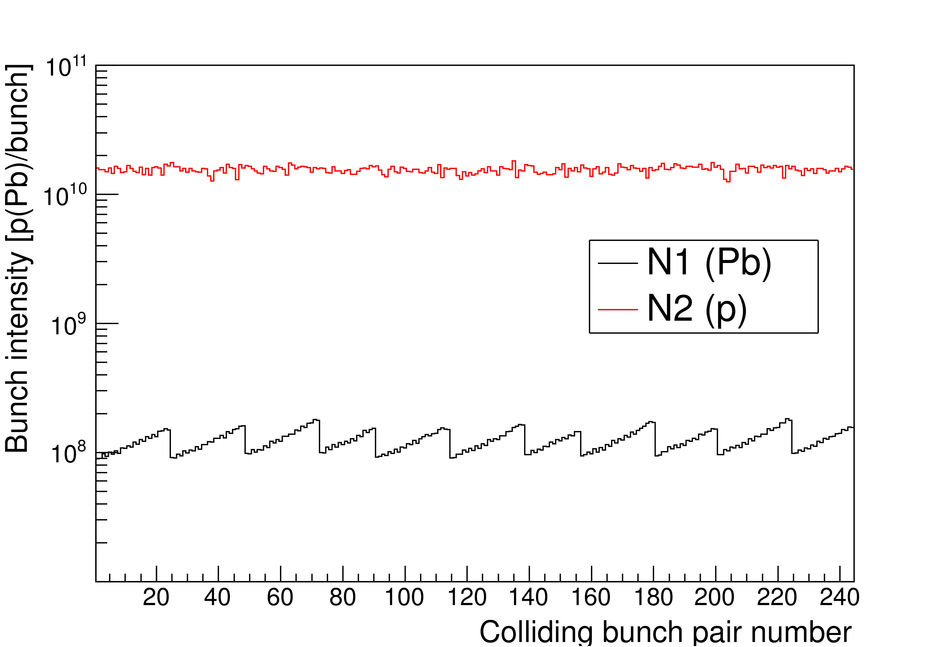
Figure 1

Bunch intensities $N_1$ and $N_2$ for all colliding bunches, for an arbitrary timestamp during the p-Pb (top) and Pb-p (bottom) scan sessions.

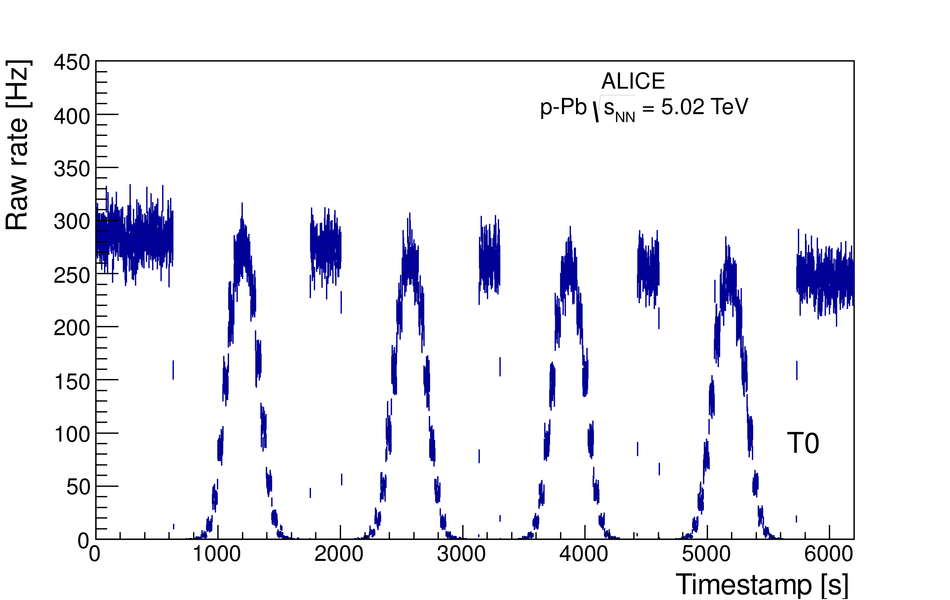
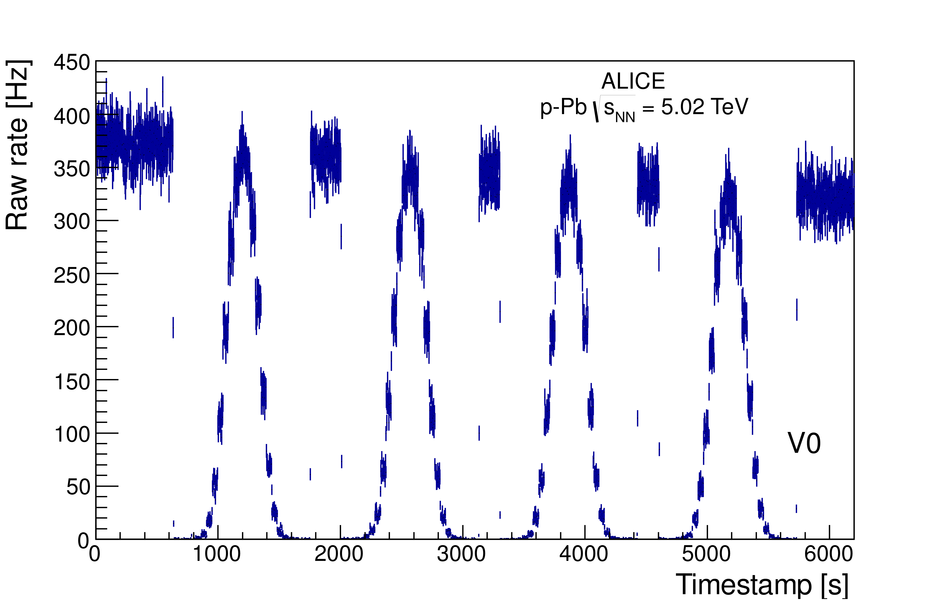
Figure 2

Raw rate of the T0 (top) and V0 (bottom) process for a typical colliding bunch pair, as a function of time, during the p-Pb scan session. In each plot, the first (second) bell-shaped structure corresponds to the beam separation in the horizontal (vertical) direction being varied from negative to positive values. The third (fourth) bell-shaped structure corresponds to the beam separation in the horizontal (vertical) direction being varied from positive to negative values.

Figure 3

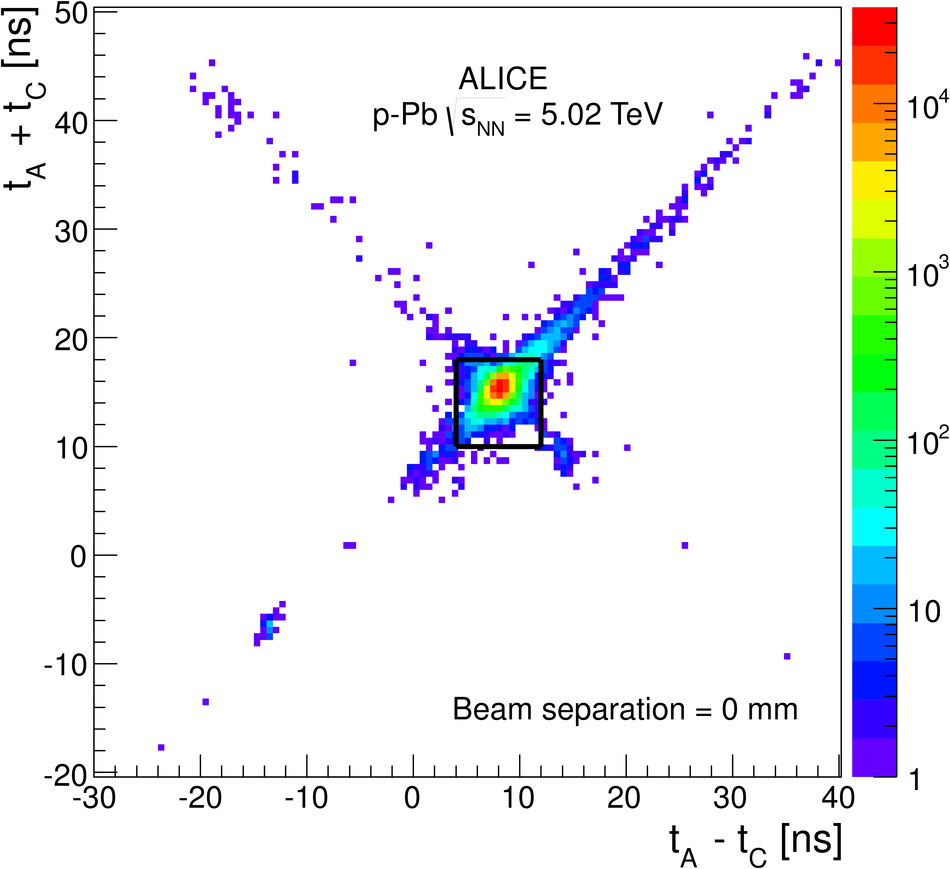
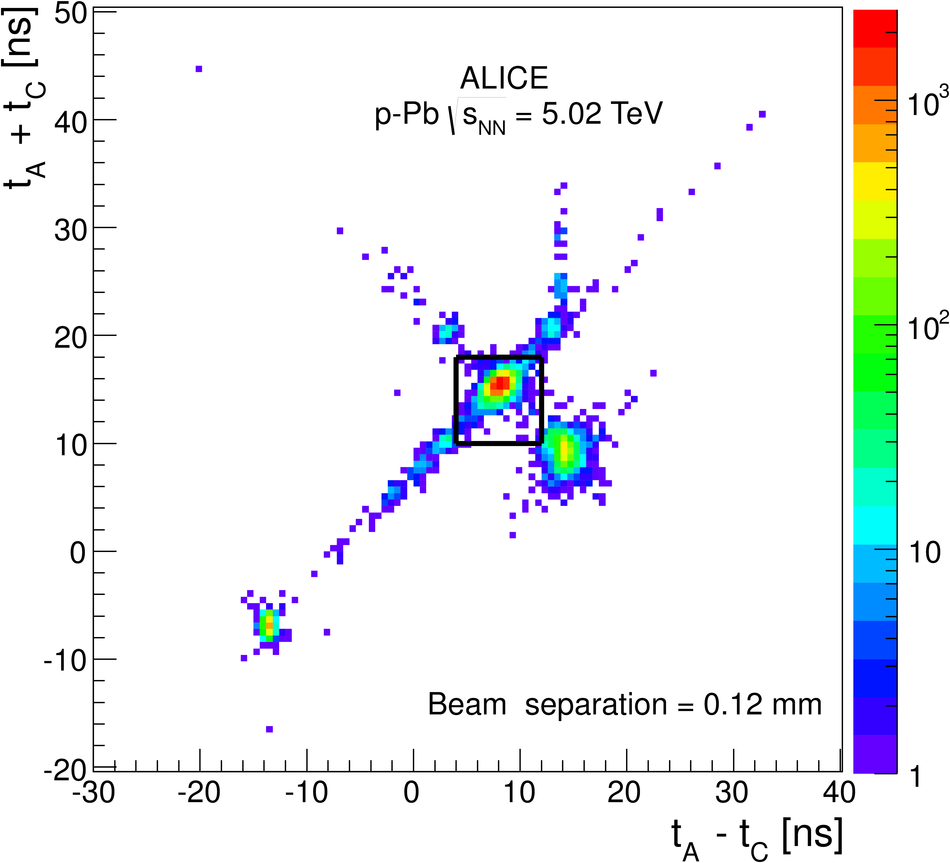
Correlation between the sum and difference of arrival times (relative to the bunch crossing) on the two V0 arrays. The top plot was obtained at zero beam separation; the bottom plot was obtained at a beam separation of 0.12 mm, roughly corresponding to five times the RMS of the beam profile. Events lying inside the area within the continuous lines are flagged as beam-beam interactions.

Figure 4

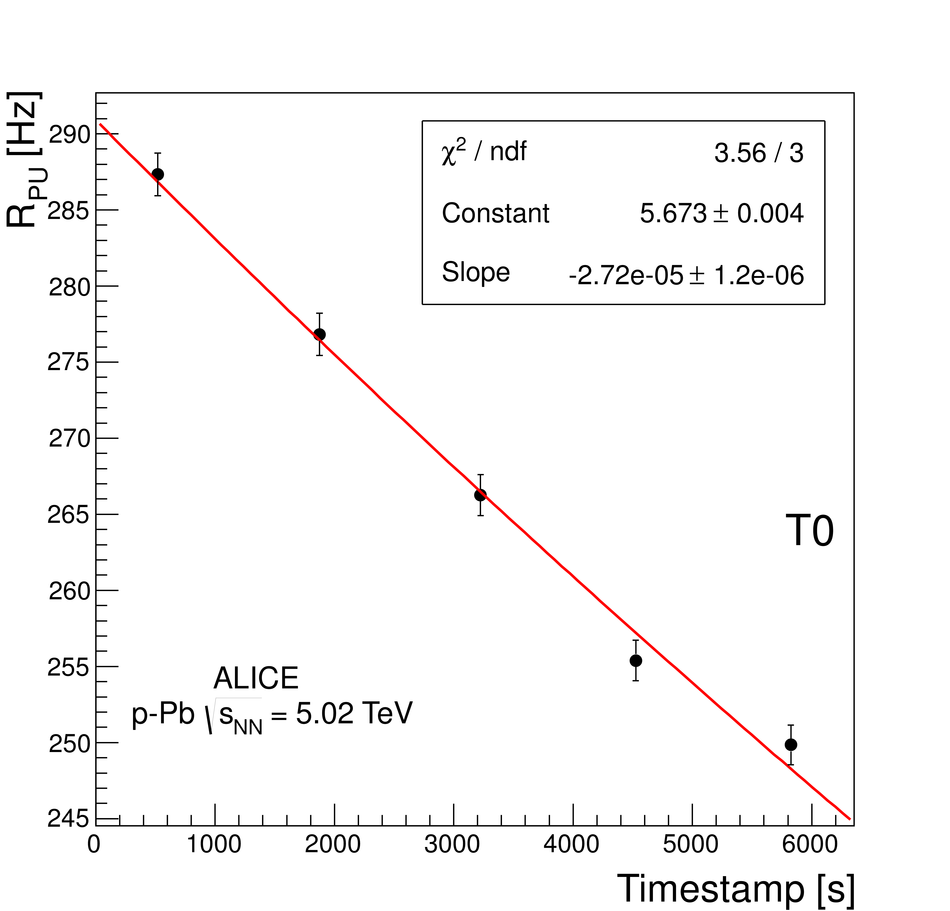
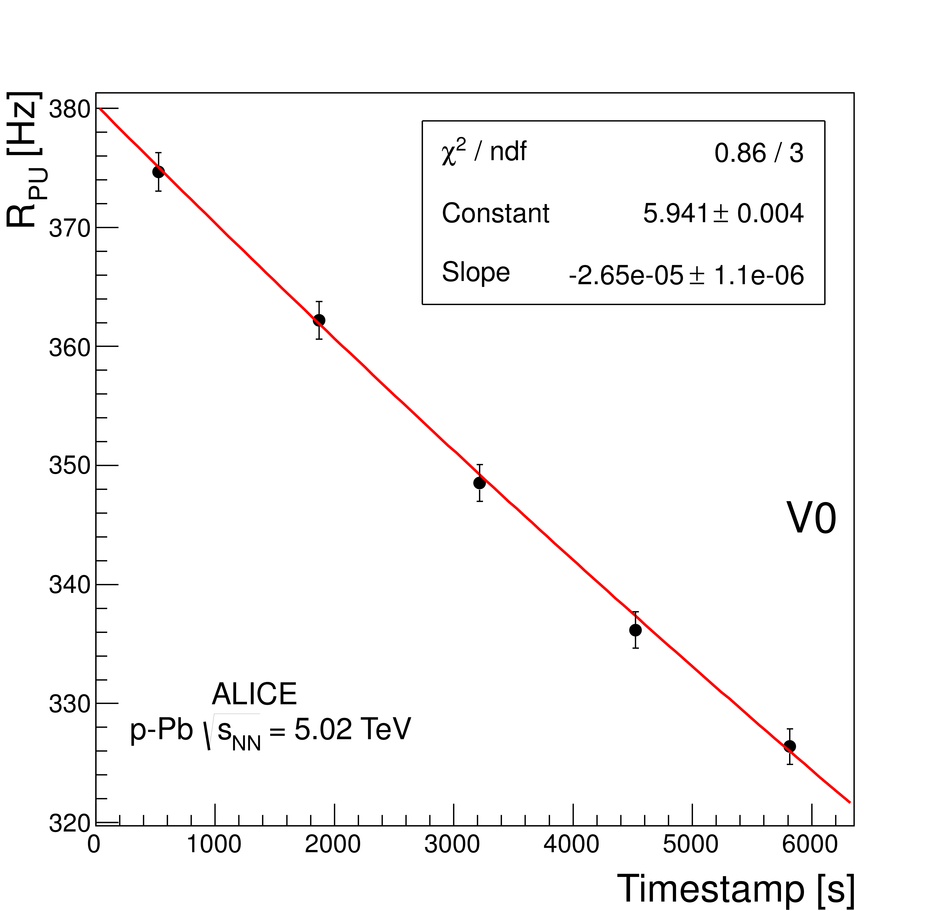
Background- and pileup-corrected head-on rates of the T0 (top) and V0 (bottom) reference process as a function of time for one interacting bunch crossing in the p-Pb scan session. The solid red curve is an exponential fit to the data points.

Figure 5

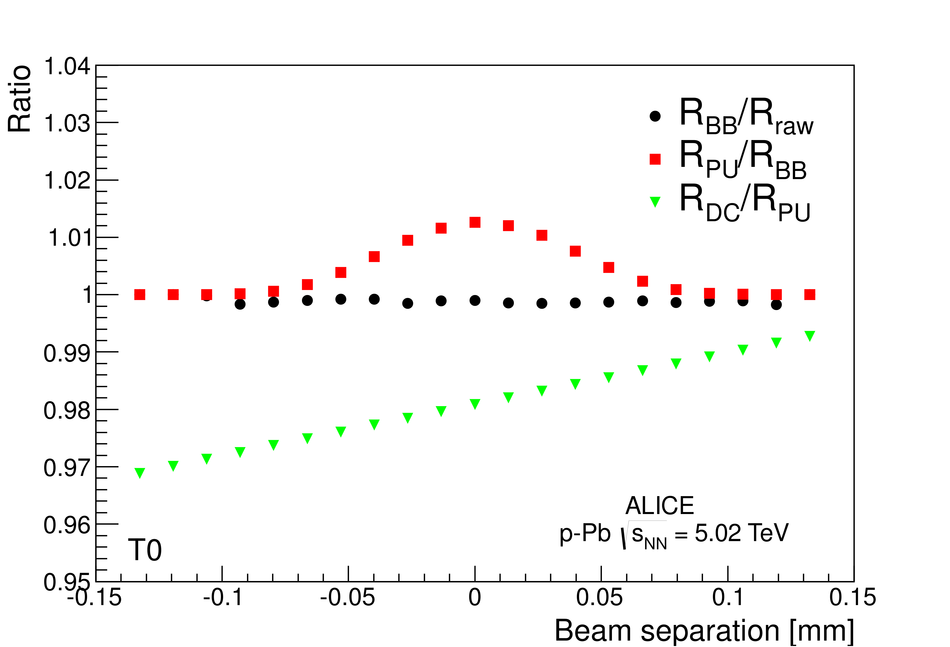
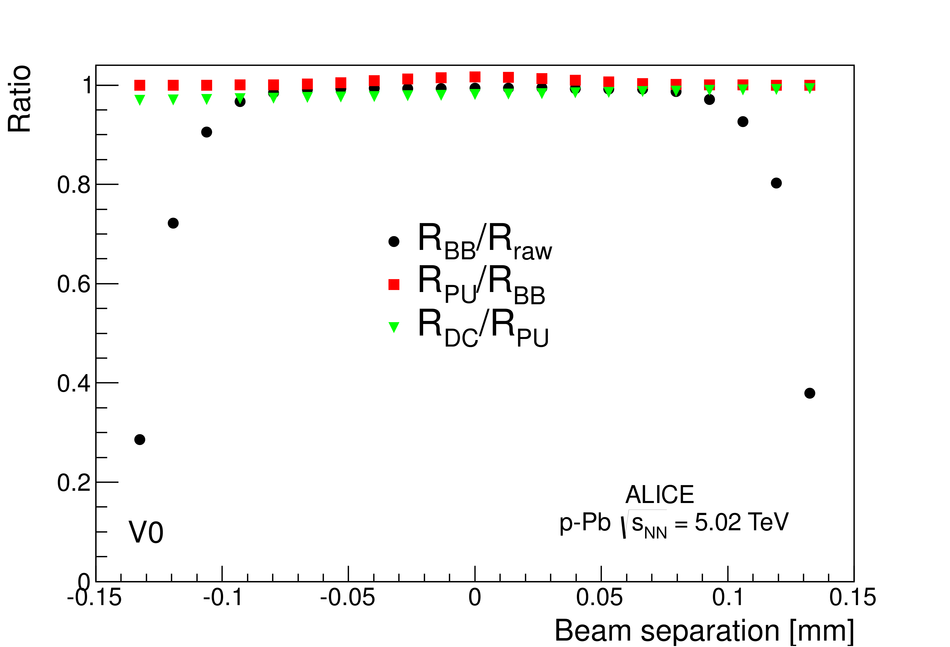
Background (R$_{\rm{BB}}$/R$_{\rm{raw}}$), pileup (R$_{\rm{PU}}$/R$_{\rm{BB}}$) and luminosity decay (R$_{\rm{DC}}$/R$_{\rm{PU}}$) correction factors to the T0 (top) and V0 (bottom) rates as a function of the beam separation for one typical pair of colliding bunches during the first p-Pb vertical scan. Due to the different size of the background correction factor for T0 and V0, the two figures have different vertical scales.

Figure 6

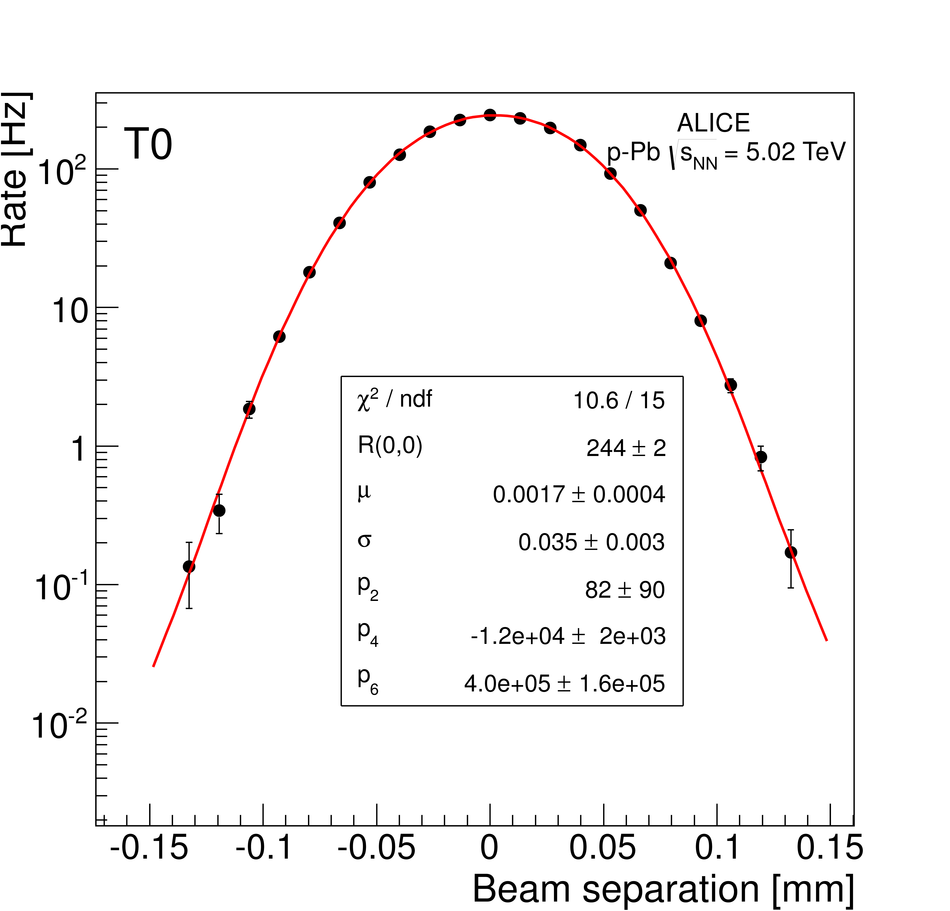
Rates of the T0 (top) and V0 (bottom) reference process as a function of beam separation for one typical pair of colliding bunches in the first vertical p-Pb scan. The solid red curve is a fit according to Equation 4.

Figure 7

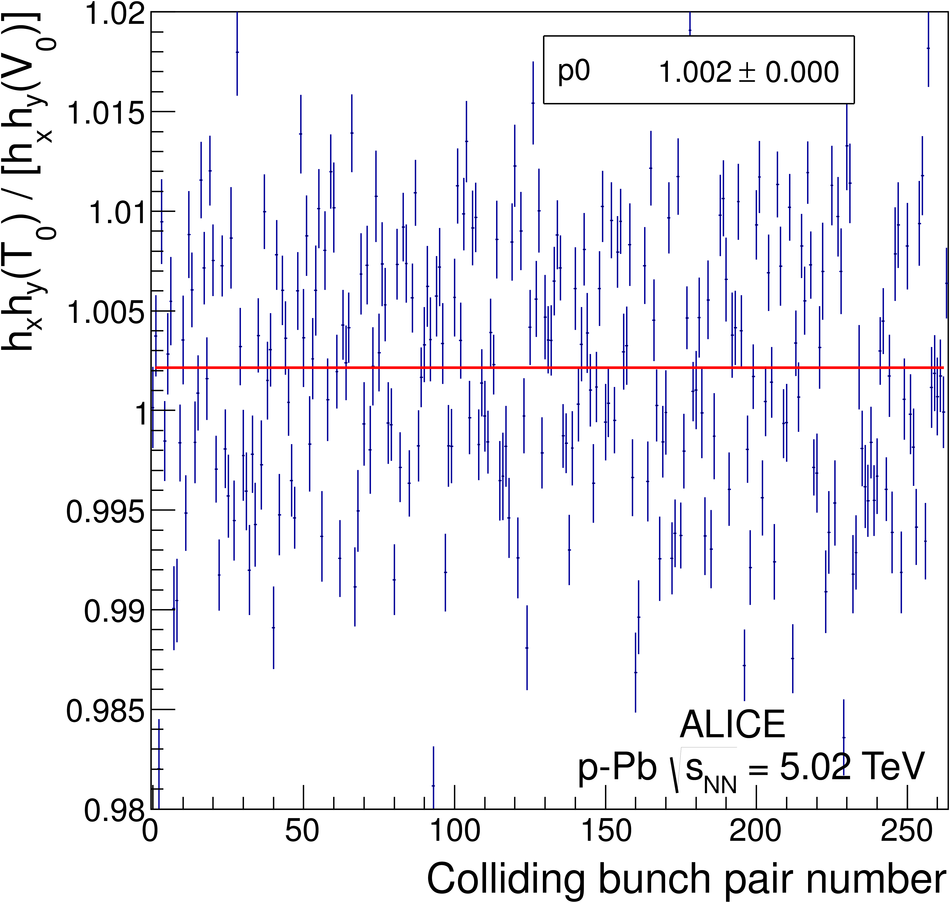
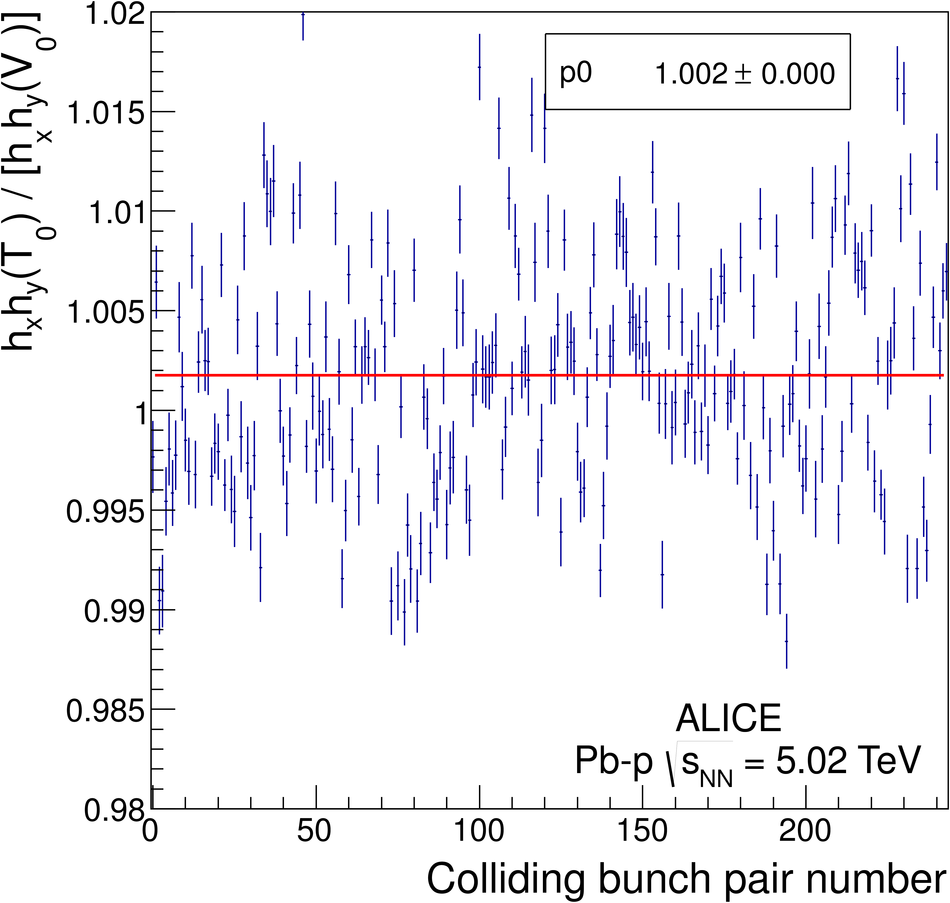
Ratio between the $h_xh_y$ quantities obtained (via numerical method) with the T0 and V0 reference processes in the p-Pb (top) and Pb-p (bottom) scan session, as a function of the colliding bunch pair ID number. The solid red lines are zero-order-polynomial fits to the data.

Figure 8

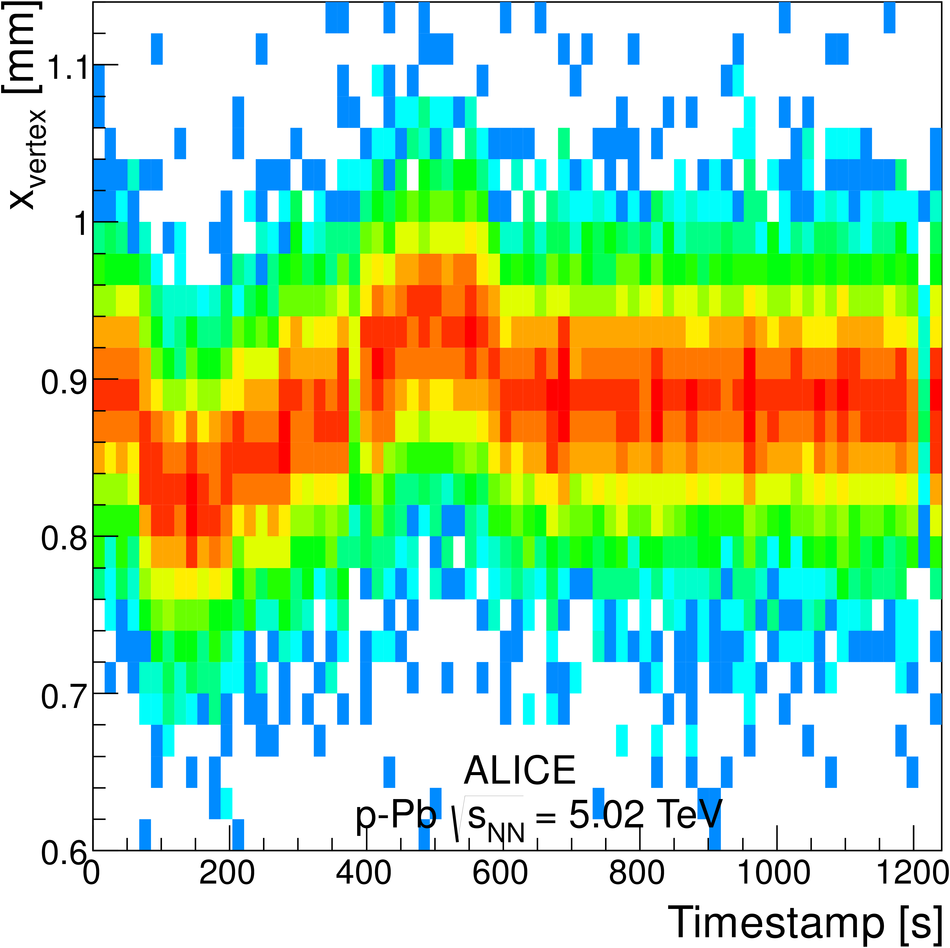
Top: distribution of the horizontal interaction vertex coordinate as a function of time during the length-scale calibration run. The structure visible in the timestamp region between $\simeq$100s and $\simeq$600s corresponds to the beams being moved in five steps of 28$\mu$m each.
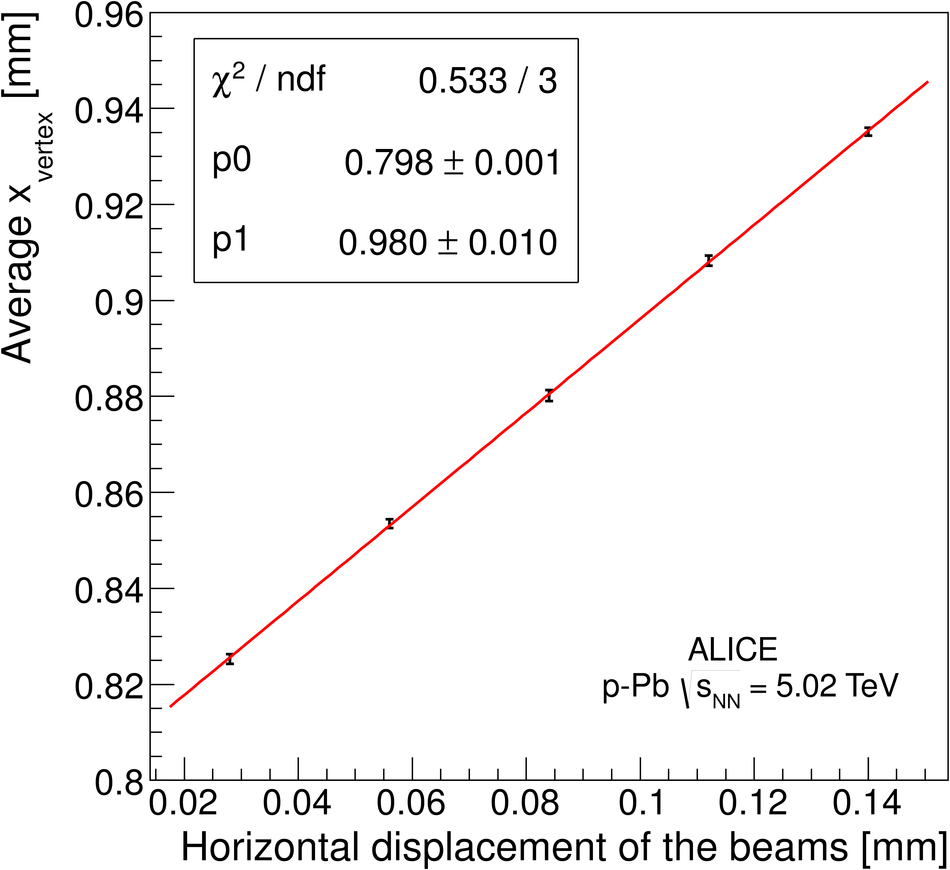
Bottom: average horizontal vertex coordinate as a function of the nominal horizontal beam displacement in the length-scale calibration run, with superimposed linear fit (solid red line).

Figure 9

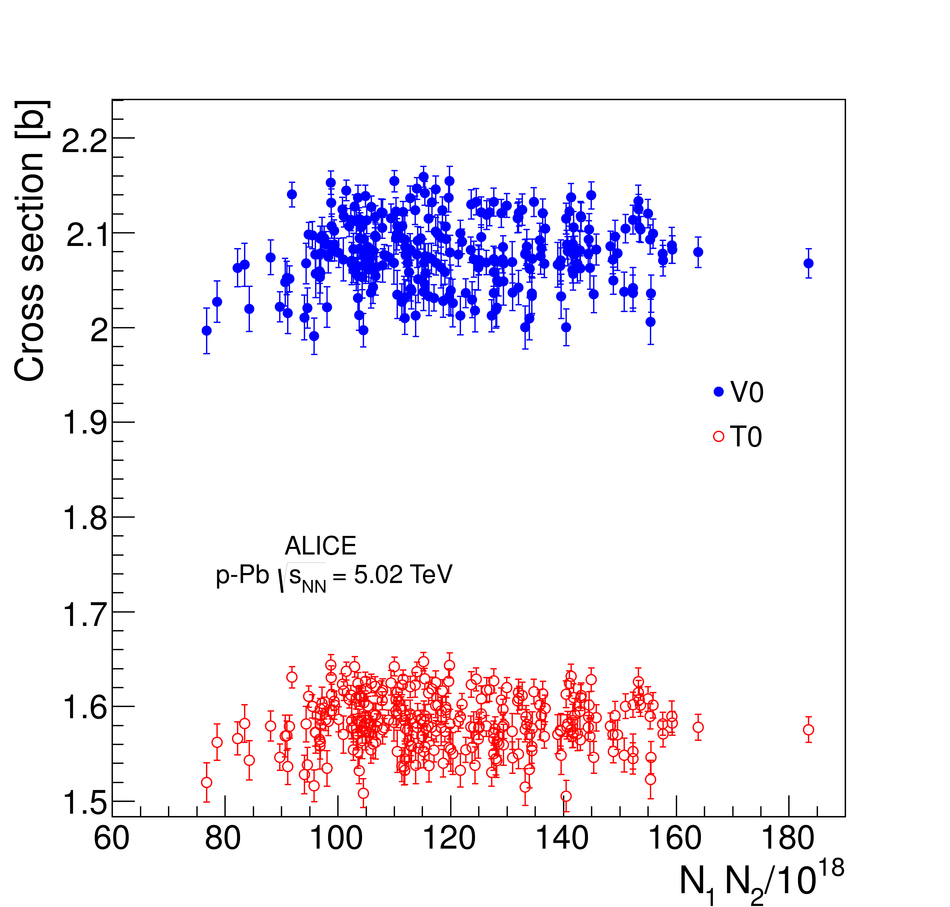
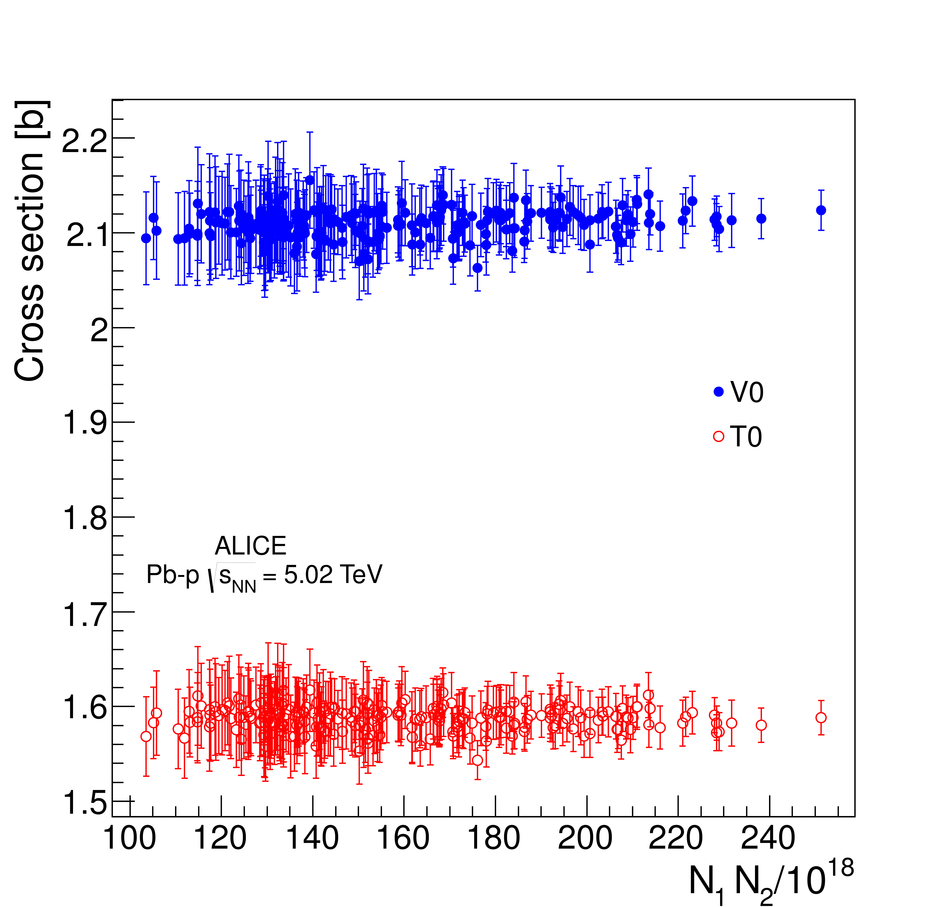
Cross sections for the T0 and V0 processes measured in the first scan of the p-Pb (top) and Pb-p (bottom) sessions, as a function of the product of the intensities of the colliding bunch pair. The results are obtained with the numerical method. Only the statistical uncertainties are shown.

Figure 10

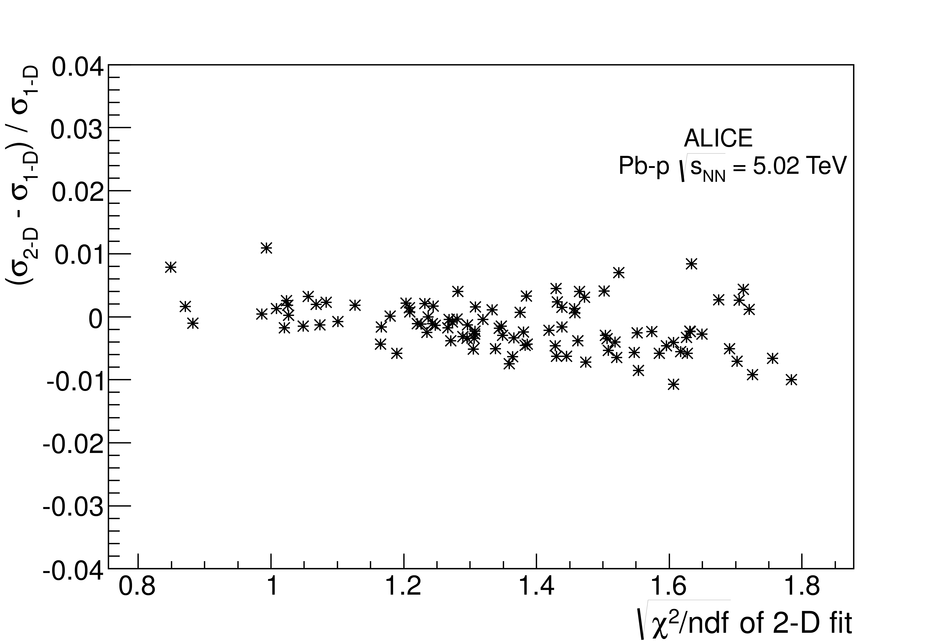
Relative difference between the cross section obtained with the two-dimensional DG2D and the one-dimensional gPol6 fit models, as a function of the $\sqrt{\chi^{2}/ndf}$ value of the two-dimensional fit, for $\chi^{2}/ndf$< $105/32$.
Top: results for V0 in the first p-Pb scan.
Bottom: results for V0 in the first Pb-p scan.

Figure 11

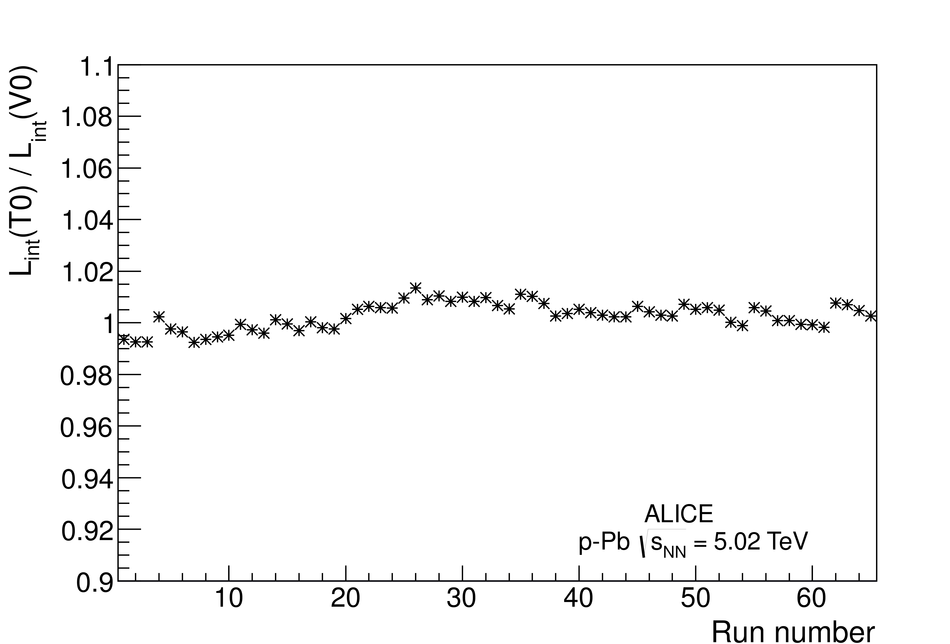
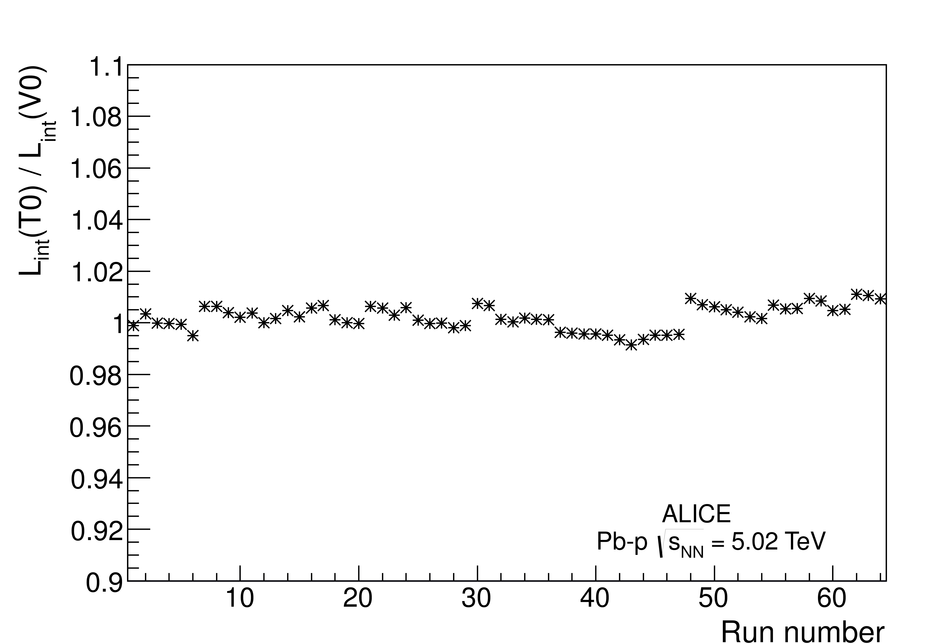
Ratio of T0- to V0-based integrated luminosities as a function of run number for the p-Pb (top) and Pb-p (bottom) data taking. The tiny statistical uncertainties are covered by the data-point markers.