The first experimental information on the strong interaction between $\Lambda$ and $\Xi^-$ strange baryons is presented in this Letter. The correlation function of $\Lambda-\Xi^-$ and $\overline{\Lambda}-\overline{\Xi}^{+}$ pairs produced in high-multiplicity proton-proton (pp) collisions at $\sqrt{s}$ = 13 TeV at the LHC is measured as a function of the relative momentum of the pair. The femtoscopy method is used to calculate the correlation function, which is then compared with theoretical expectations obtained using a meson exchange model, chiral effective field theory, and Lattice QCD calculations close to the physical point. Data support predictions of small scattering parameters while discarding versions with large ones, thus suggesting a weak $\Lambda-\Xi^{-}$ interaction. The limited statistical significance of the data does not yet allow one to constrain the effects of coupled channels like $\Sigma-\Xi$ and N$-\Omega$.
Phys. Lett. B 844 (2023) 137223
HEP Data
e-Print: arXiv:2204.10258 | PDF | inSPIRE
Figure group
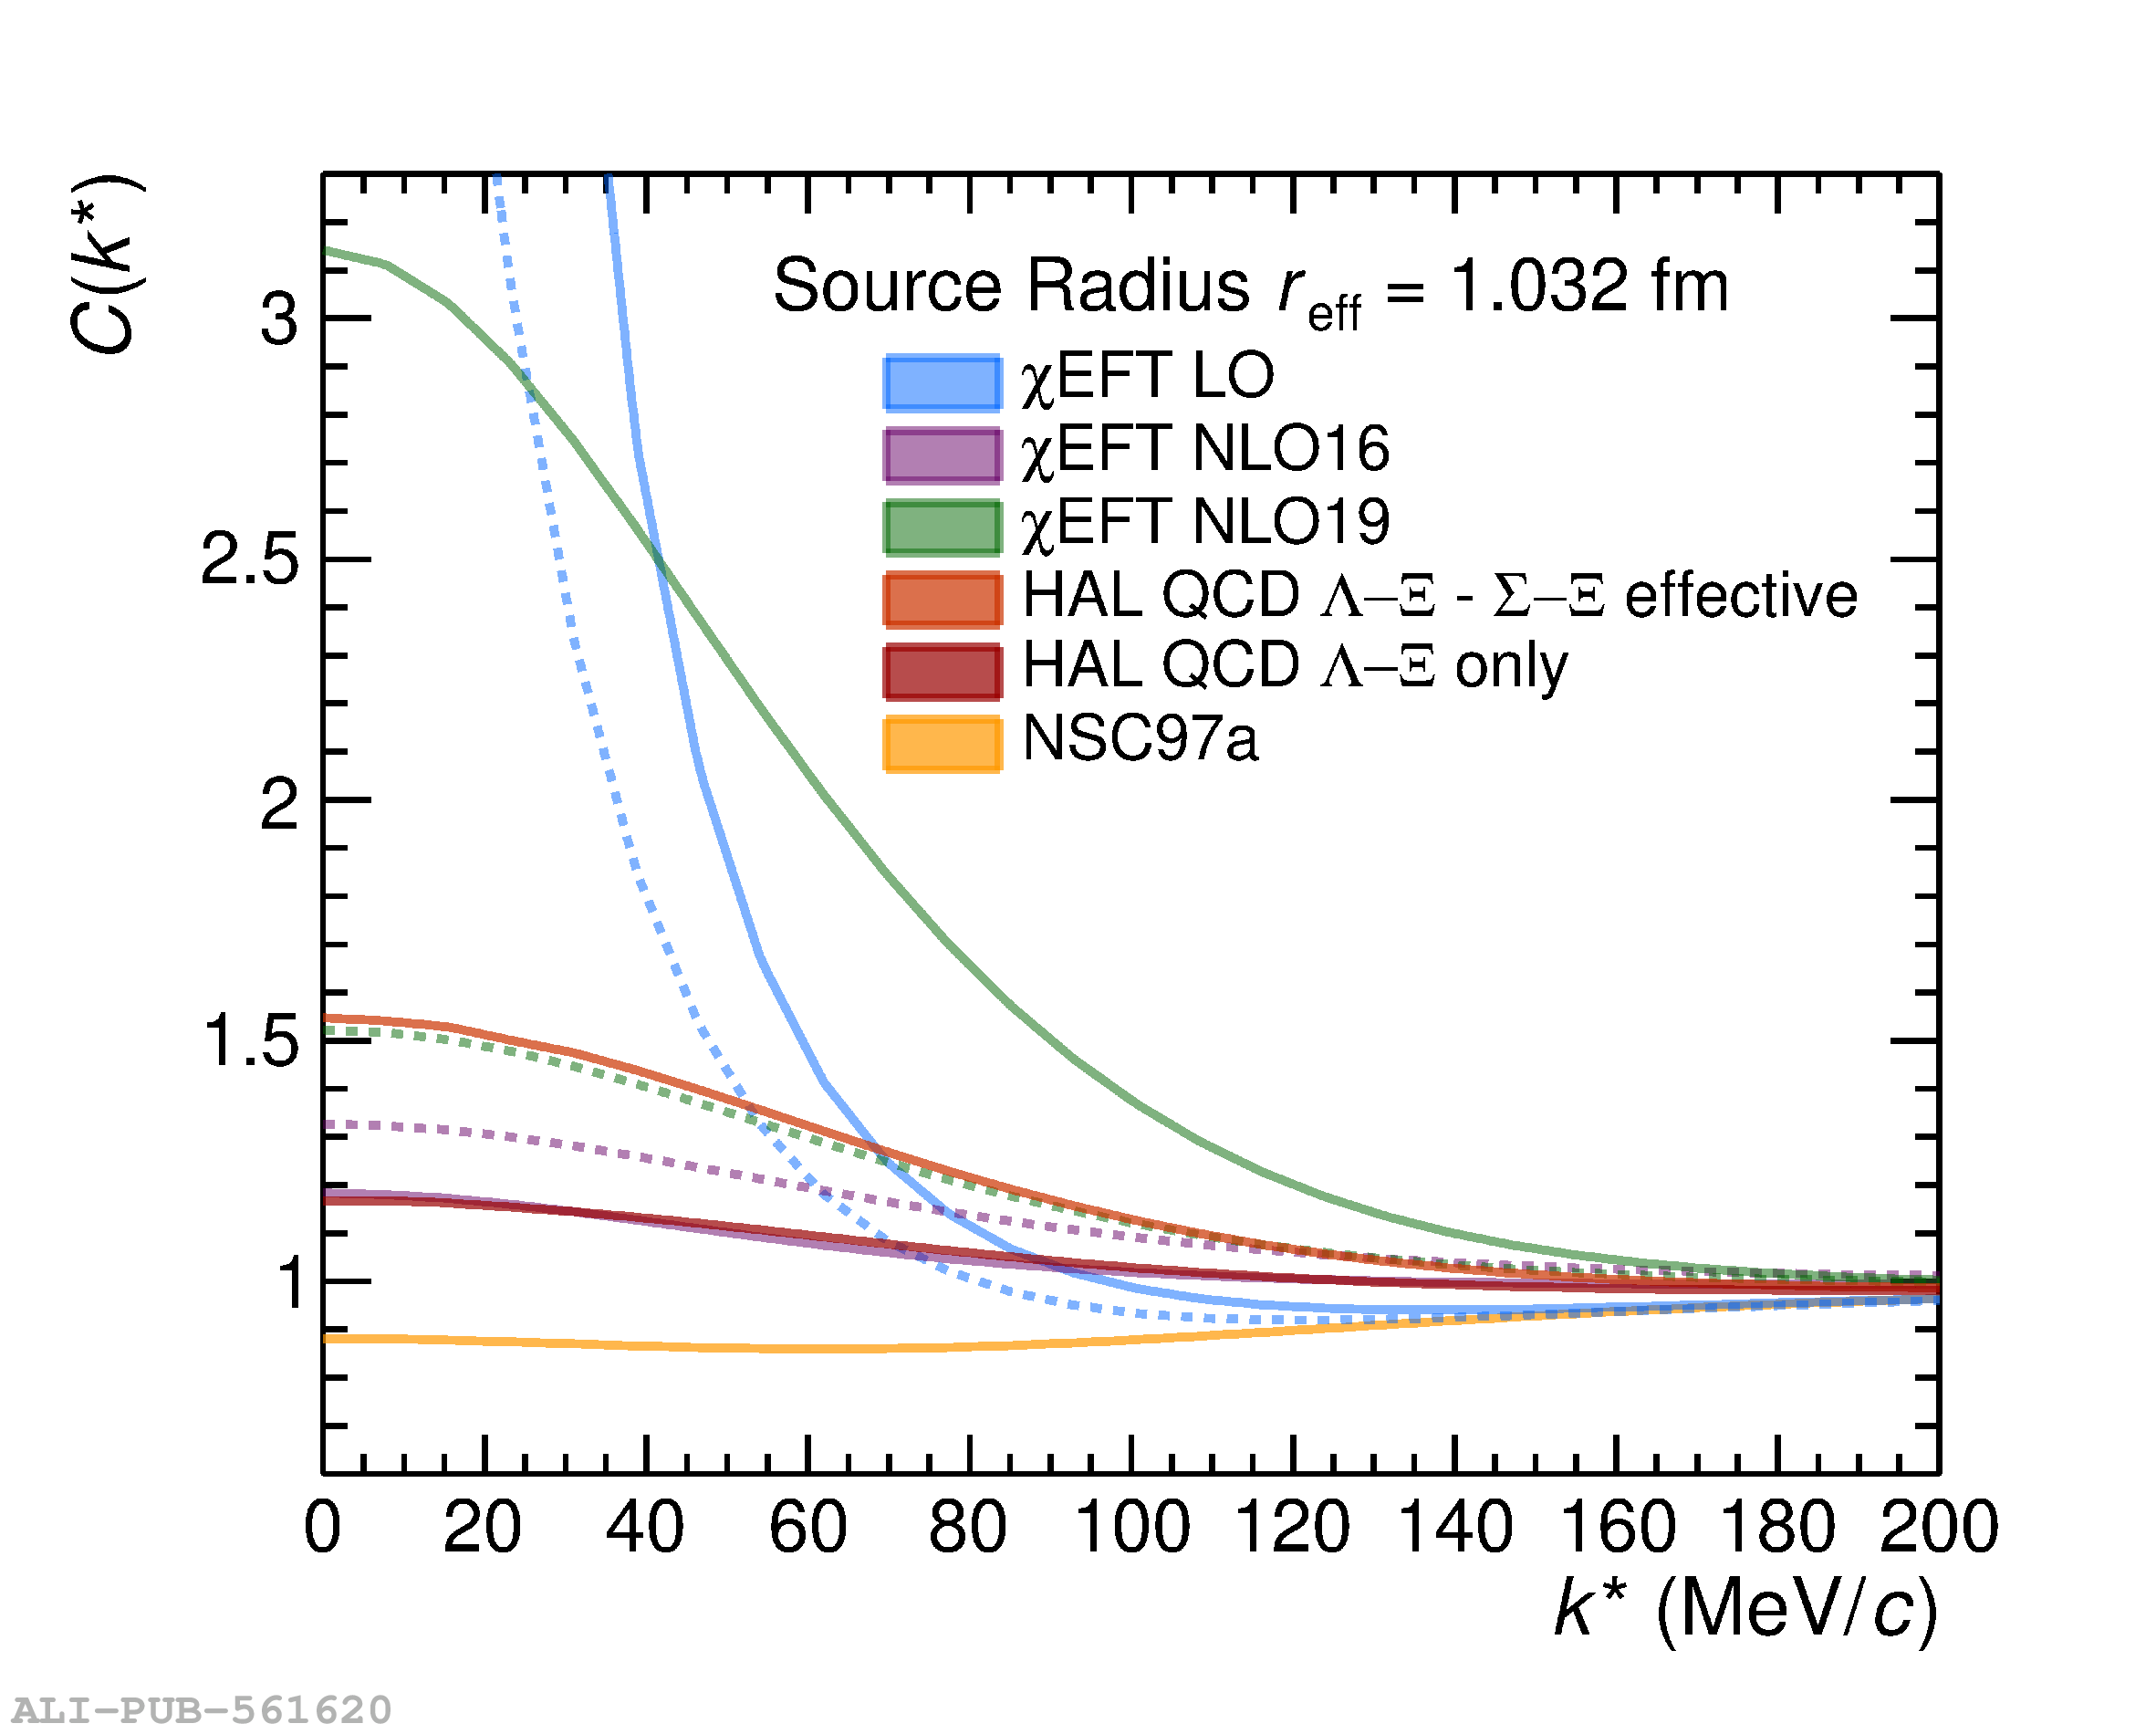
Figure 2
Experimental \LXi\ correlation function with statistical (vertical black lines) and systematic (gray boxes) uncertainties. The square brackets show the bin width of the measurement and the horizontal black lines represent the statistical uncertainty in the determination of the mean \kstar\ for each bin. Left panel: Comparison to LO and NLO \chEFT\ and NSC97a potentials evaluated with the Lednický--Lyuboshits model . In the $\chi$EFT models the darker and light bands correspond to the version with the lower and higher cut-off value, respectively. Right panel: Comparison with Lattice QCD calculations by the HAL QCD Collaboration using an effective potential including the coupling to $\Sigma$--$\Xi$ (orange) and the \LXi\ elastic potential alone (red). The width of the bands in both panels correspond to the systematic uncertainties of the fit as described in the text. The dotted black line represents the result of the baseline fit assuming no \LXi\ strong interaction. | 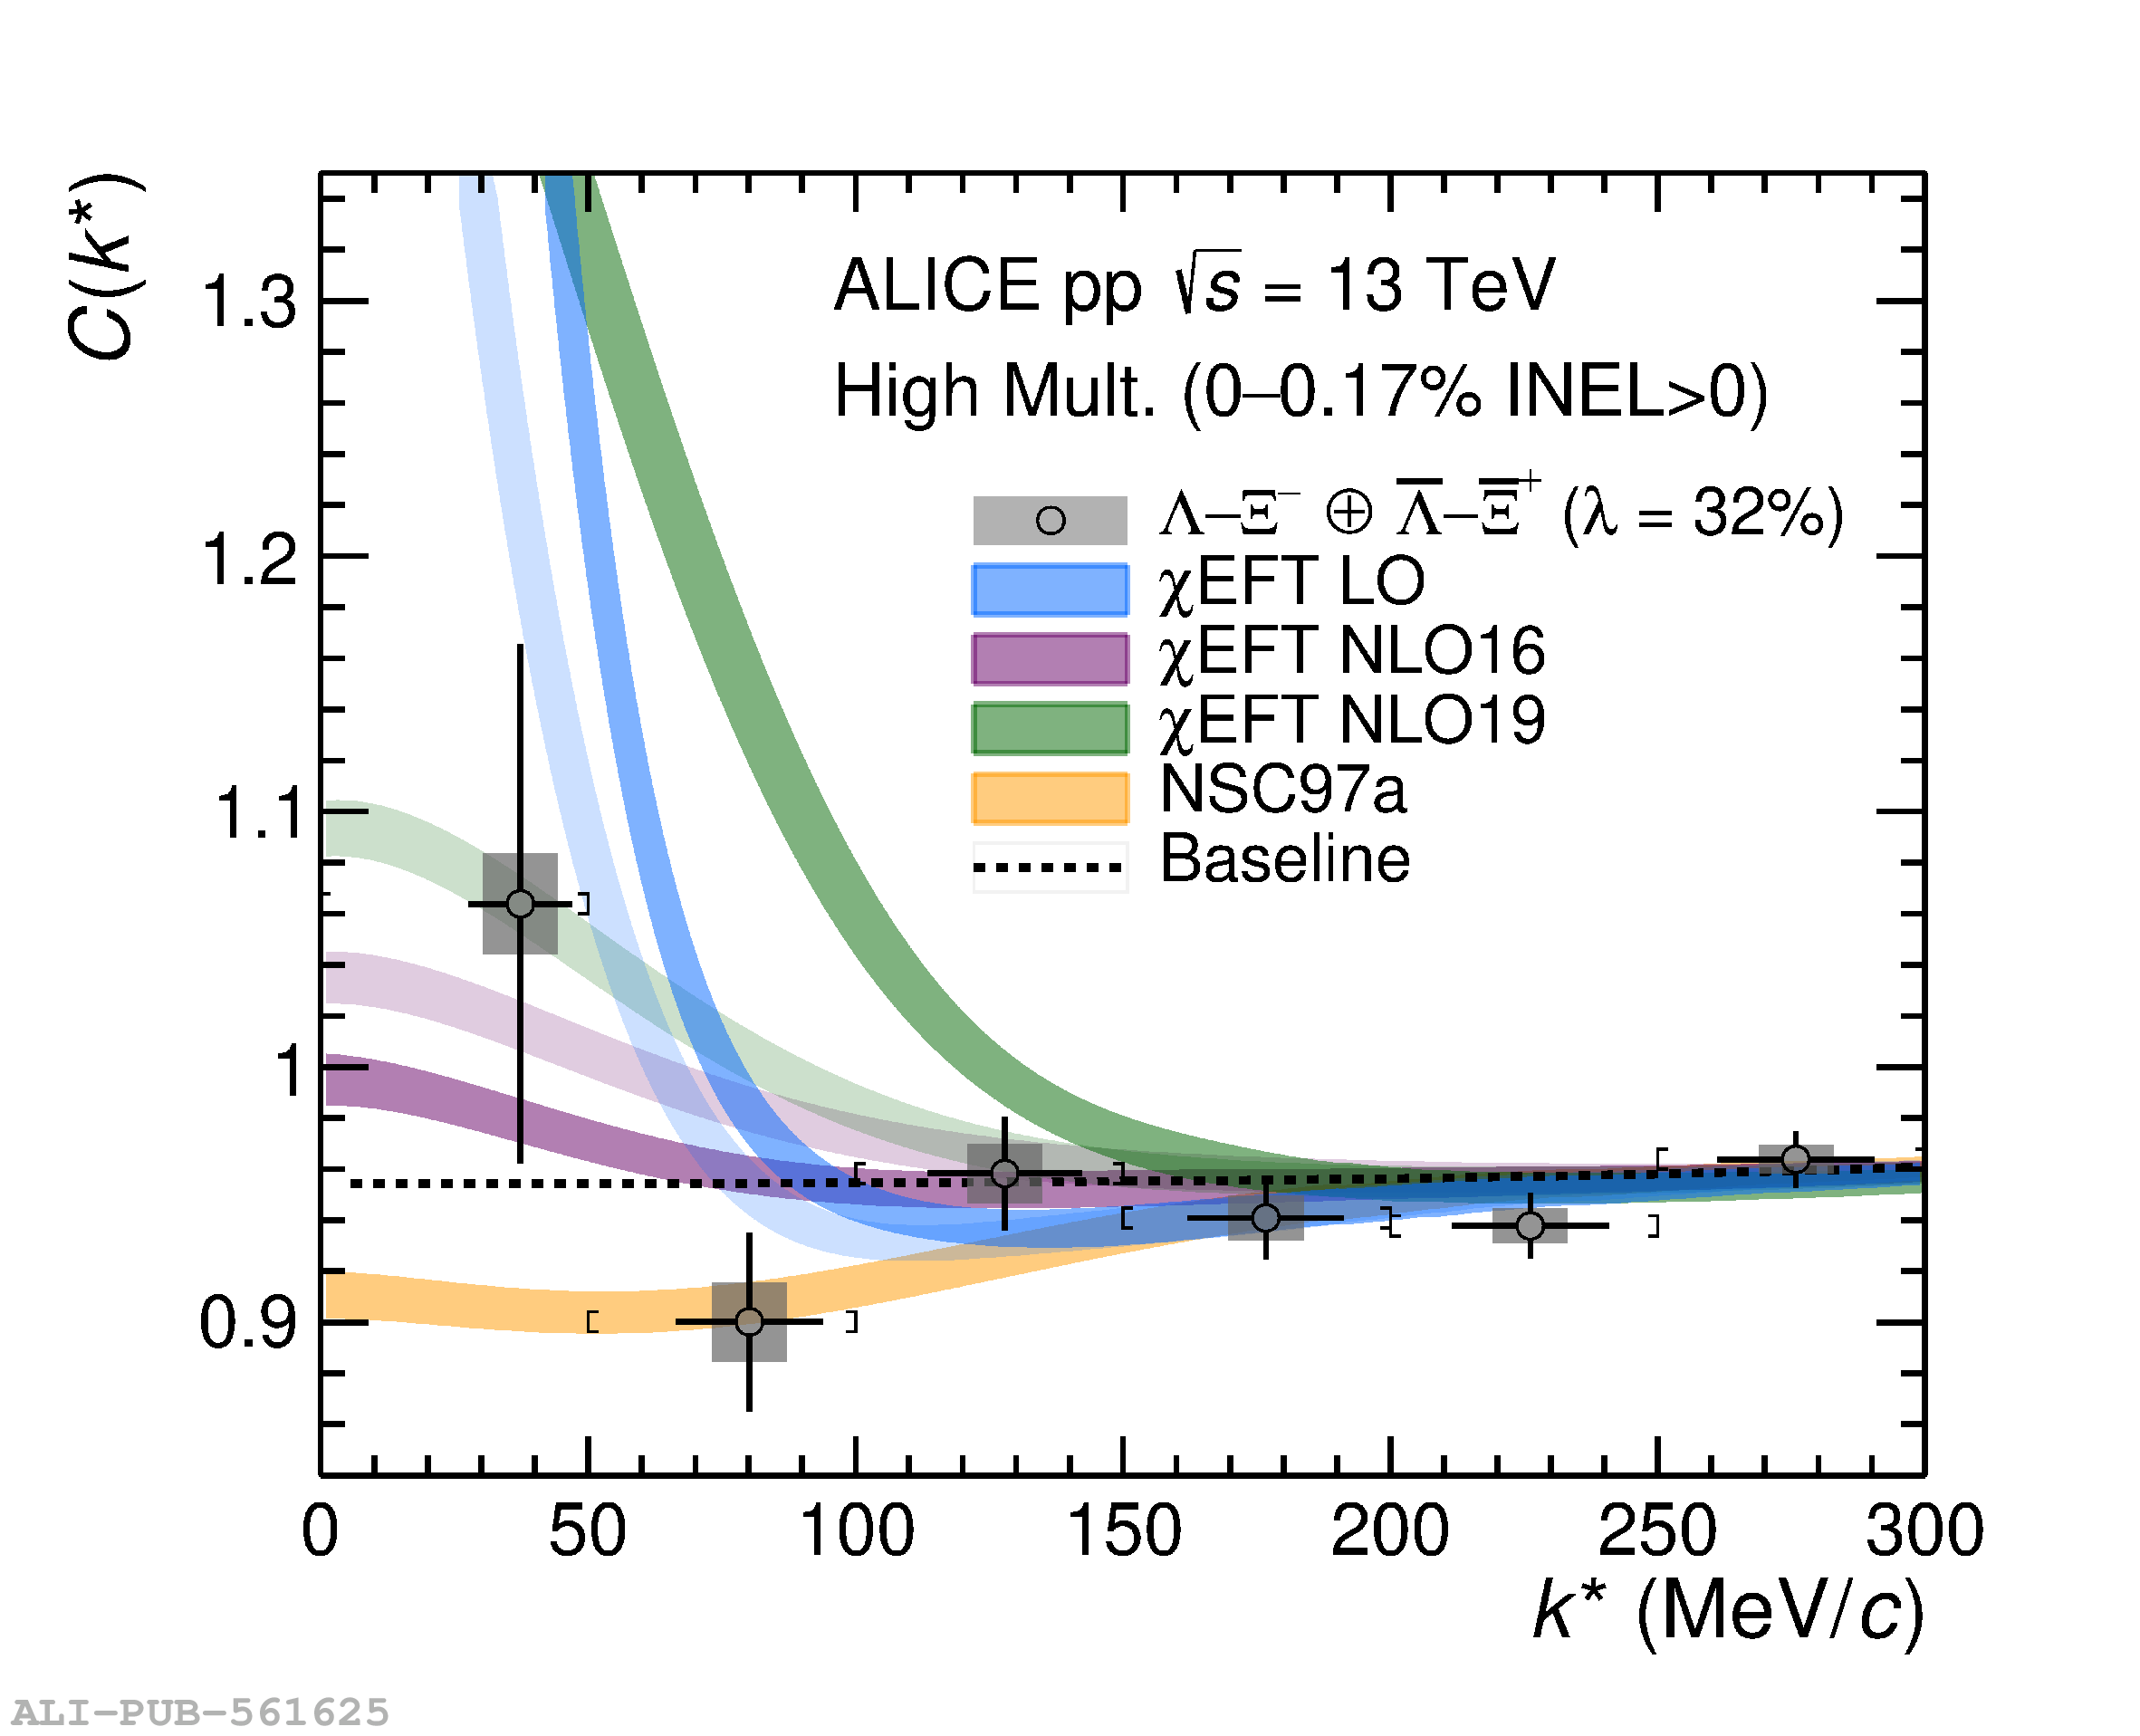 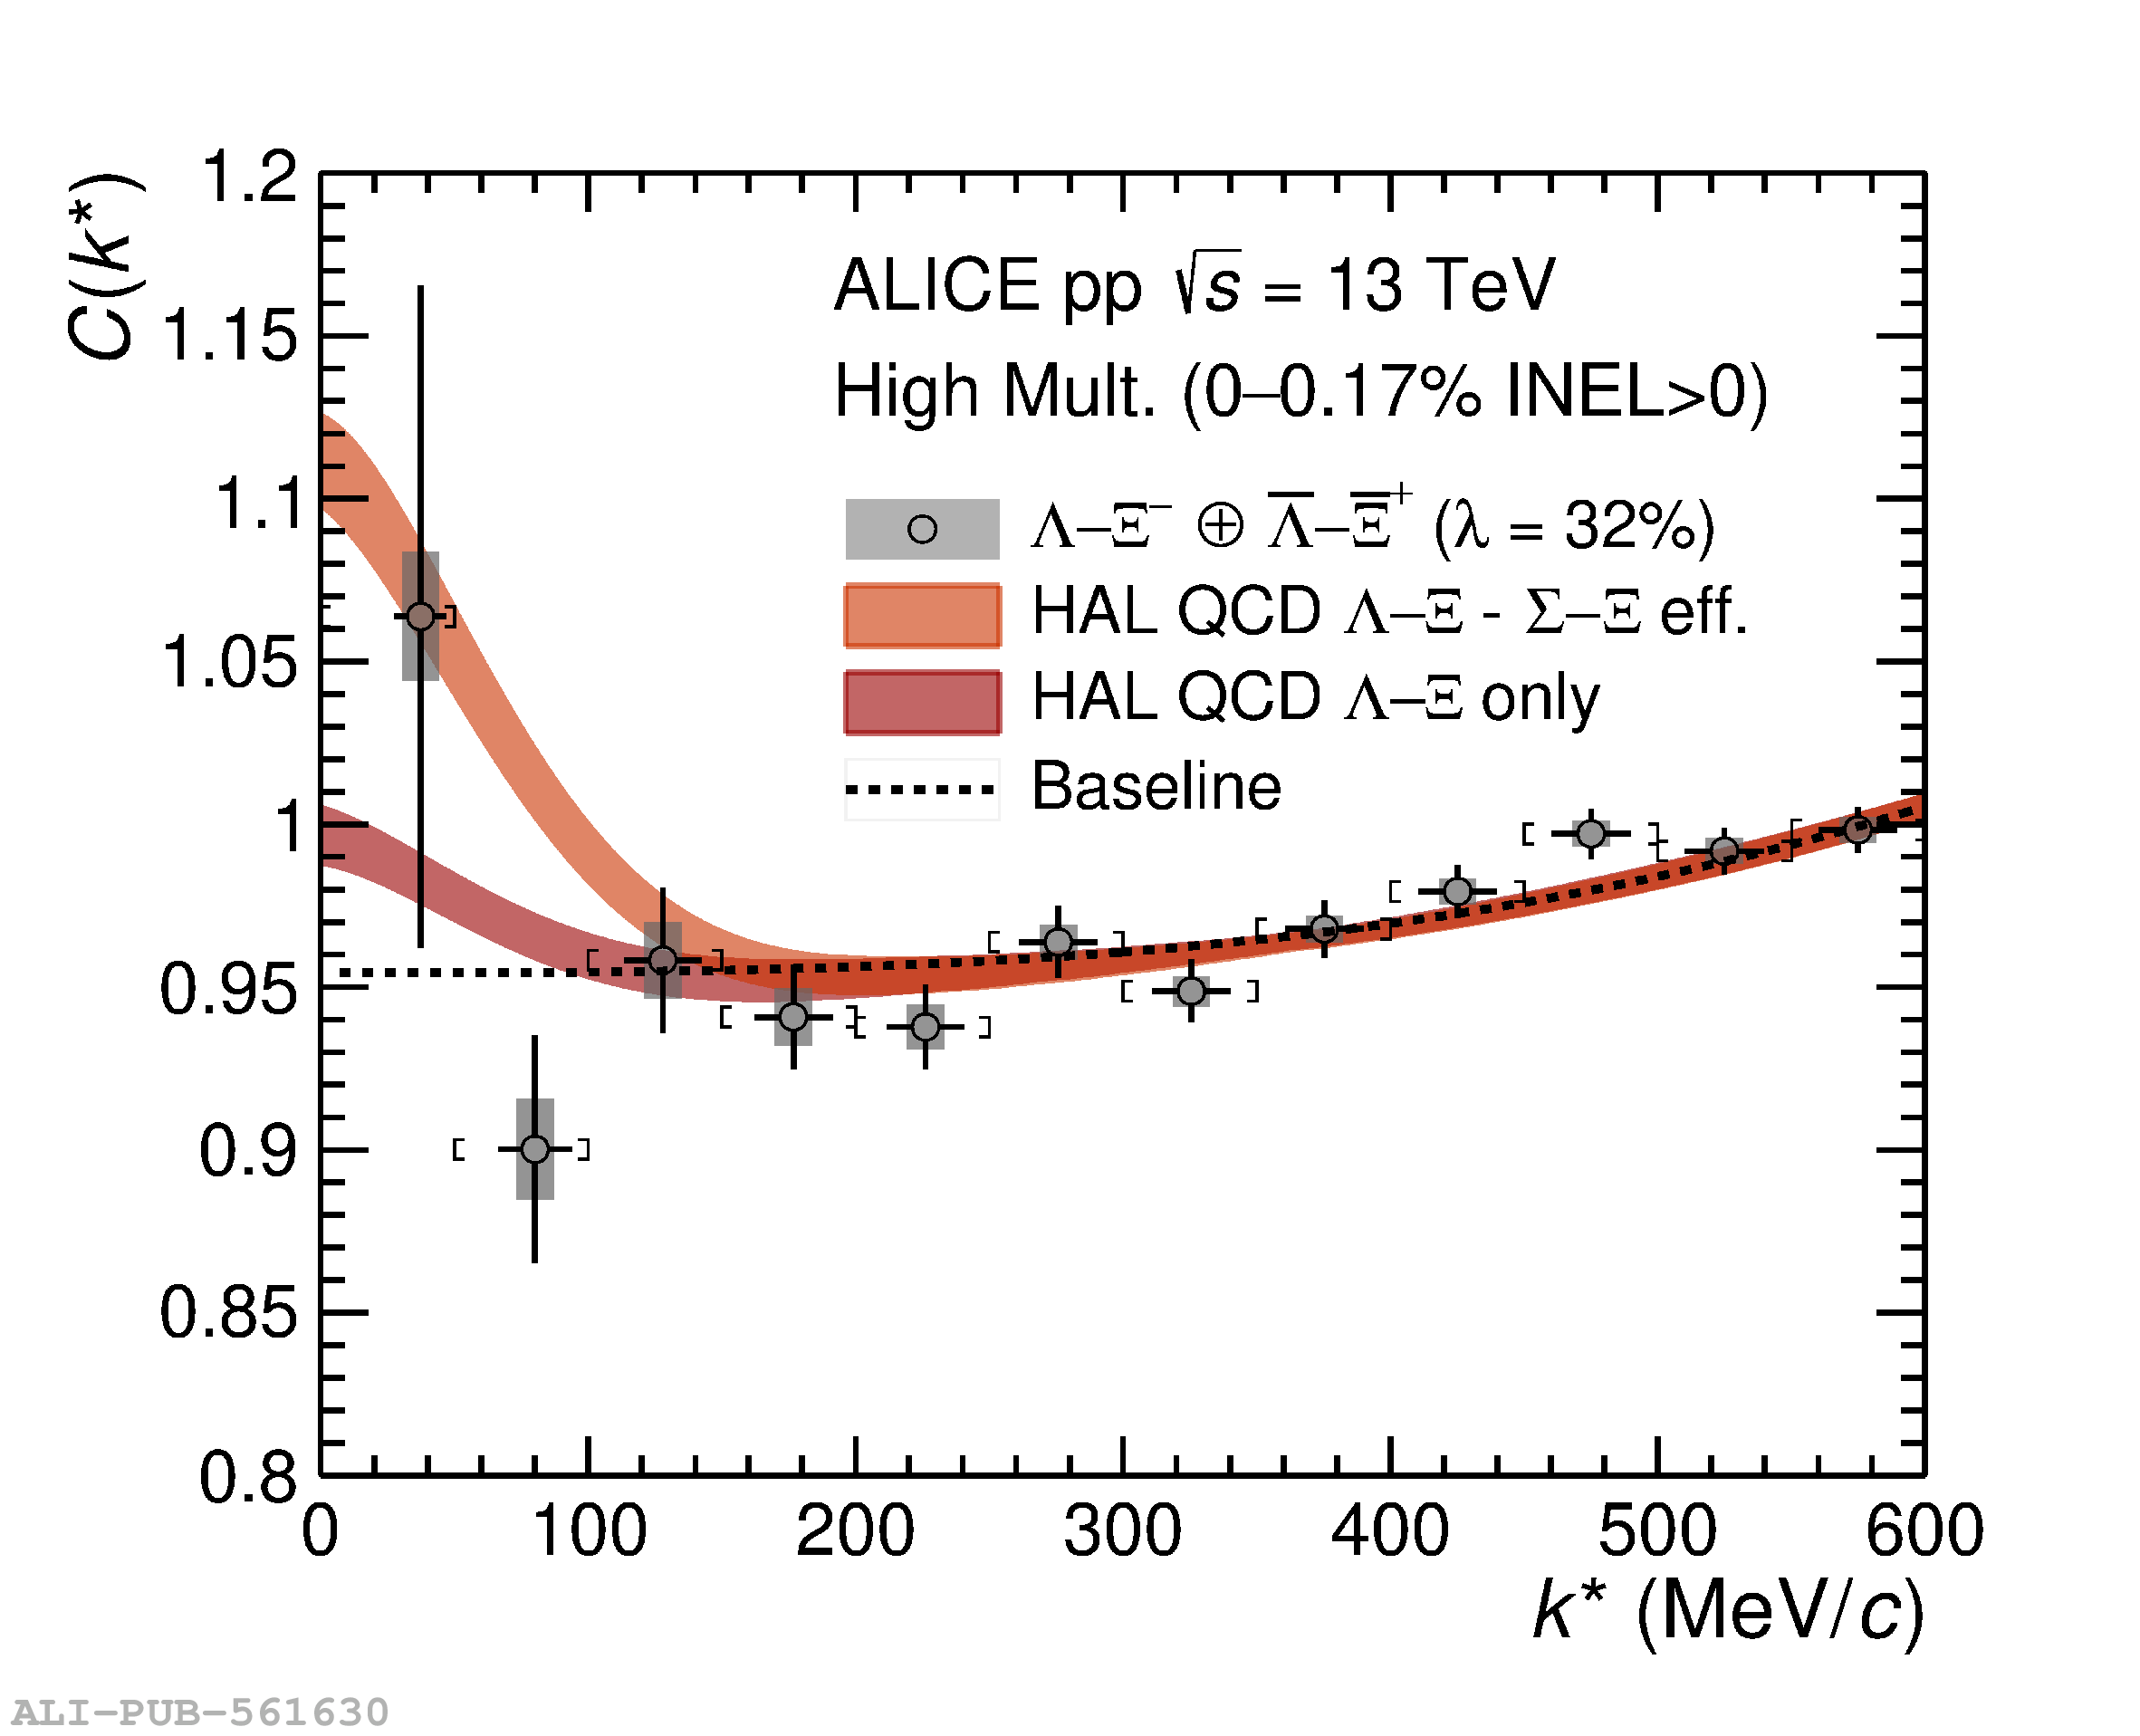 |