Inclusive \jpsi production cross section compared with calculations for the prompt \jpsi production cross section using ICEM , NLO NRQCD , LO NRQCD+CGC and for the non-prompt \jpsi from beauty-hadron feed-down using FONLL (left panel). Inclusive \jpsi production cross section compared with the corresponding calculations obtained as the sum of the prompt \jpsi component shown in the left panel and the non-prompt contribution from FONLL (right panel). The bottom panel shows the ratios between the model calculations and a fit to the data points. The bands illustrate the theoretical uncertainties centered around the ratio between the model calculation and the power-law fit to the data (see text for details). | 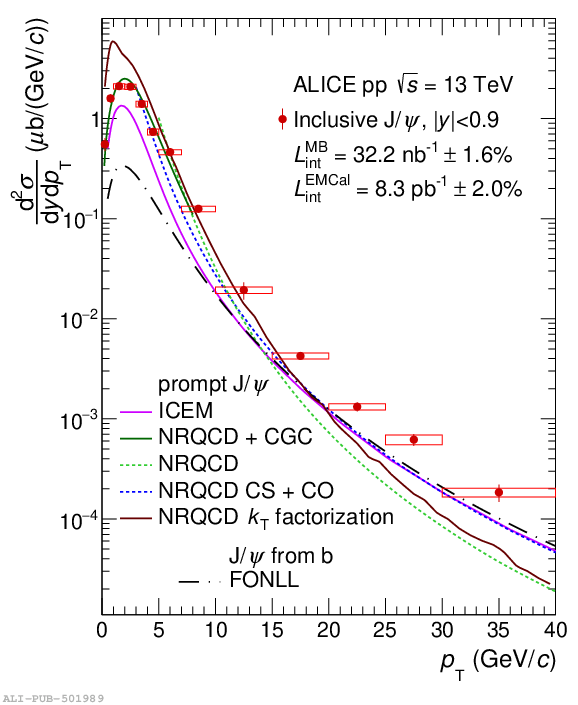 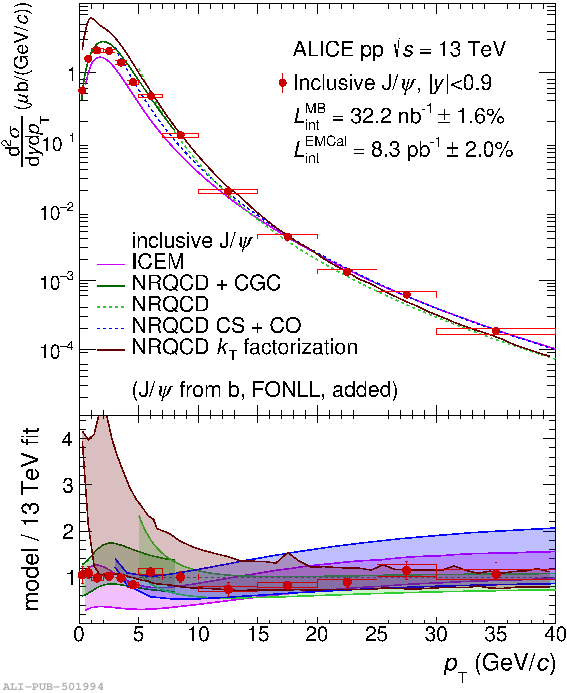 |