Invariant-mass distributions for SE \ee pairs in two \ptee intervals from the MB event analysis (left panels) and two \ptee intervals from the EMCal-triggered event analysis (right panels). The signal and background components obtained from the fit procedure are shown separately. For the top-right panel, the distributions are scaled for convenience by a factor of 2. | 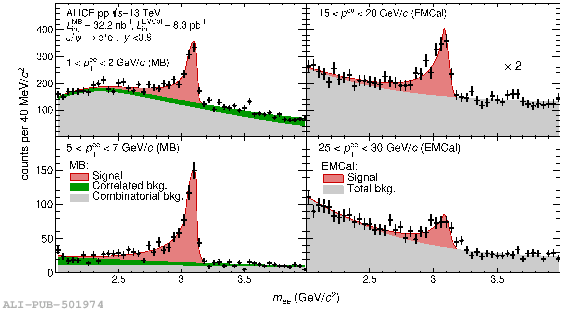 |