This article reports measurements of the angle between differently defined jet axes in pp collisions at $\sqrt{s} = 5.02$ TeV carried out by the ALICE Collaboration. Charged particles at midrapidity are clustered into jets with resolution parameters $R=0.2$ and 0.4. The jet axis, before and after Soft Drop grooming, is compared to the jet axis from the Winner-Takes-All (WTA) recombination scheme. The angle between these axes, $\Delta R_{\mathrm{axis}}$, probes a wide phase space of the jet formation and evolution, ranging from the initial high-momentum-transfer scattering to the hadronization process. The $\Delta R_{\mathrm{axis}}$ observable is presented for $20 <~ {p_{\mathrm{T}}^{\mathrm{ch\; jet}}}<~ 100$ GeV/$c$, and compared to predictions from the PYTHIA 8 and Herwig 7 event generators. The distributions can also be calculated analytically with a leading hadronization correction related to the non-perturbative component of the Collins$-$Soper$-$Sterman (CSS) evolution kernel. Comparisons to analytical predictions at next-to-leading-logarithmic accuracy with leading hadronization correction implemented from experimental extractions of the CSS kernel in Drell$-$Yan measurements are presented. The analytical predictions describe the measured data within 20% in the perturbative regime, with surprising agreement in the non-perturbative regime as well. These results are compatible with the universality of the CSS kernel in the context of jet substructure.
JHEP 07 (2023) 201
HEP Data
e-Print: arXiv:2211.08928 | PDF | inSPIRE
CERN-EP-2022-242
Figure group
Figure 1
Representation of different jet axes. The colored dashed lines represent particles comprising the jet in the initial sample constructed with the anti-$k_{\rm T}$ algorithm and $E$ recombination scheme. These define the ``Standard'' jet axis. The grooming procedure removes soft wide-angle radiation (represented by orange long-dashed lines), and the resulting axis (``Groomed (SD)'') is defined by the remaining particles (red dashed and blue dotted lines). Finally, the ``WTA'' axis, which is determined with all the particles in the initial (ungroomed) jet, tends to be aligned with the most-energetic particle in the jet. The $\Delta R_{\rm axis}$ observable is determined from the angle between any pair of these axes. |  |
Figure 2
Comparison between the $\Delta R_{\rm axis}$ Standard$-$SD measured distributions and Monte Carlo event generators for jets of $R=0.4$ (top) and 0.2 (bottom) in $40< p_{\rm T}^{\rm ch\,jet} <60$ GeV/$c$. Left: distributions with $z_{\rm cut}=0.1$ and varying $\beta$. Right: distributions with $\beta=1$ and varying $z_{\rm cut}$. | 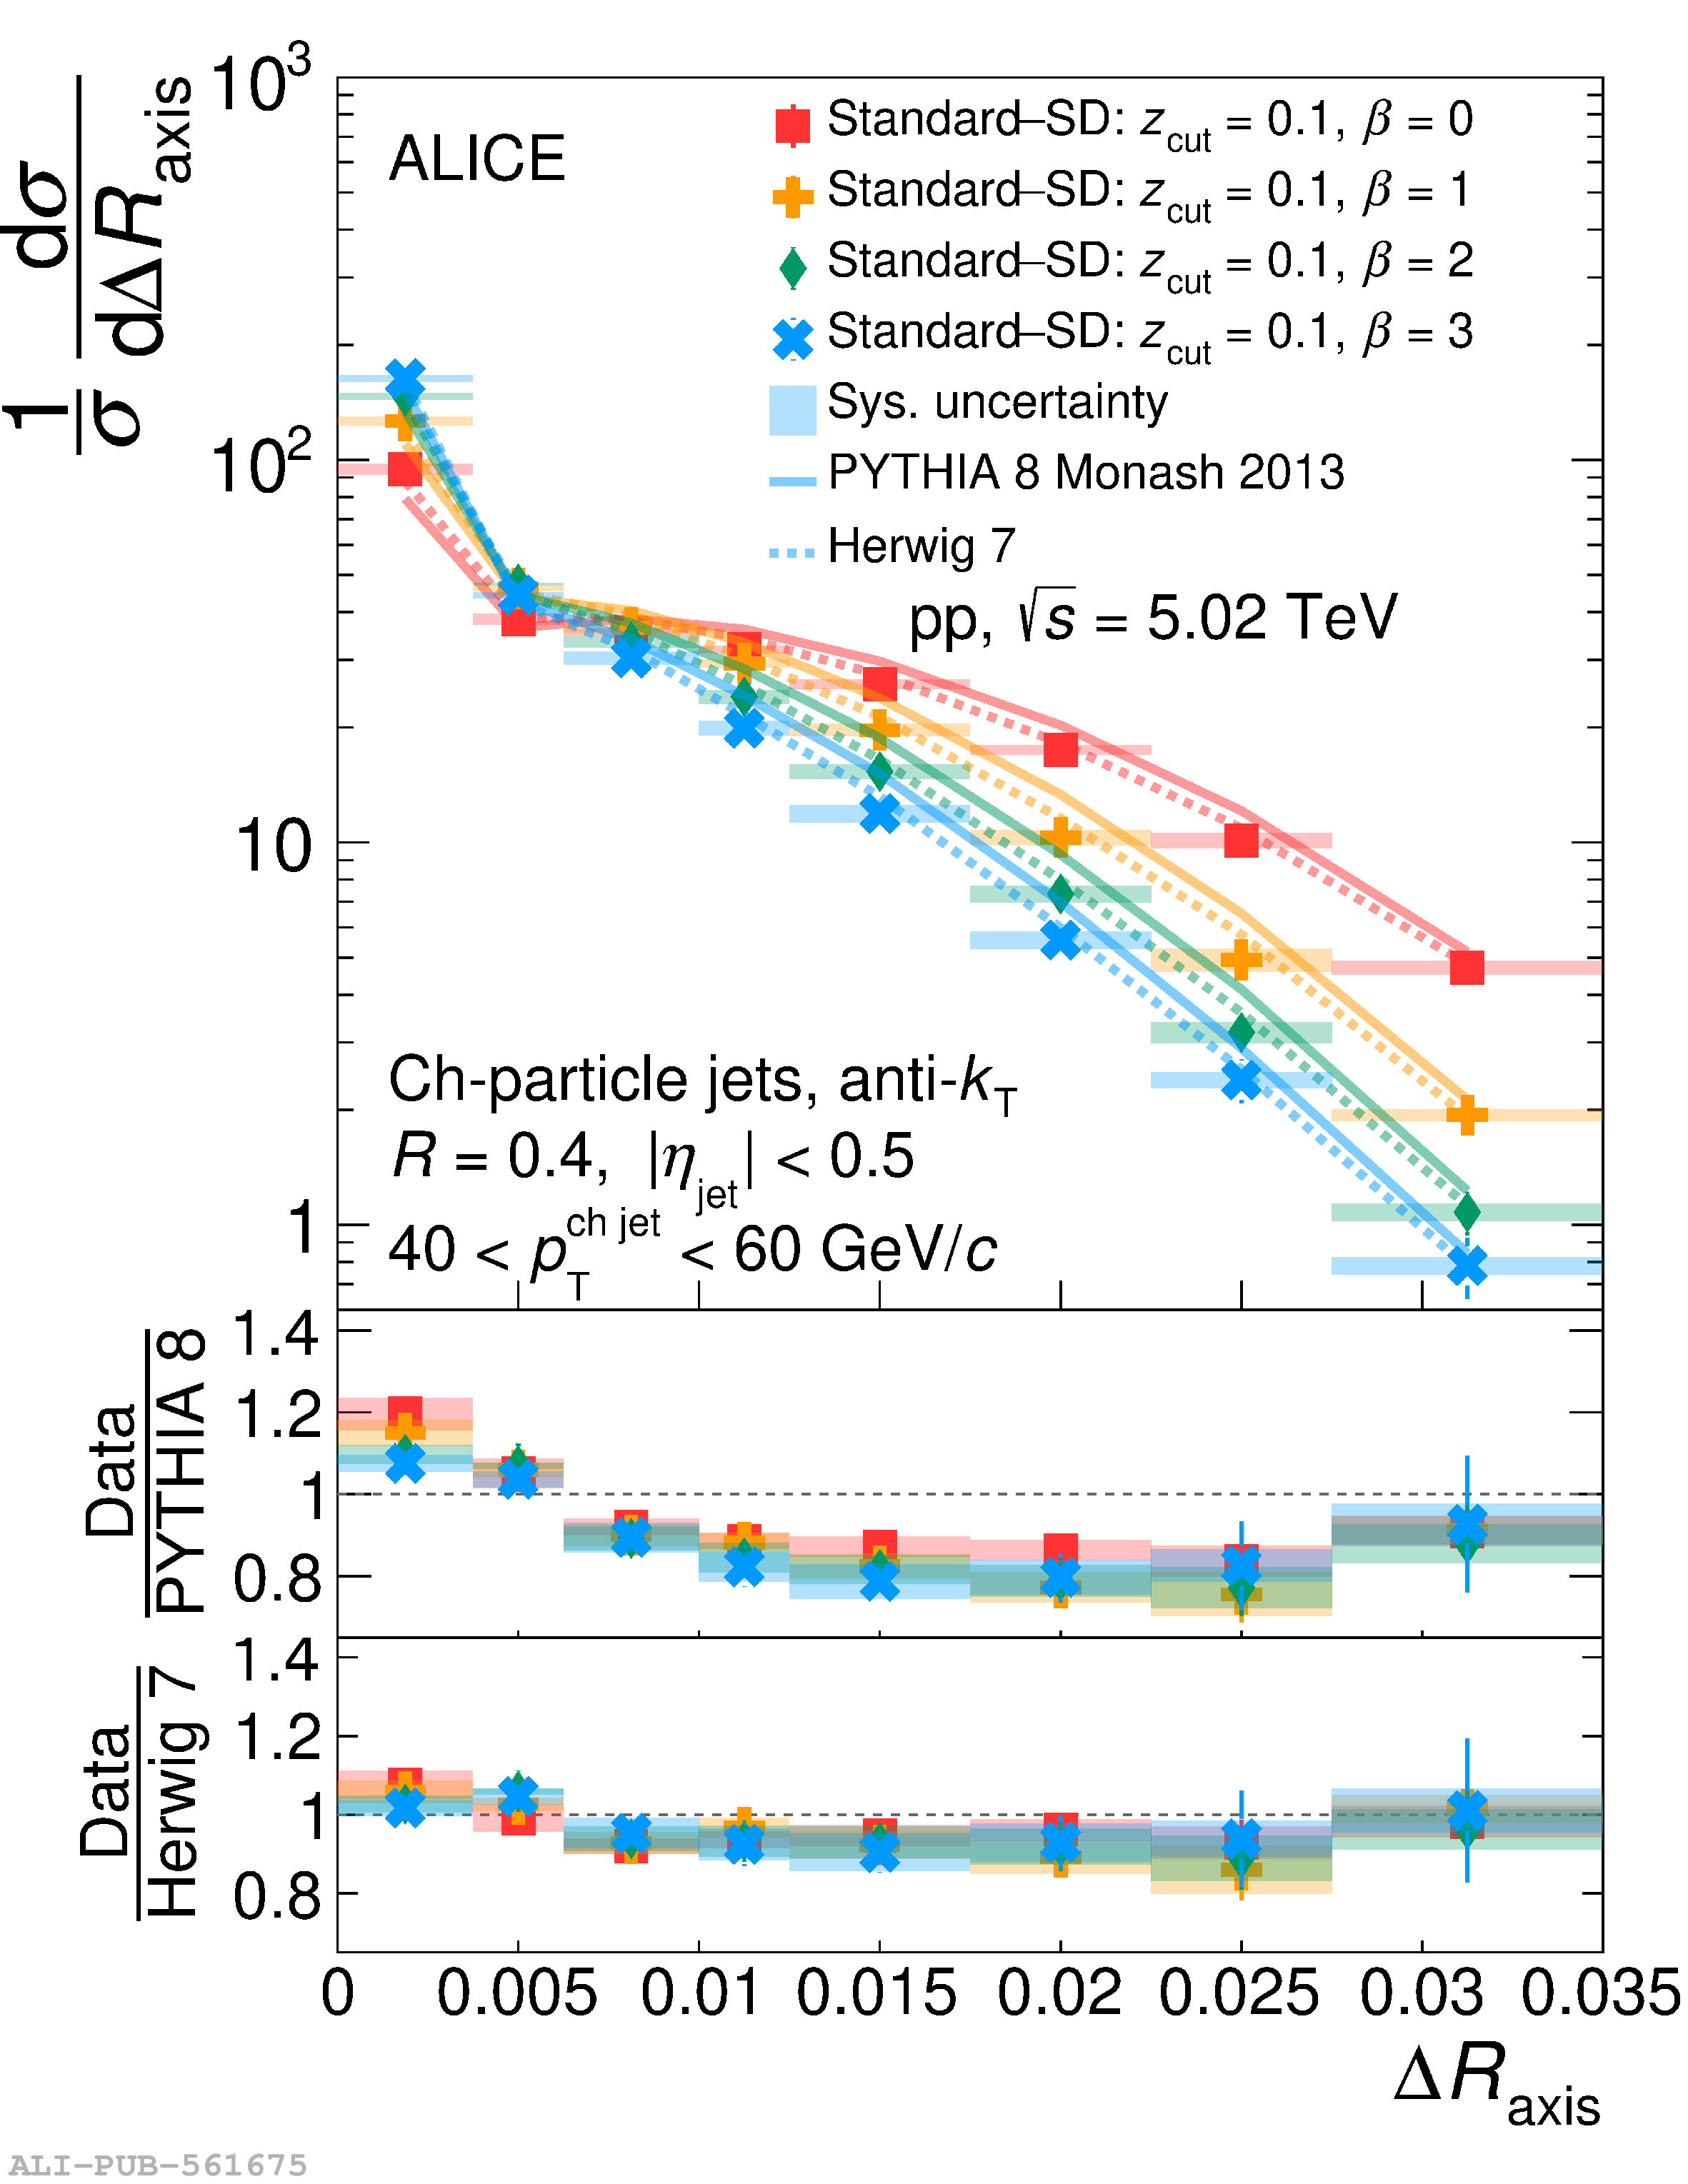 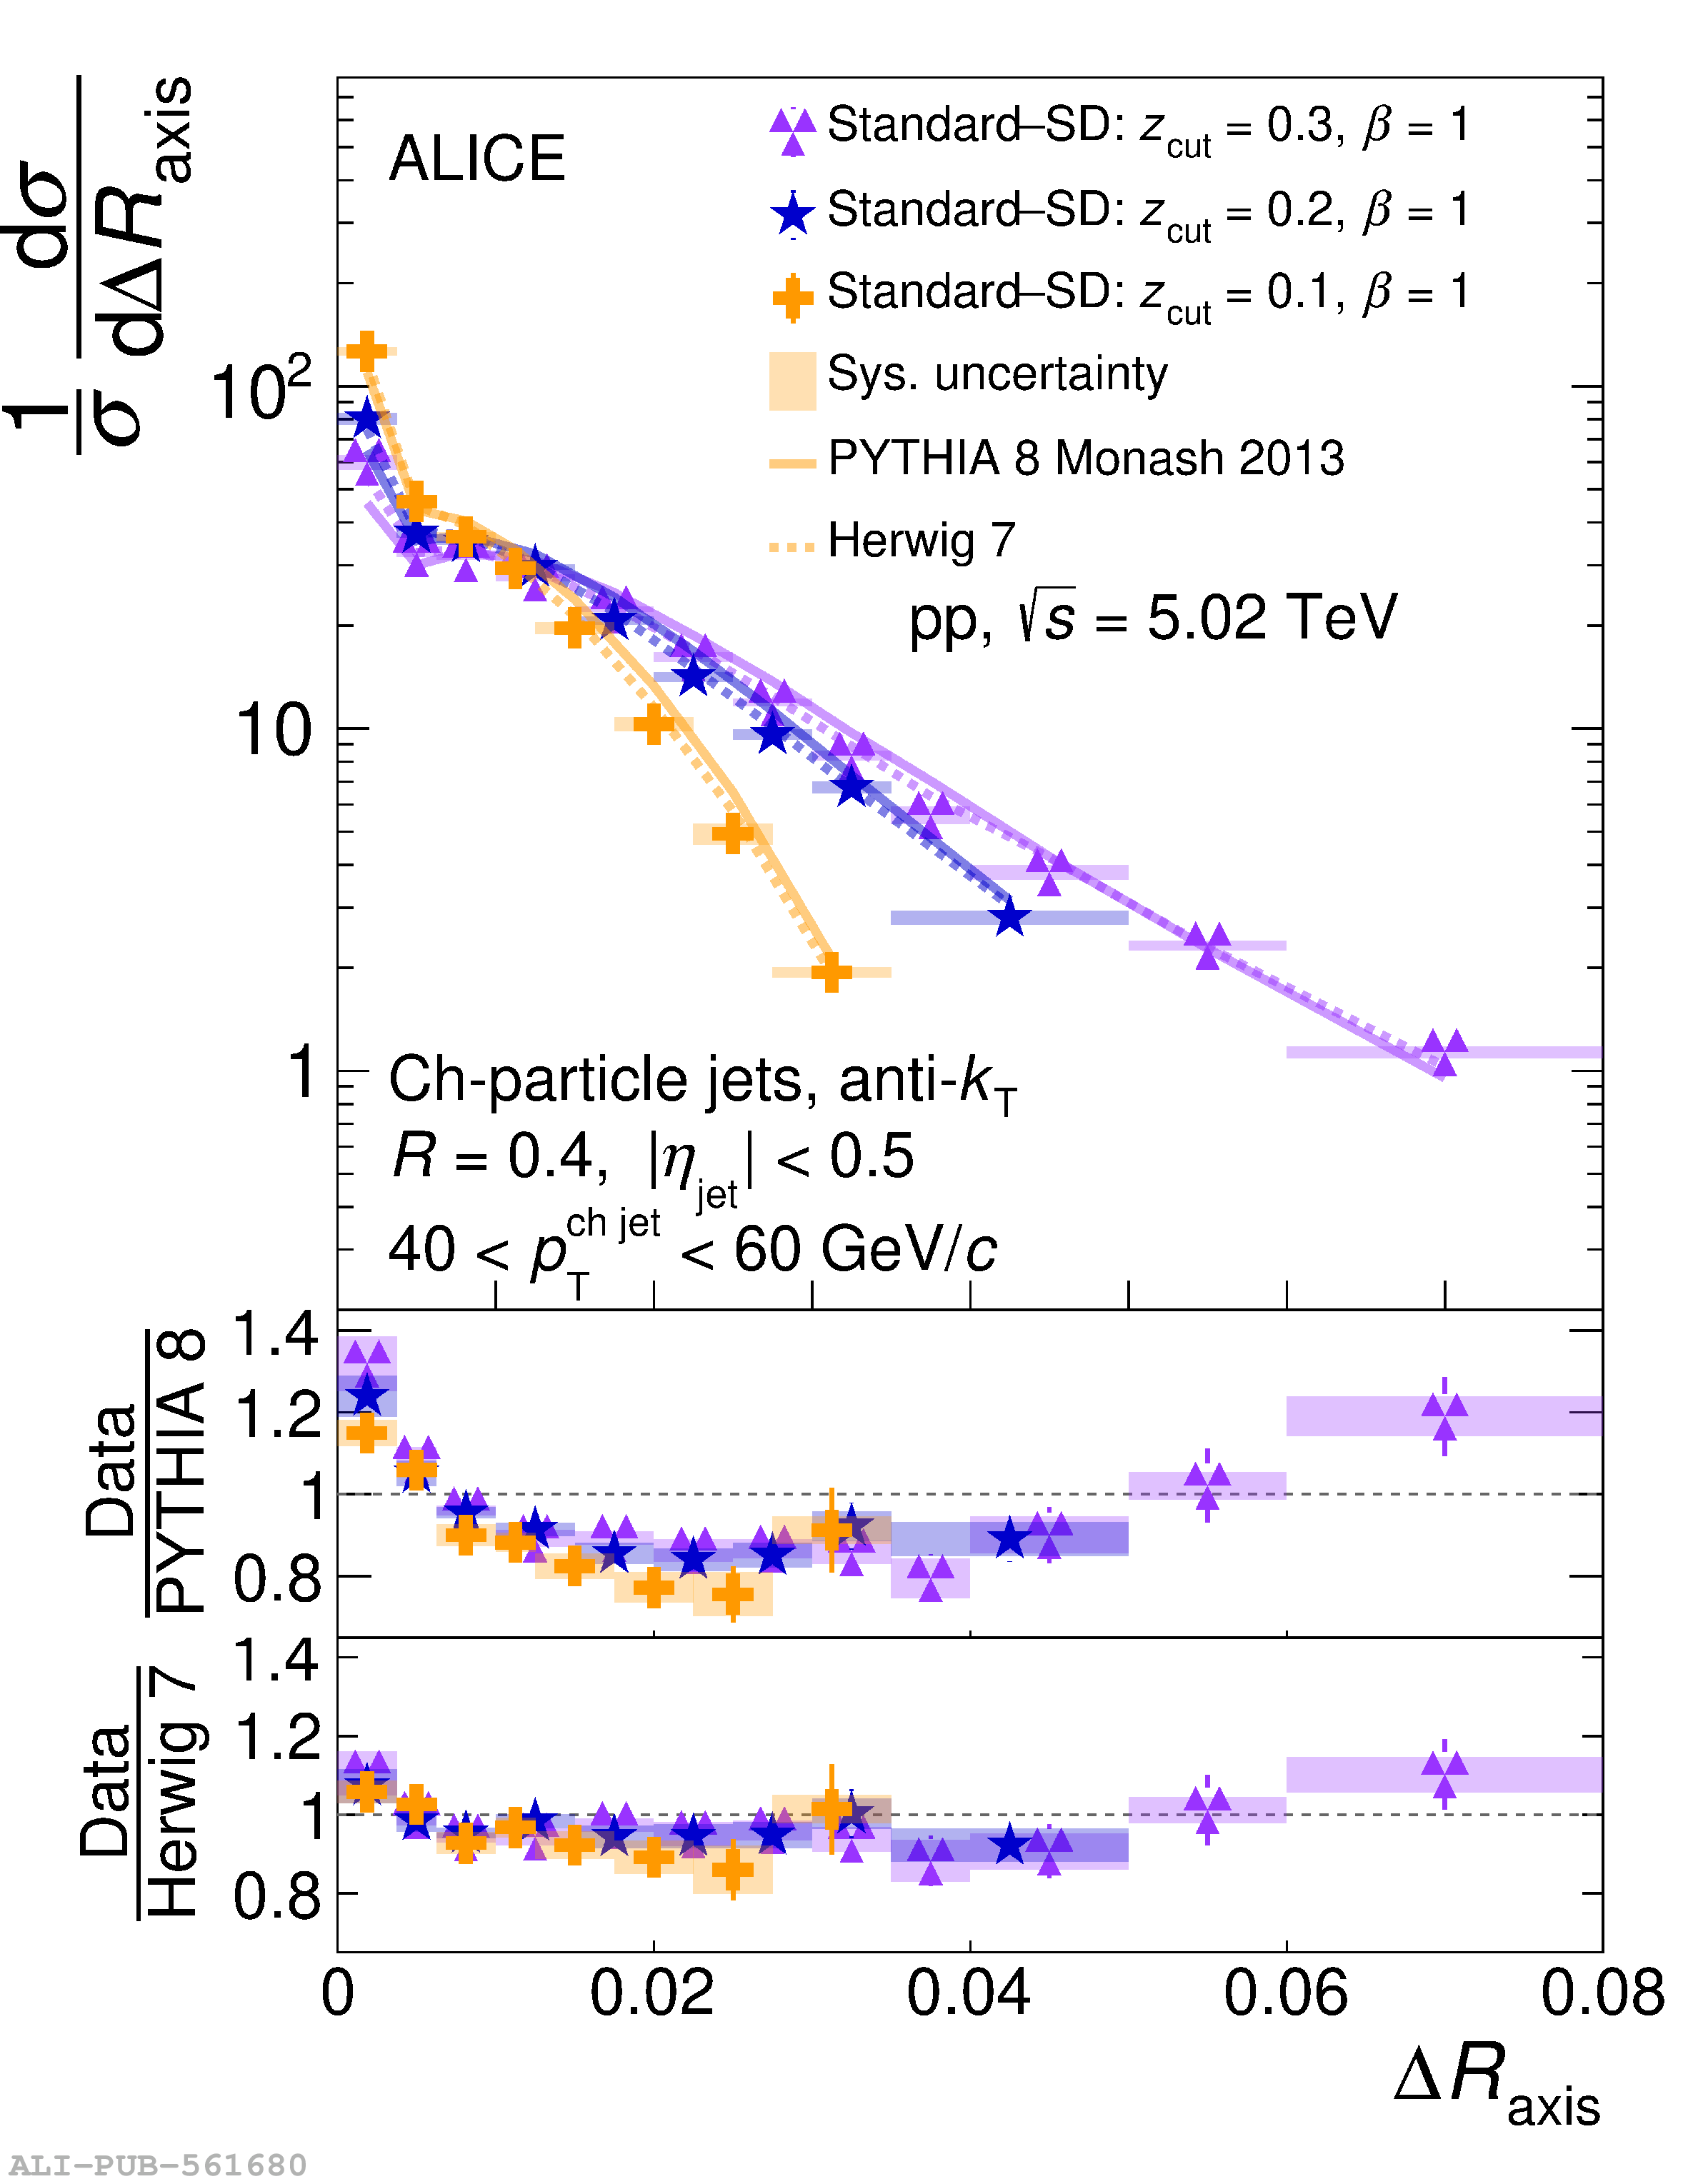 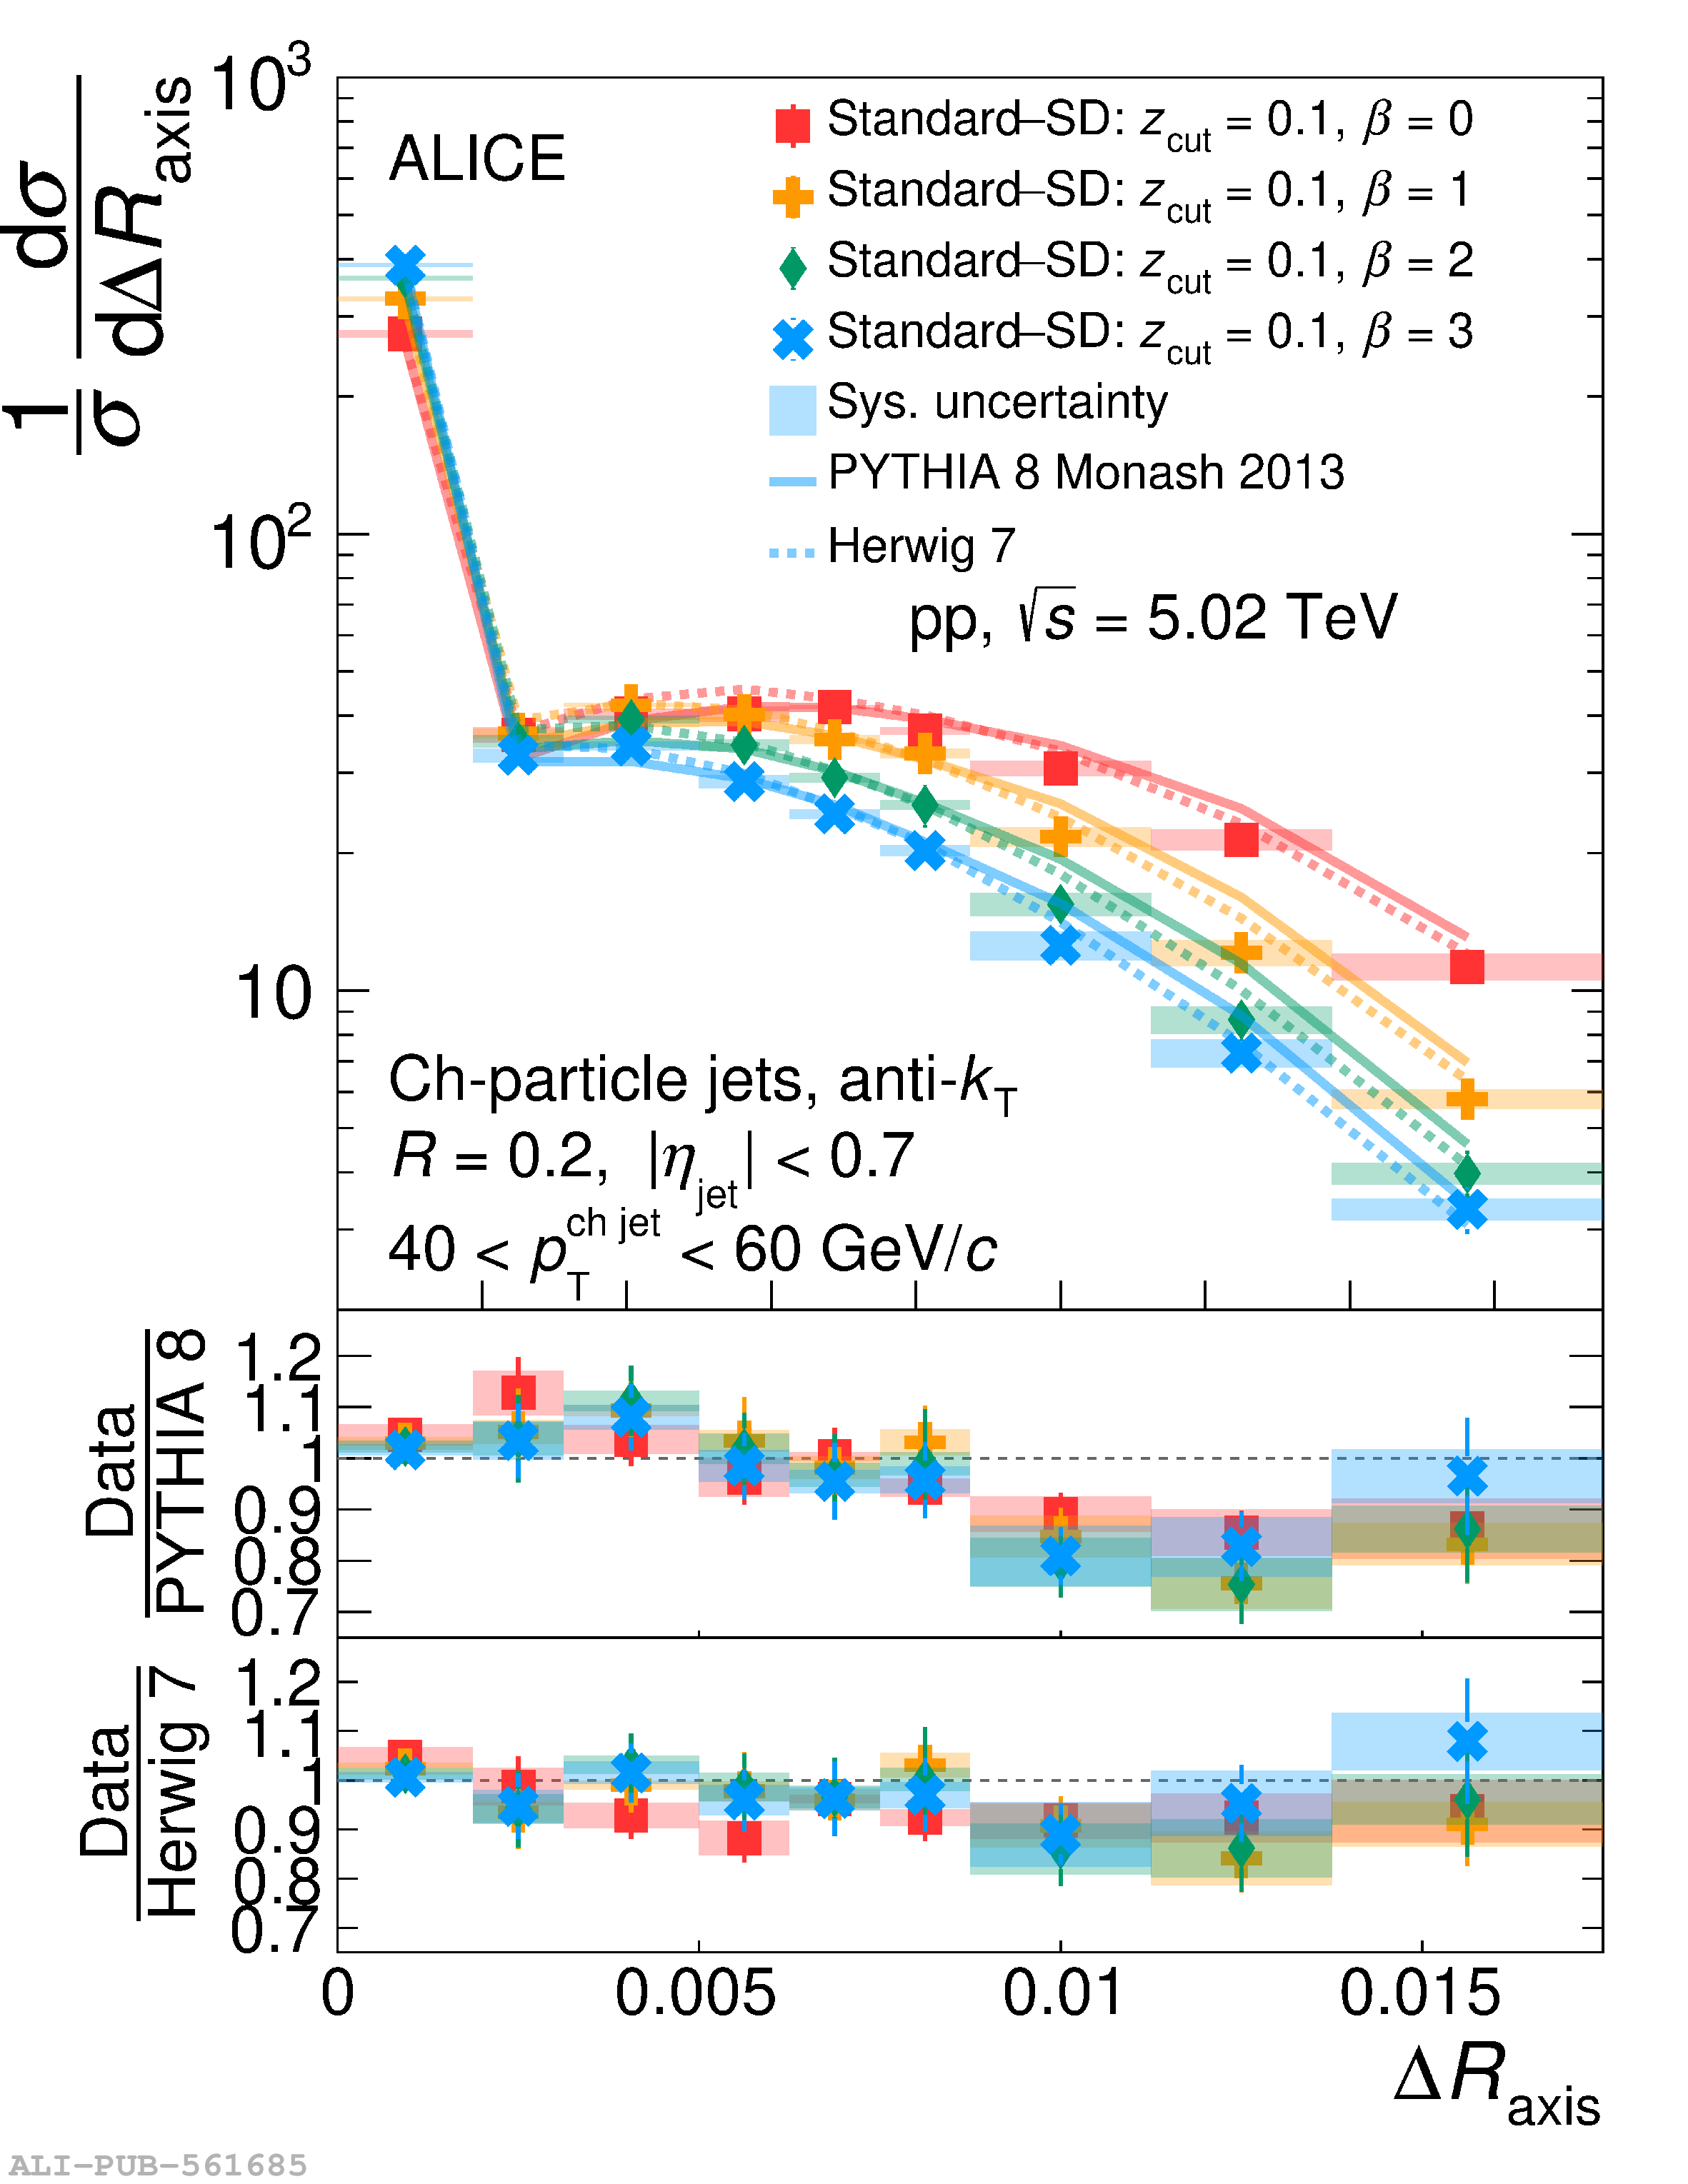  |
Figure 3
Comparison between the $\Delta R_{\rm axis}$ WTA$-$Standard and WTA$-$SD measured distributions and Monte Carlo event generators for jets of $R=0.4$ (top) and 0.2 (bottom) in $40< p_{\rm T}^{\rm ch\,jet} <60$ GeV/$c$. Left: distributions with $z_{\rm cut}=0.1$ and varying $\beta$. Right: distributions with $\beta=1$ and varying $z_{\rm cut}$. | 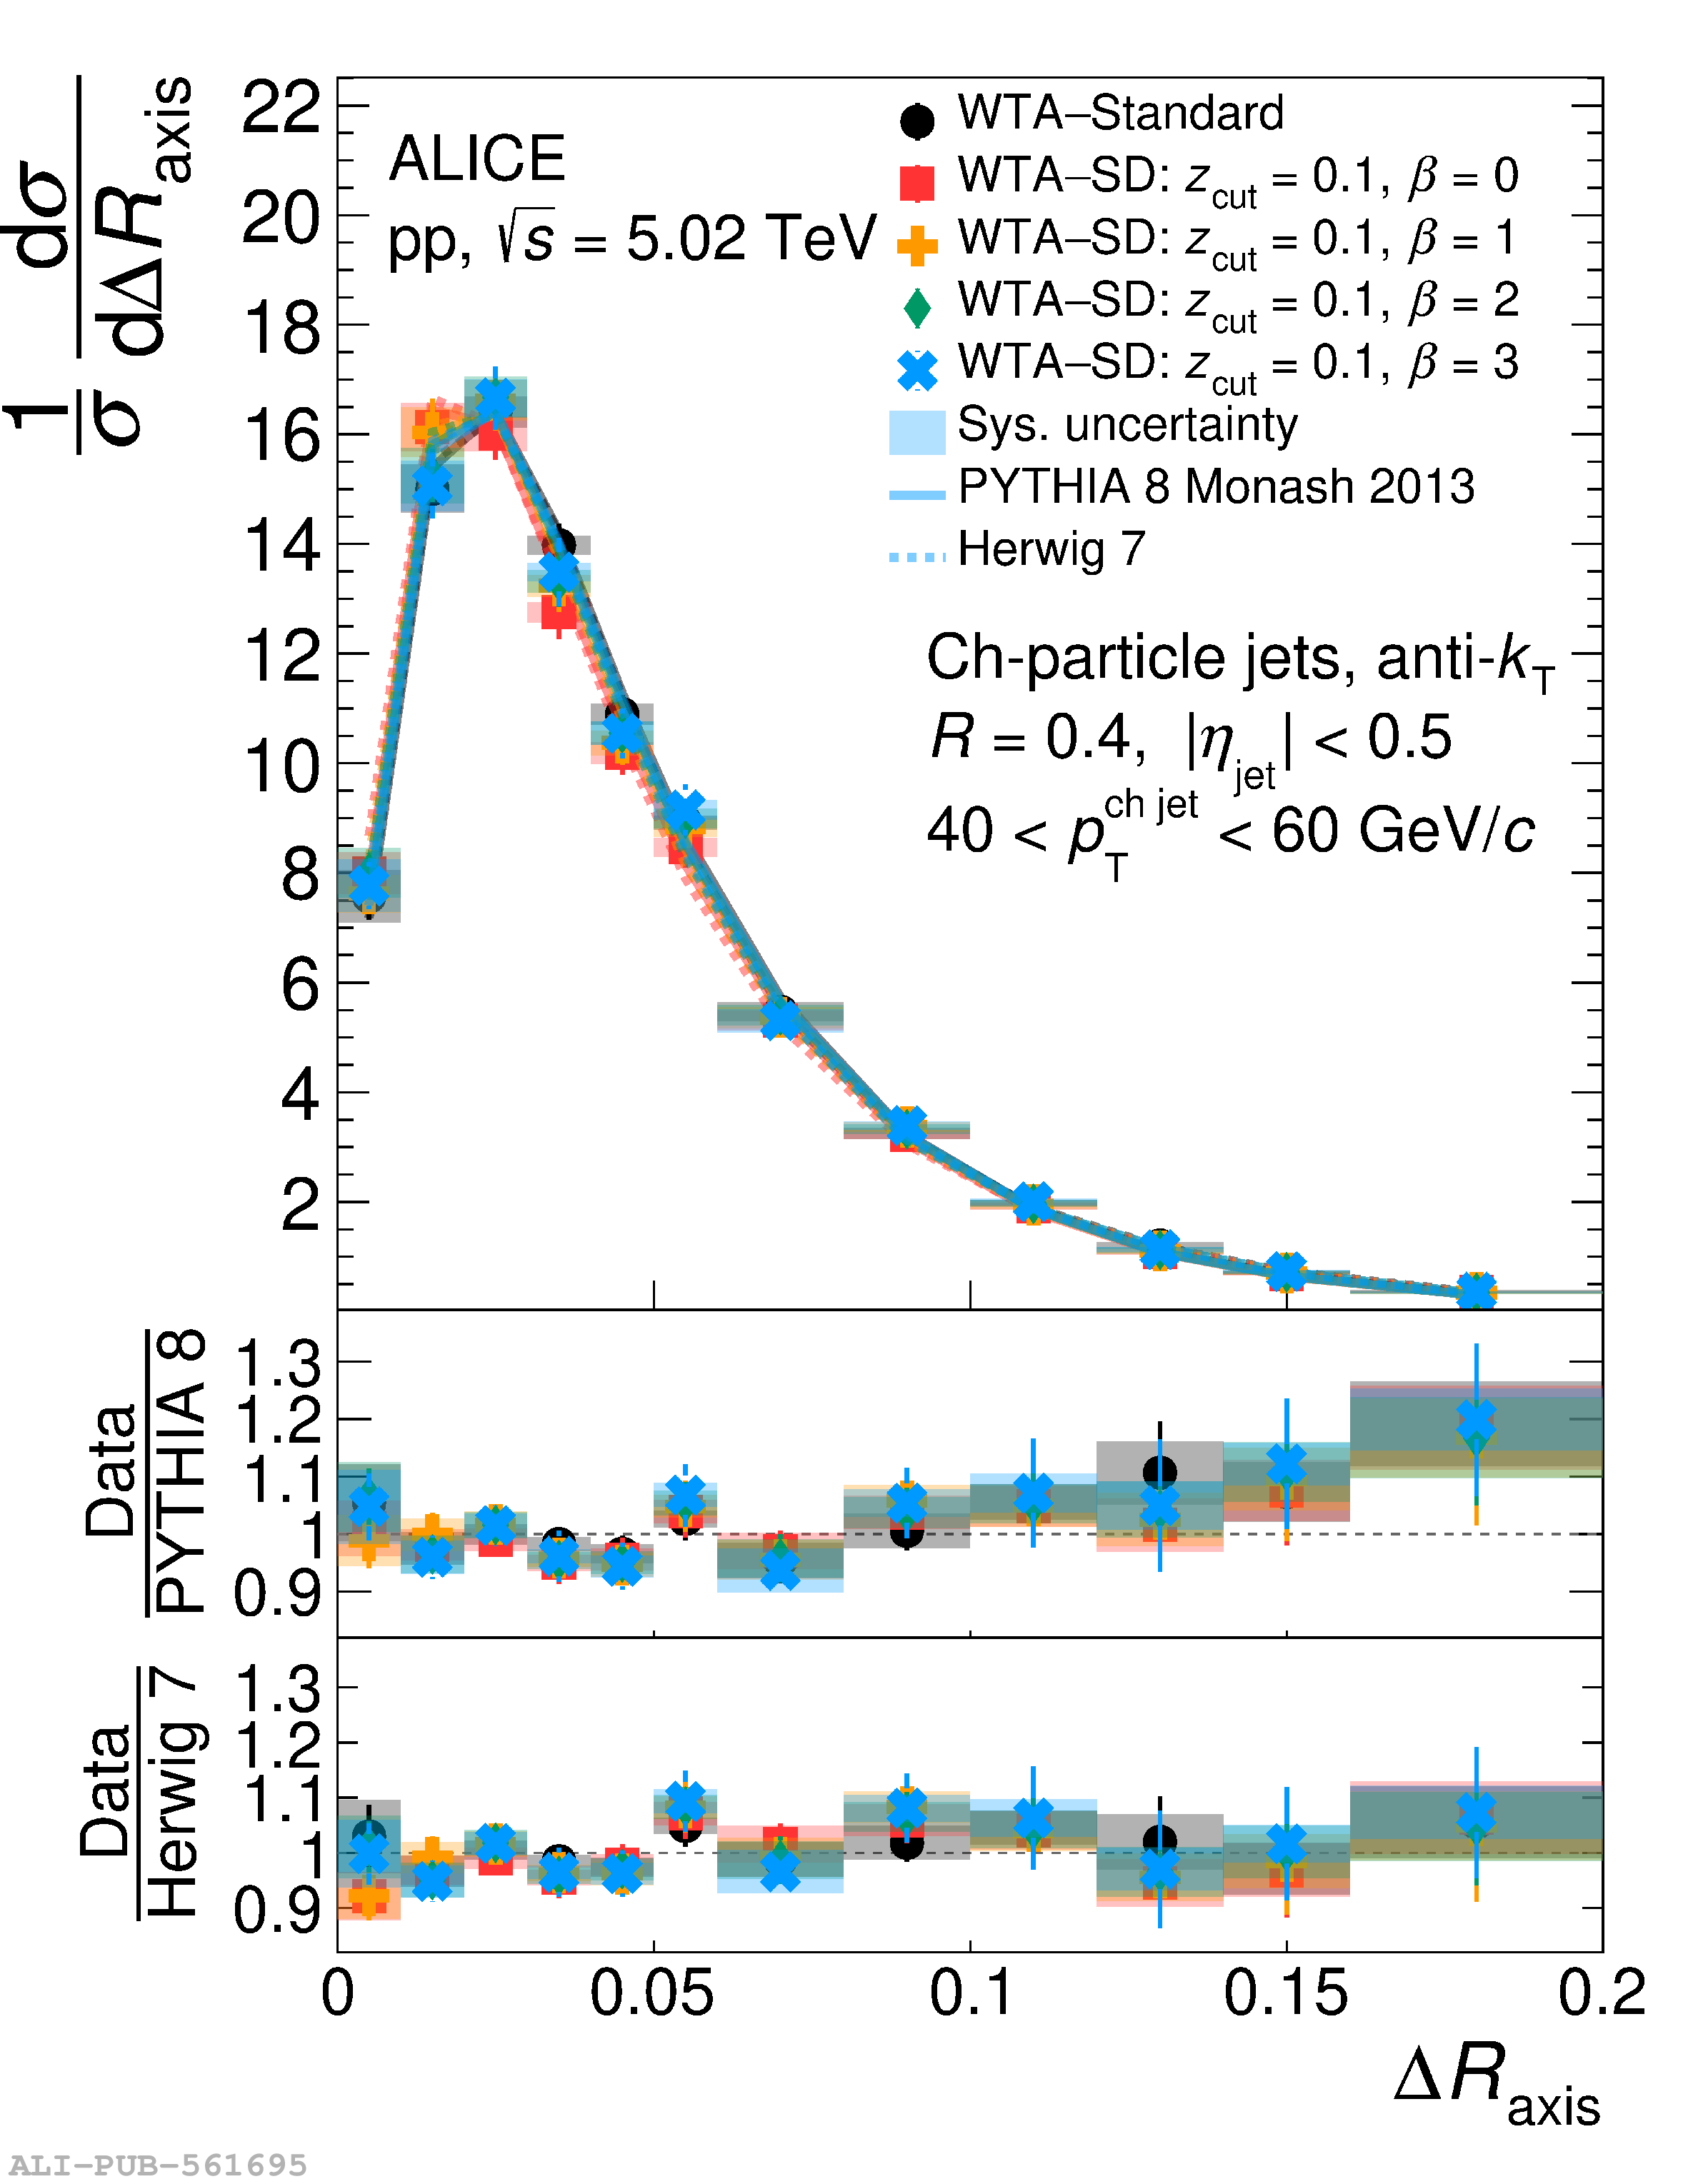 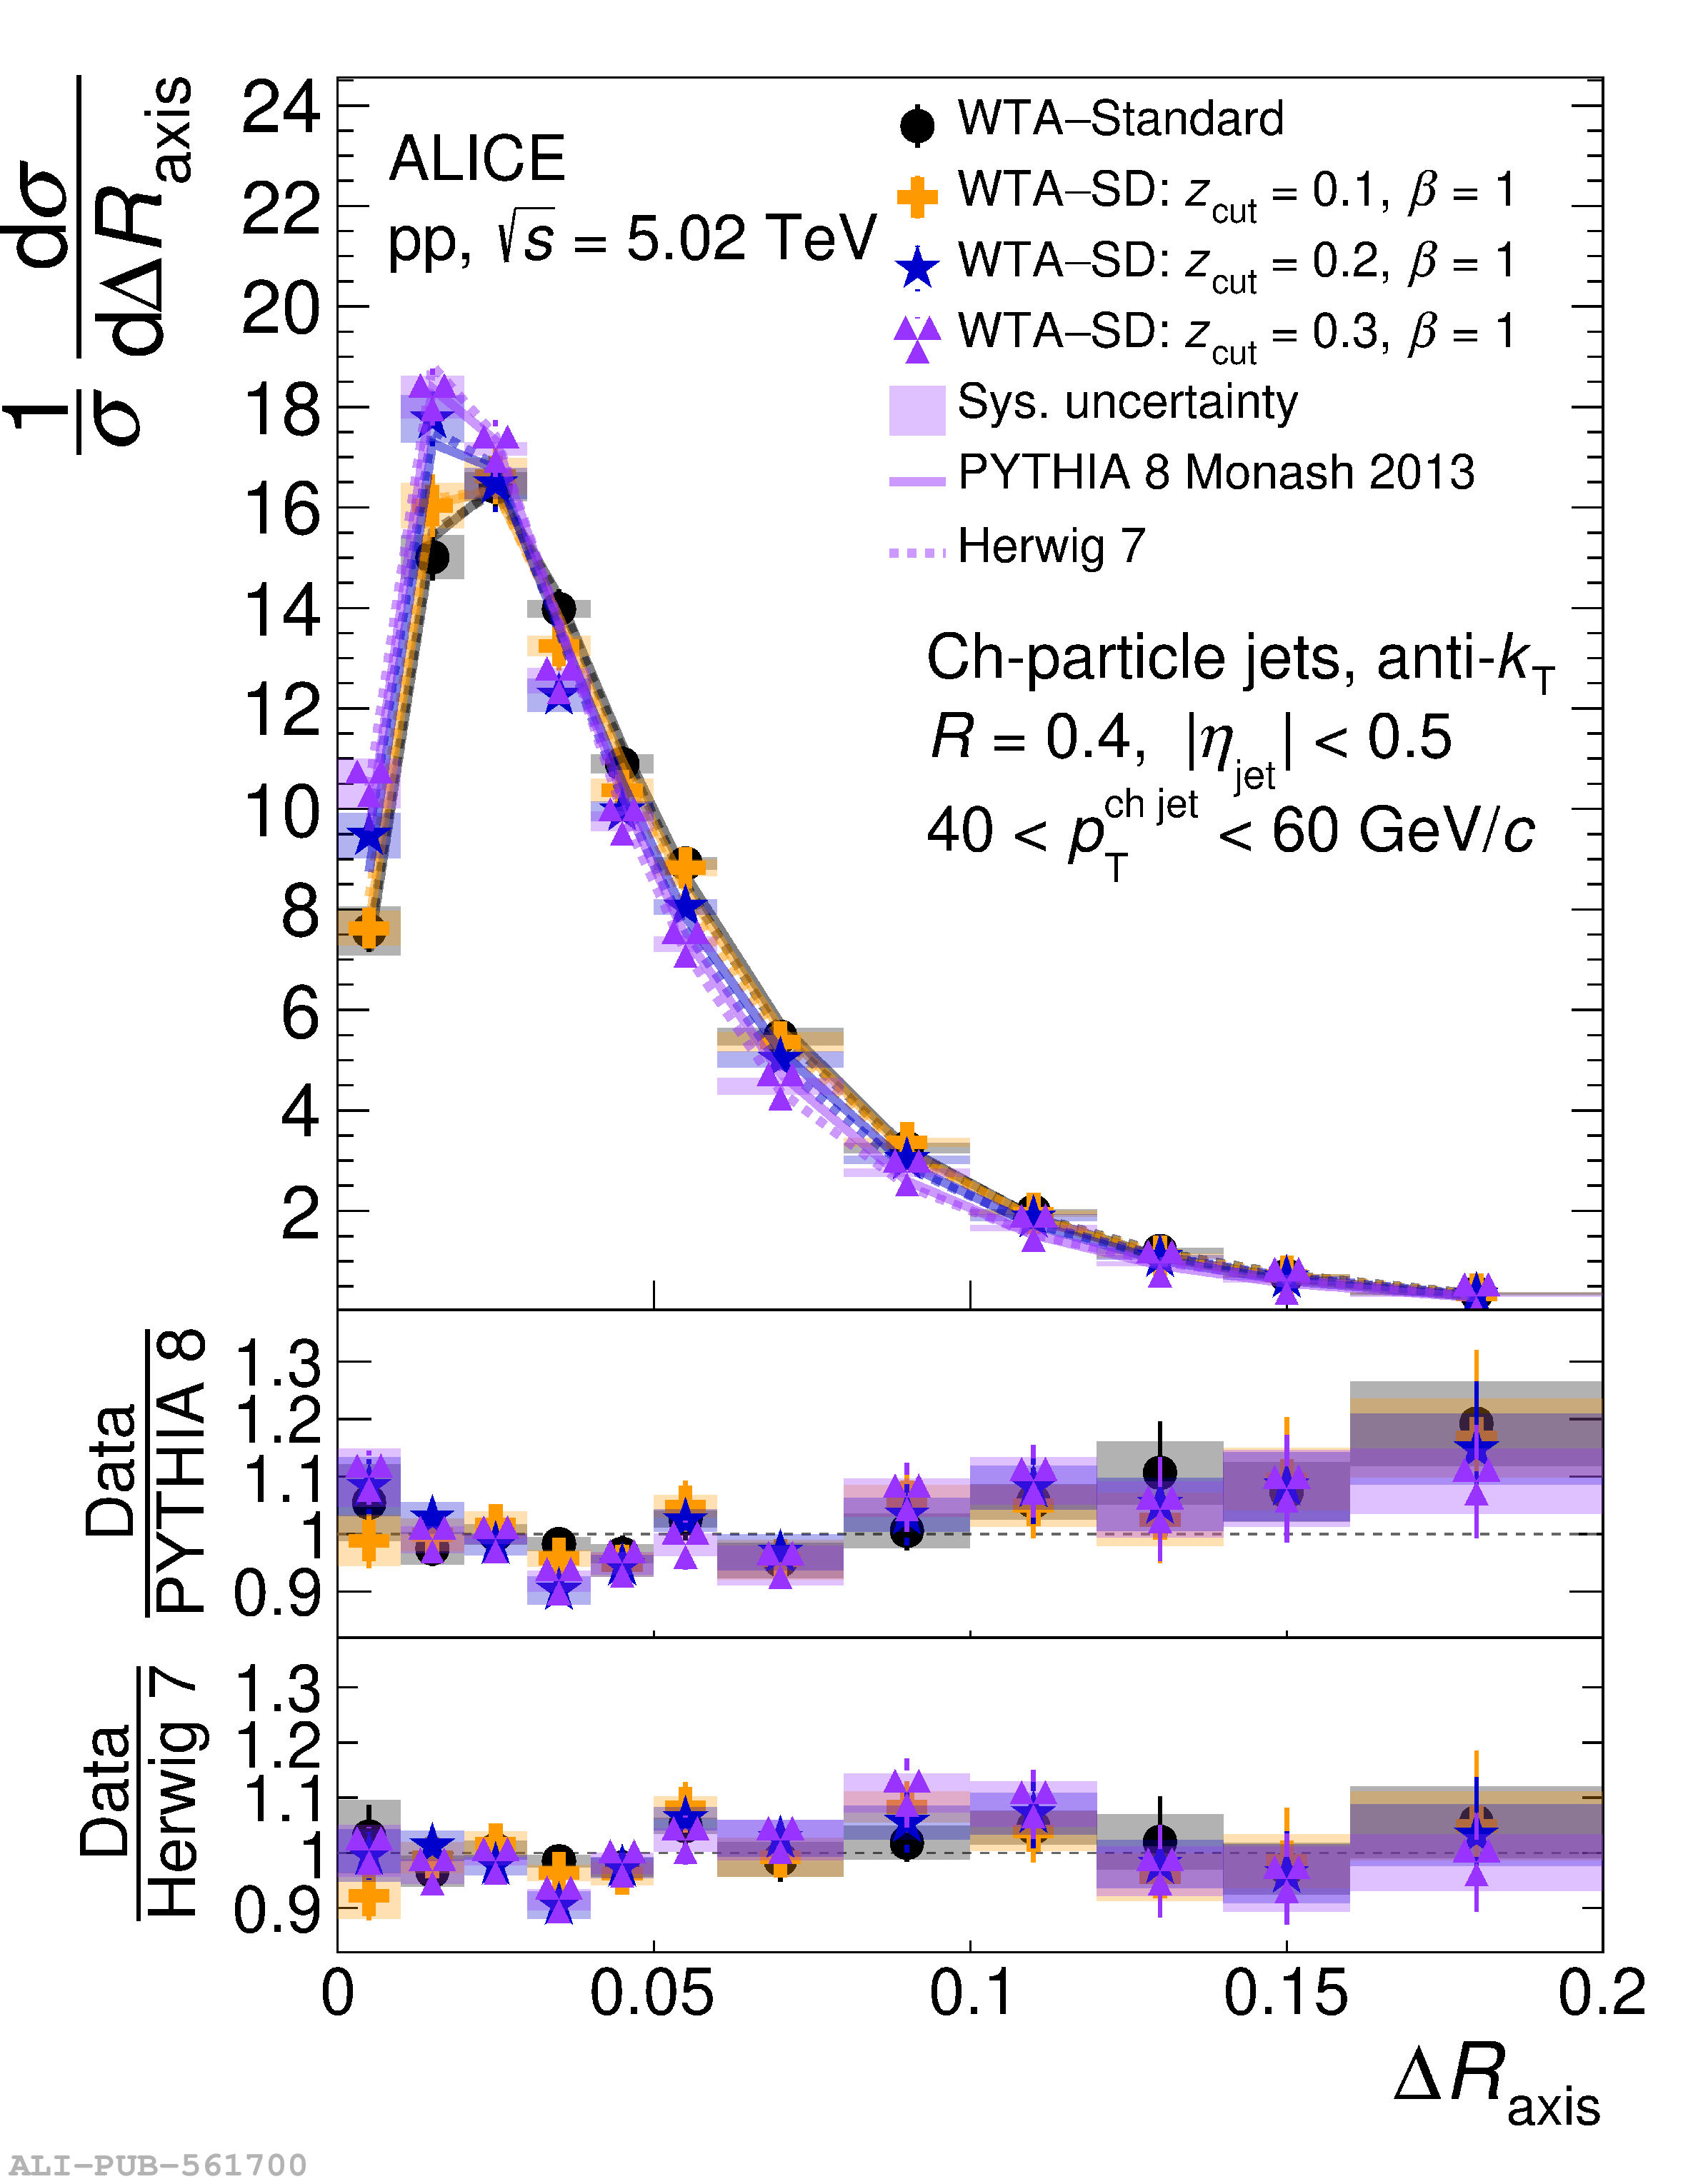   |
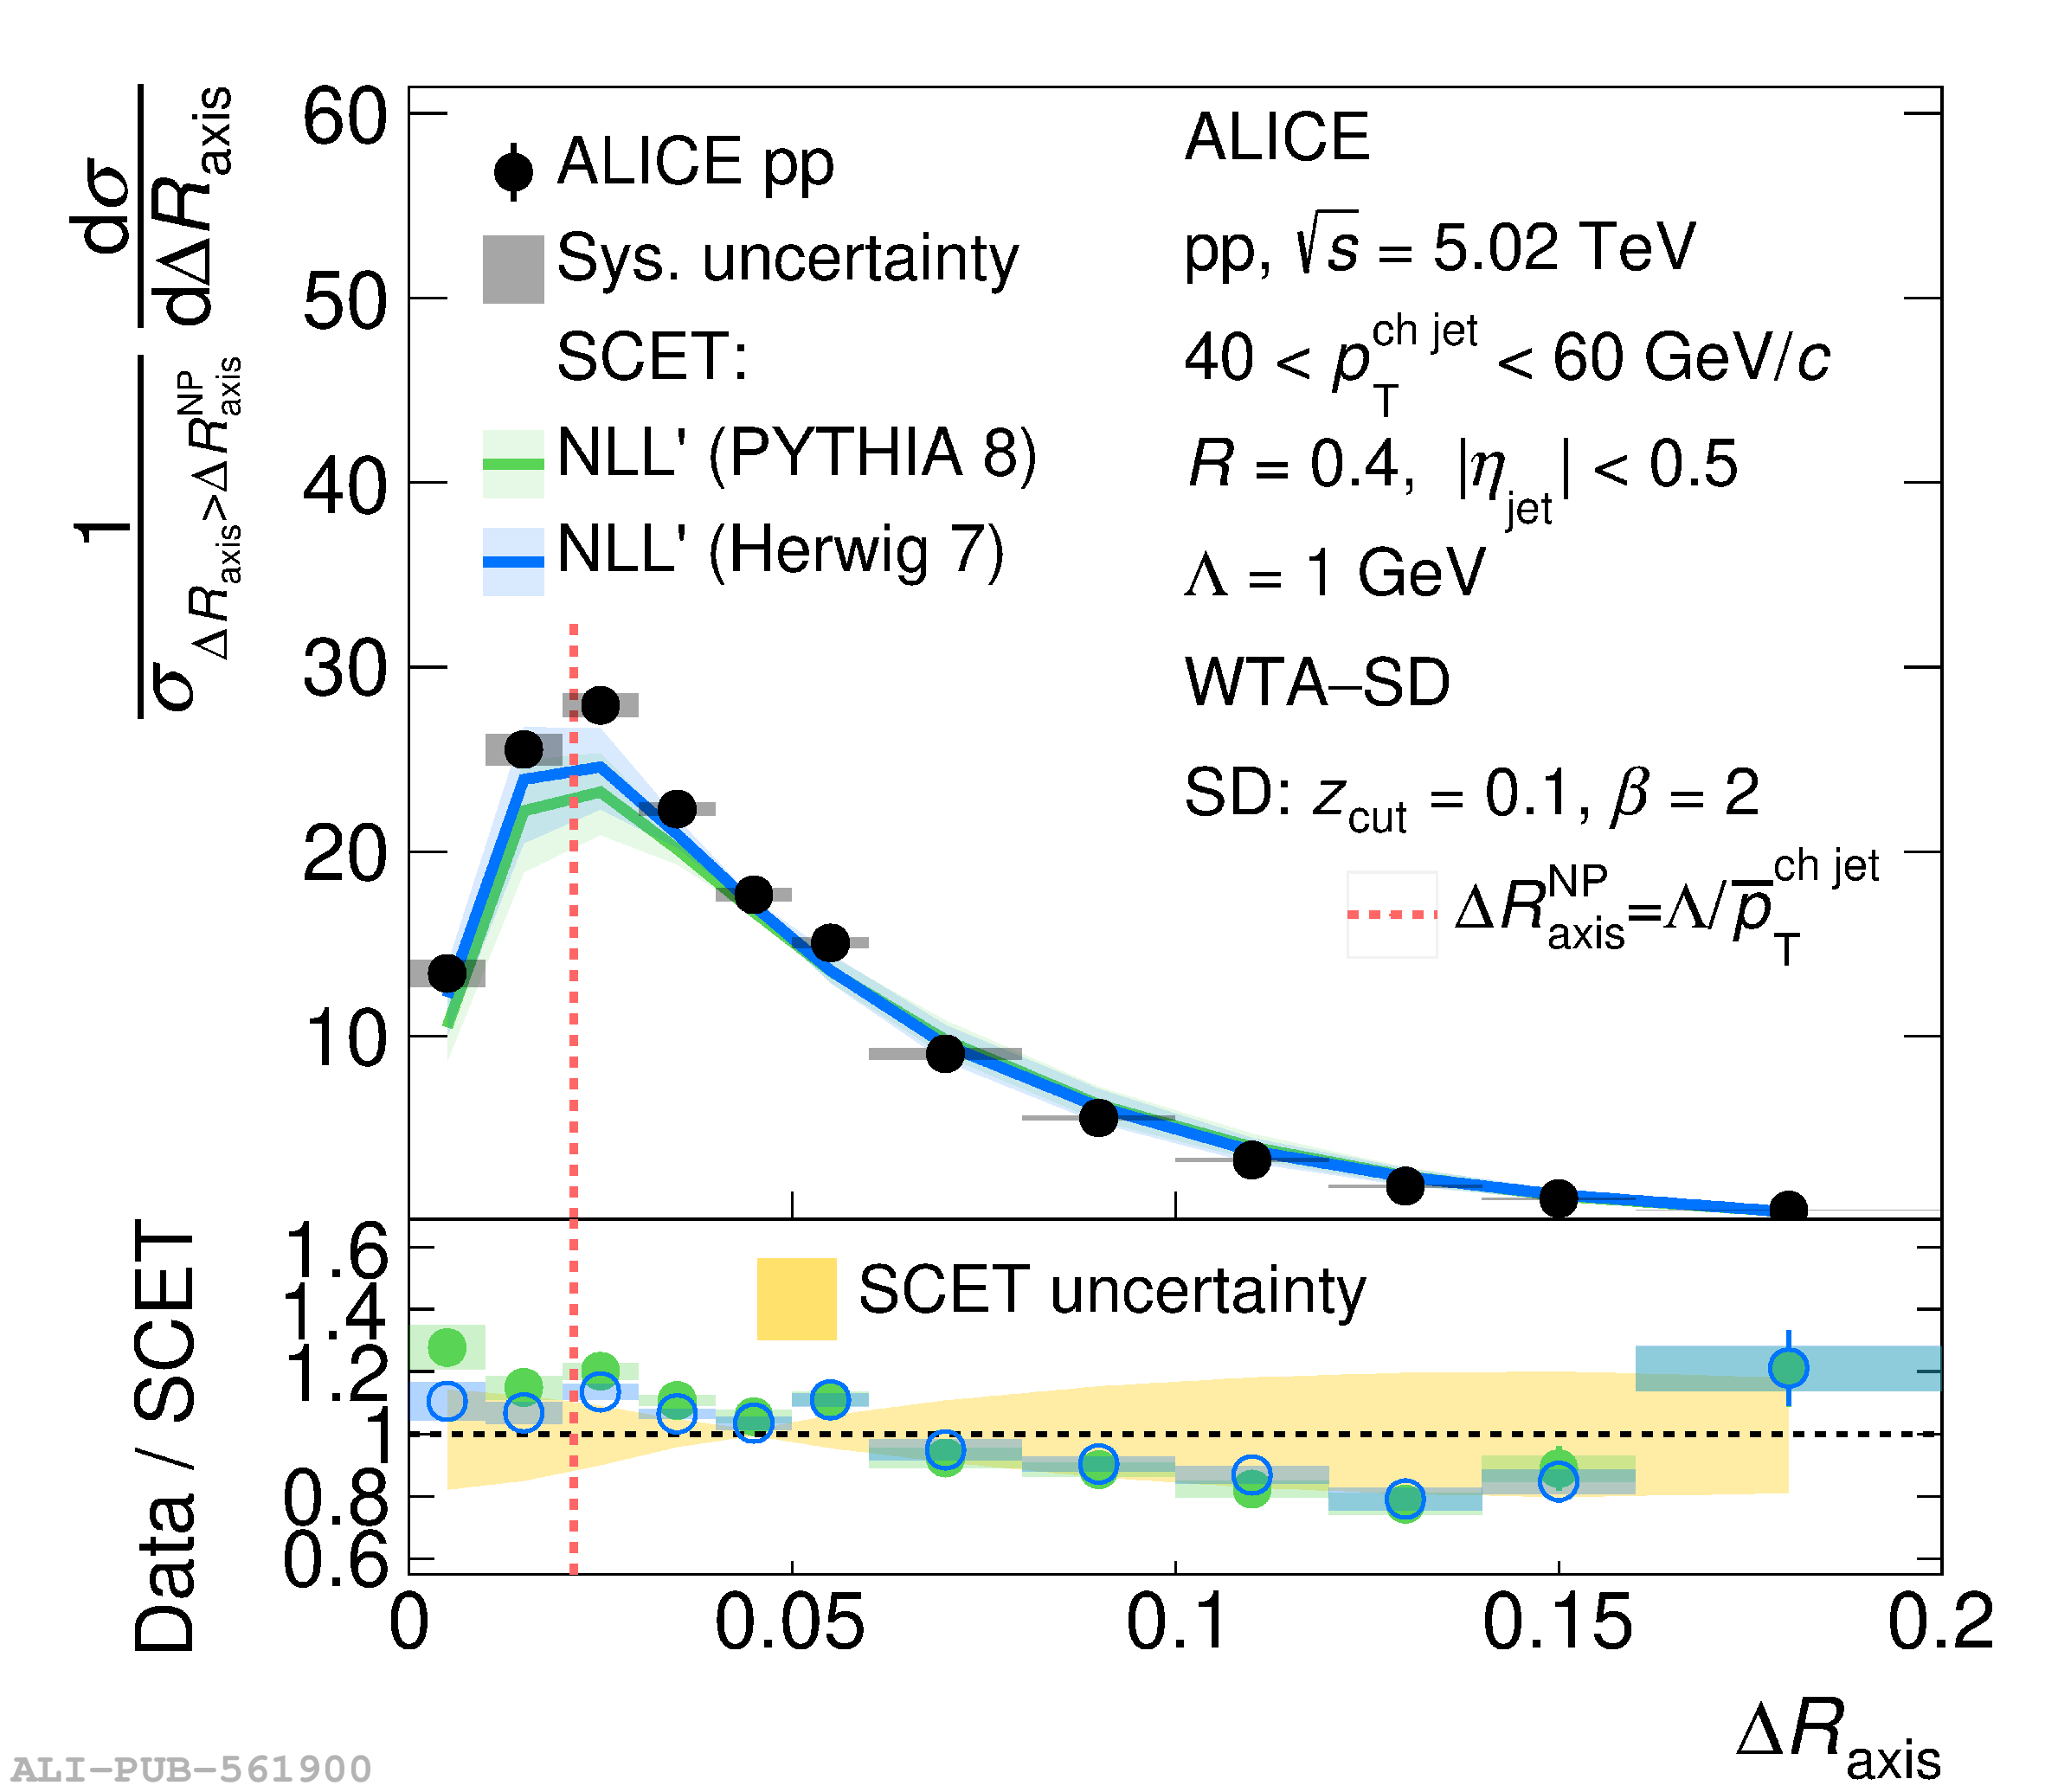
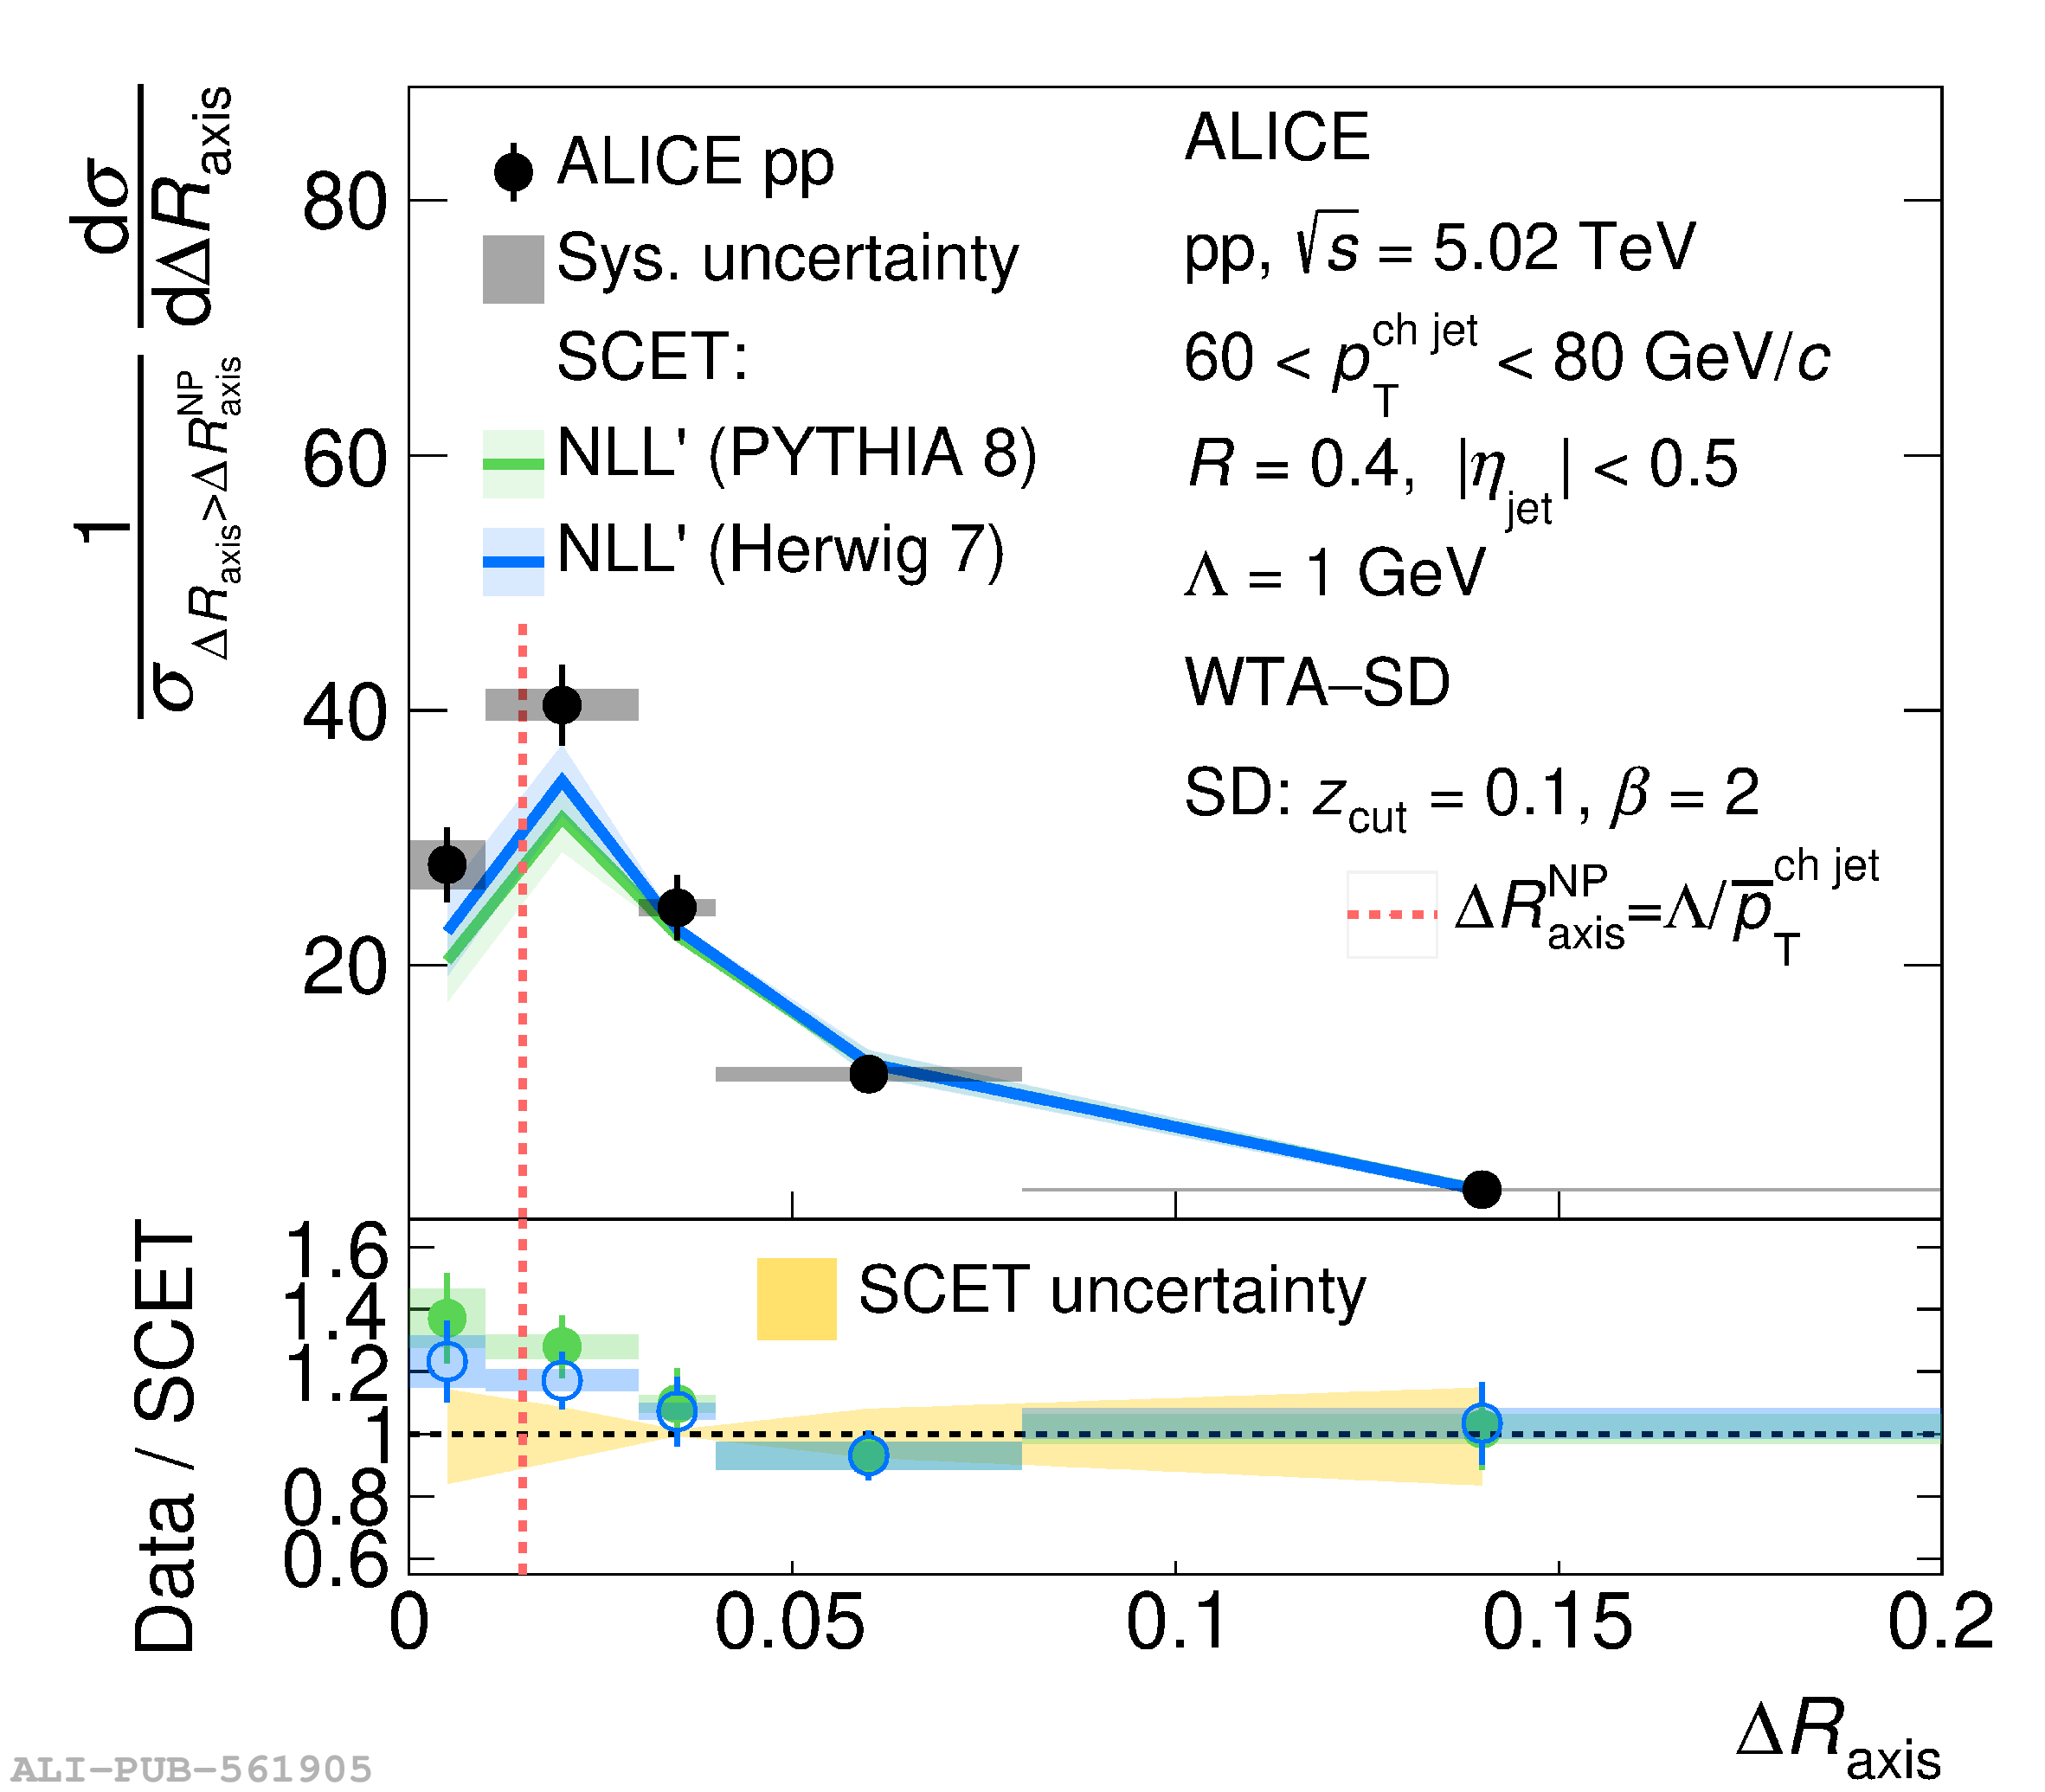
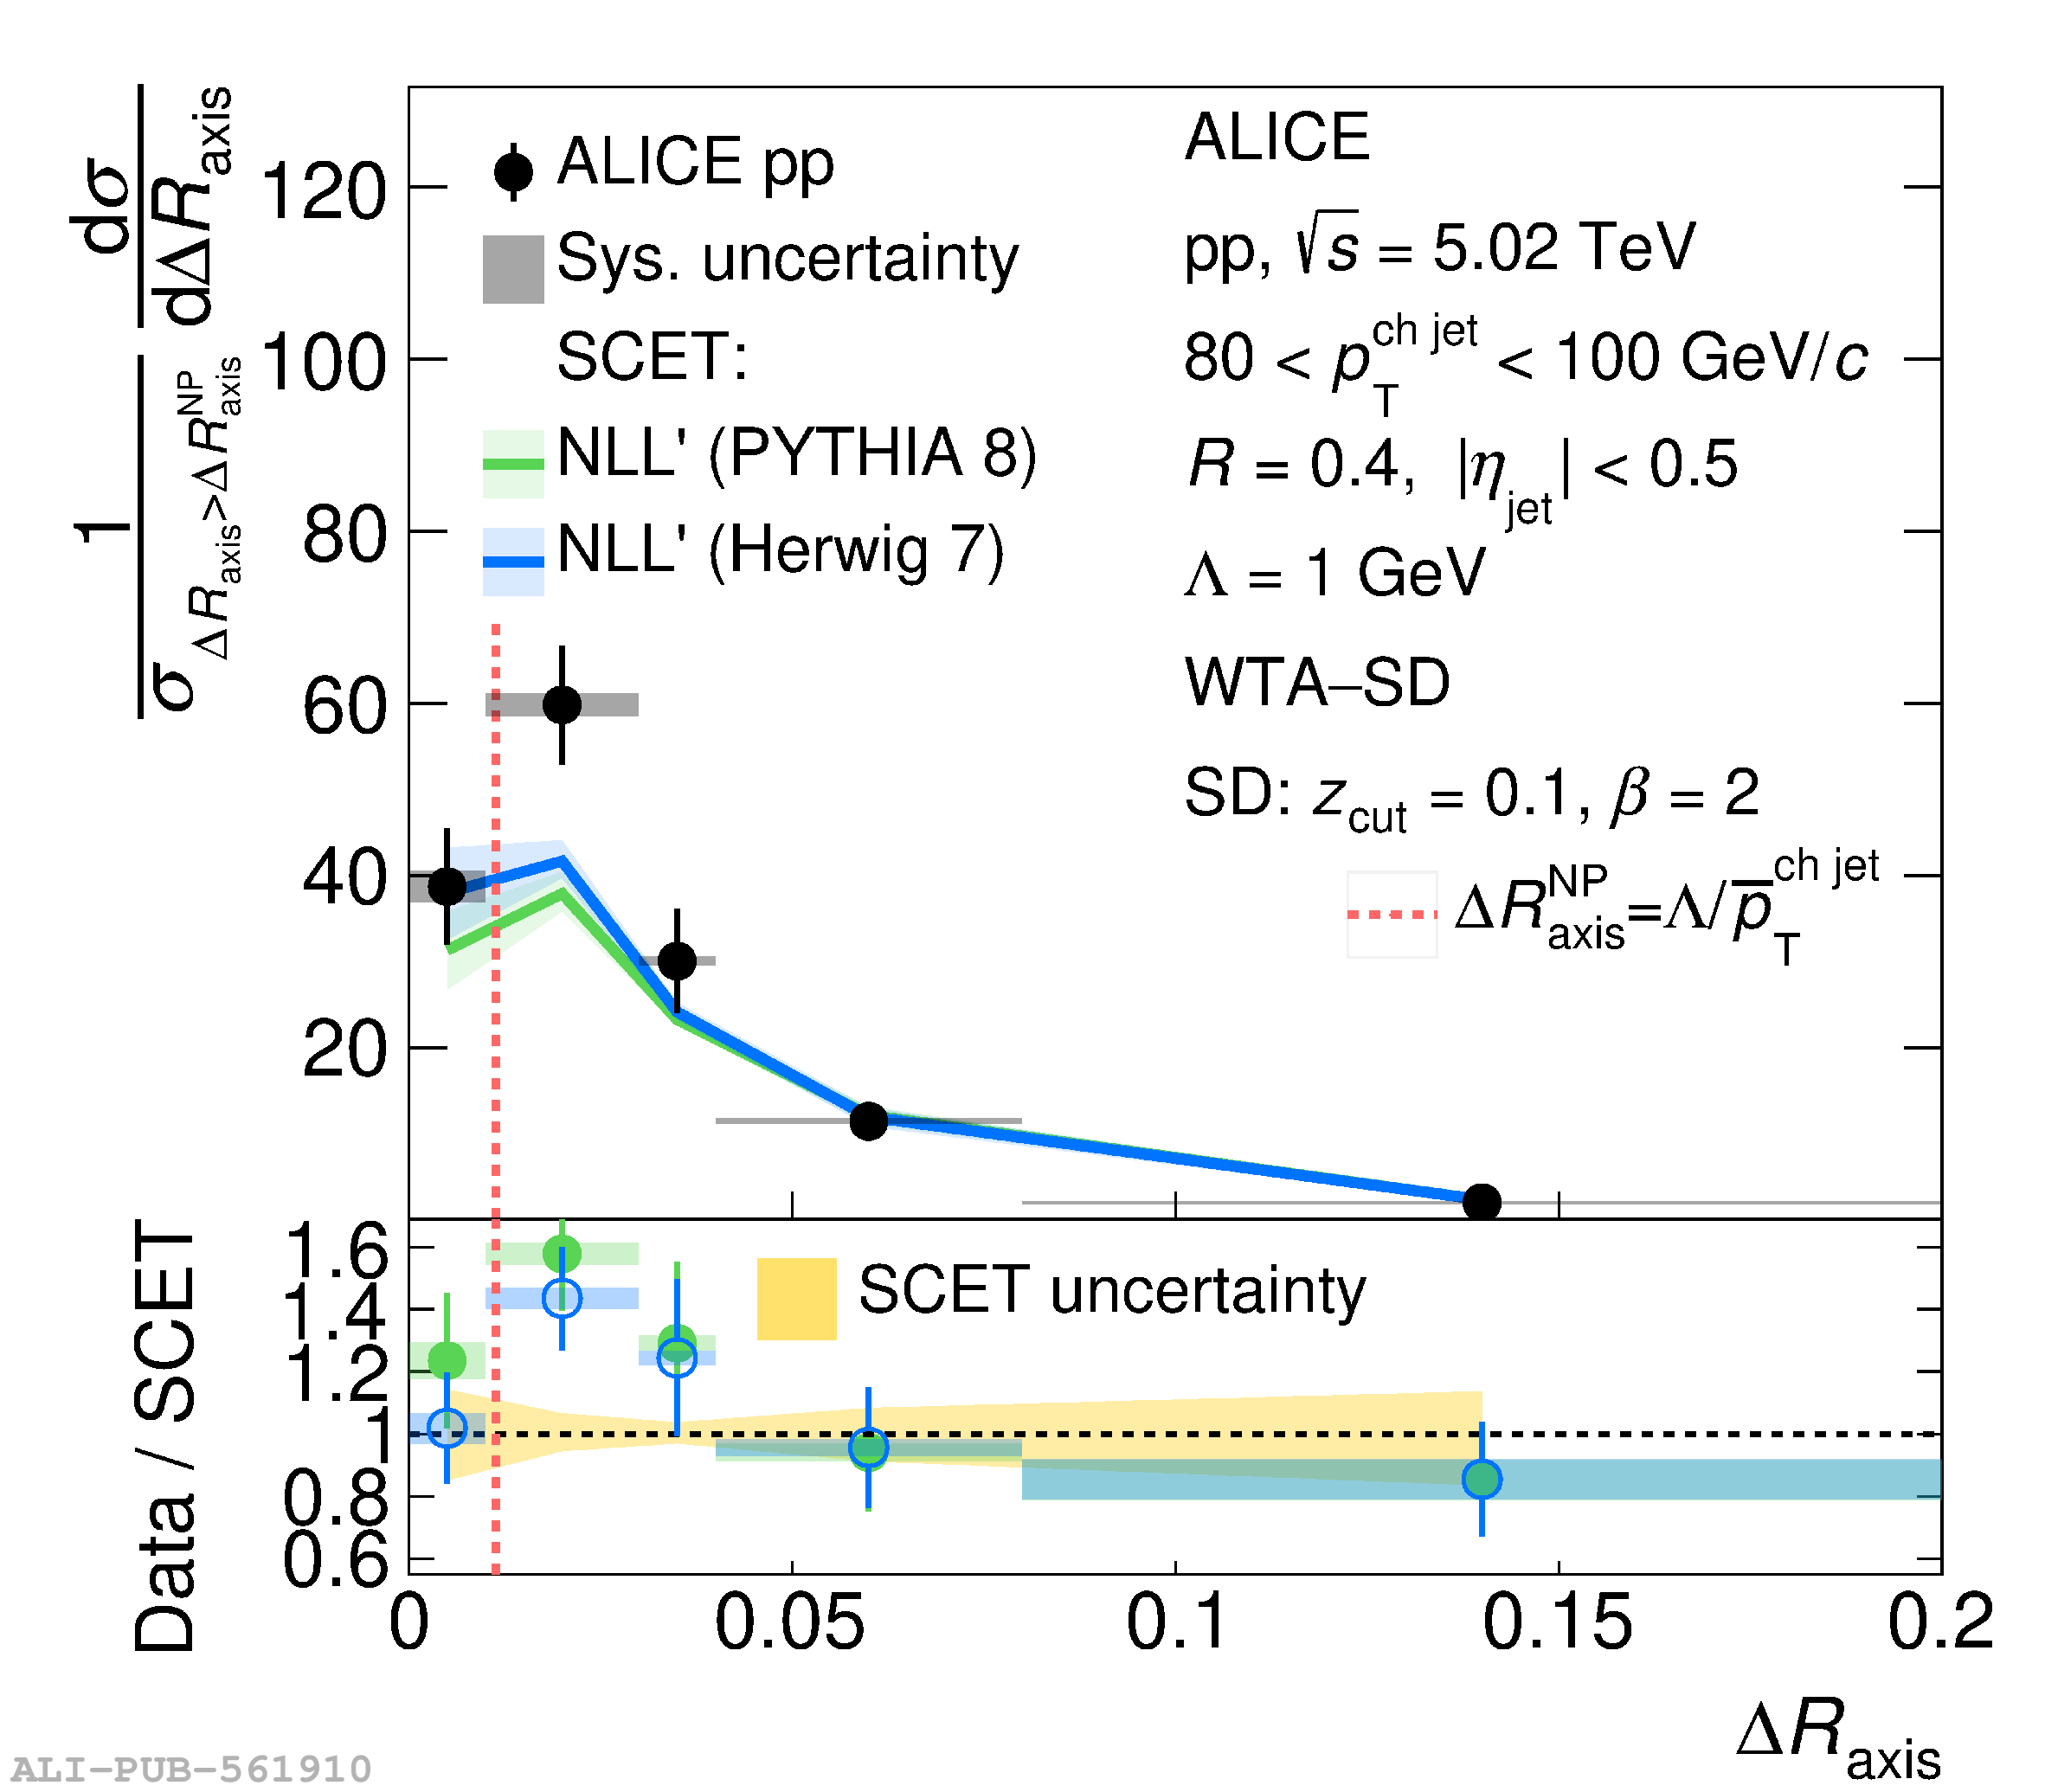
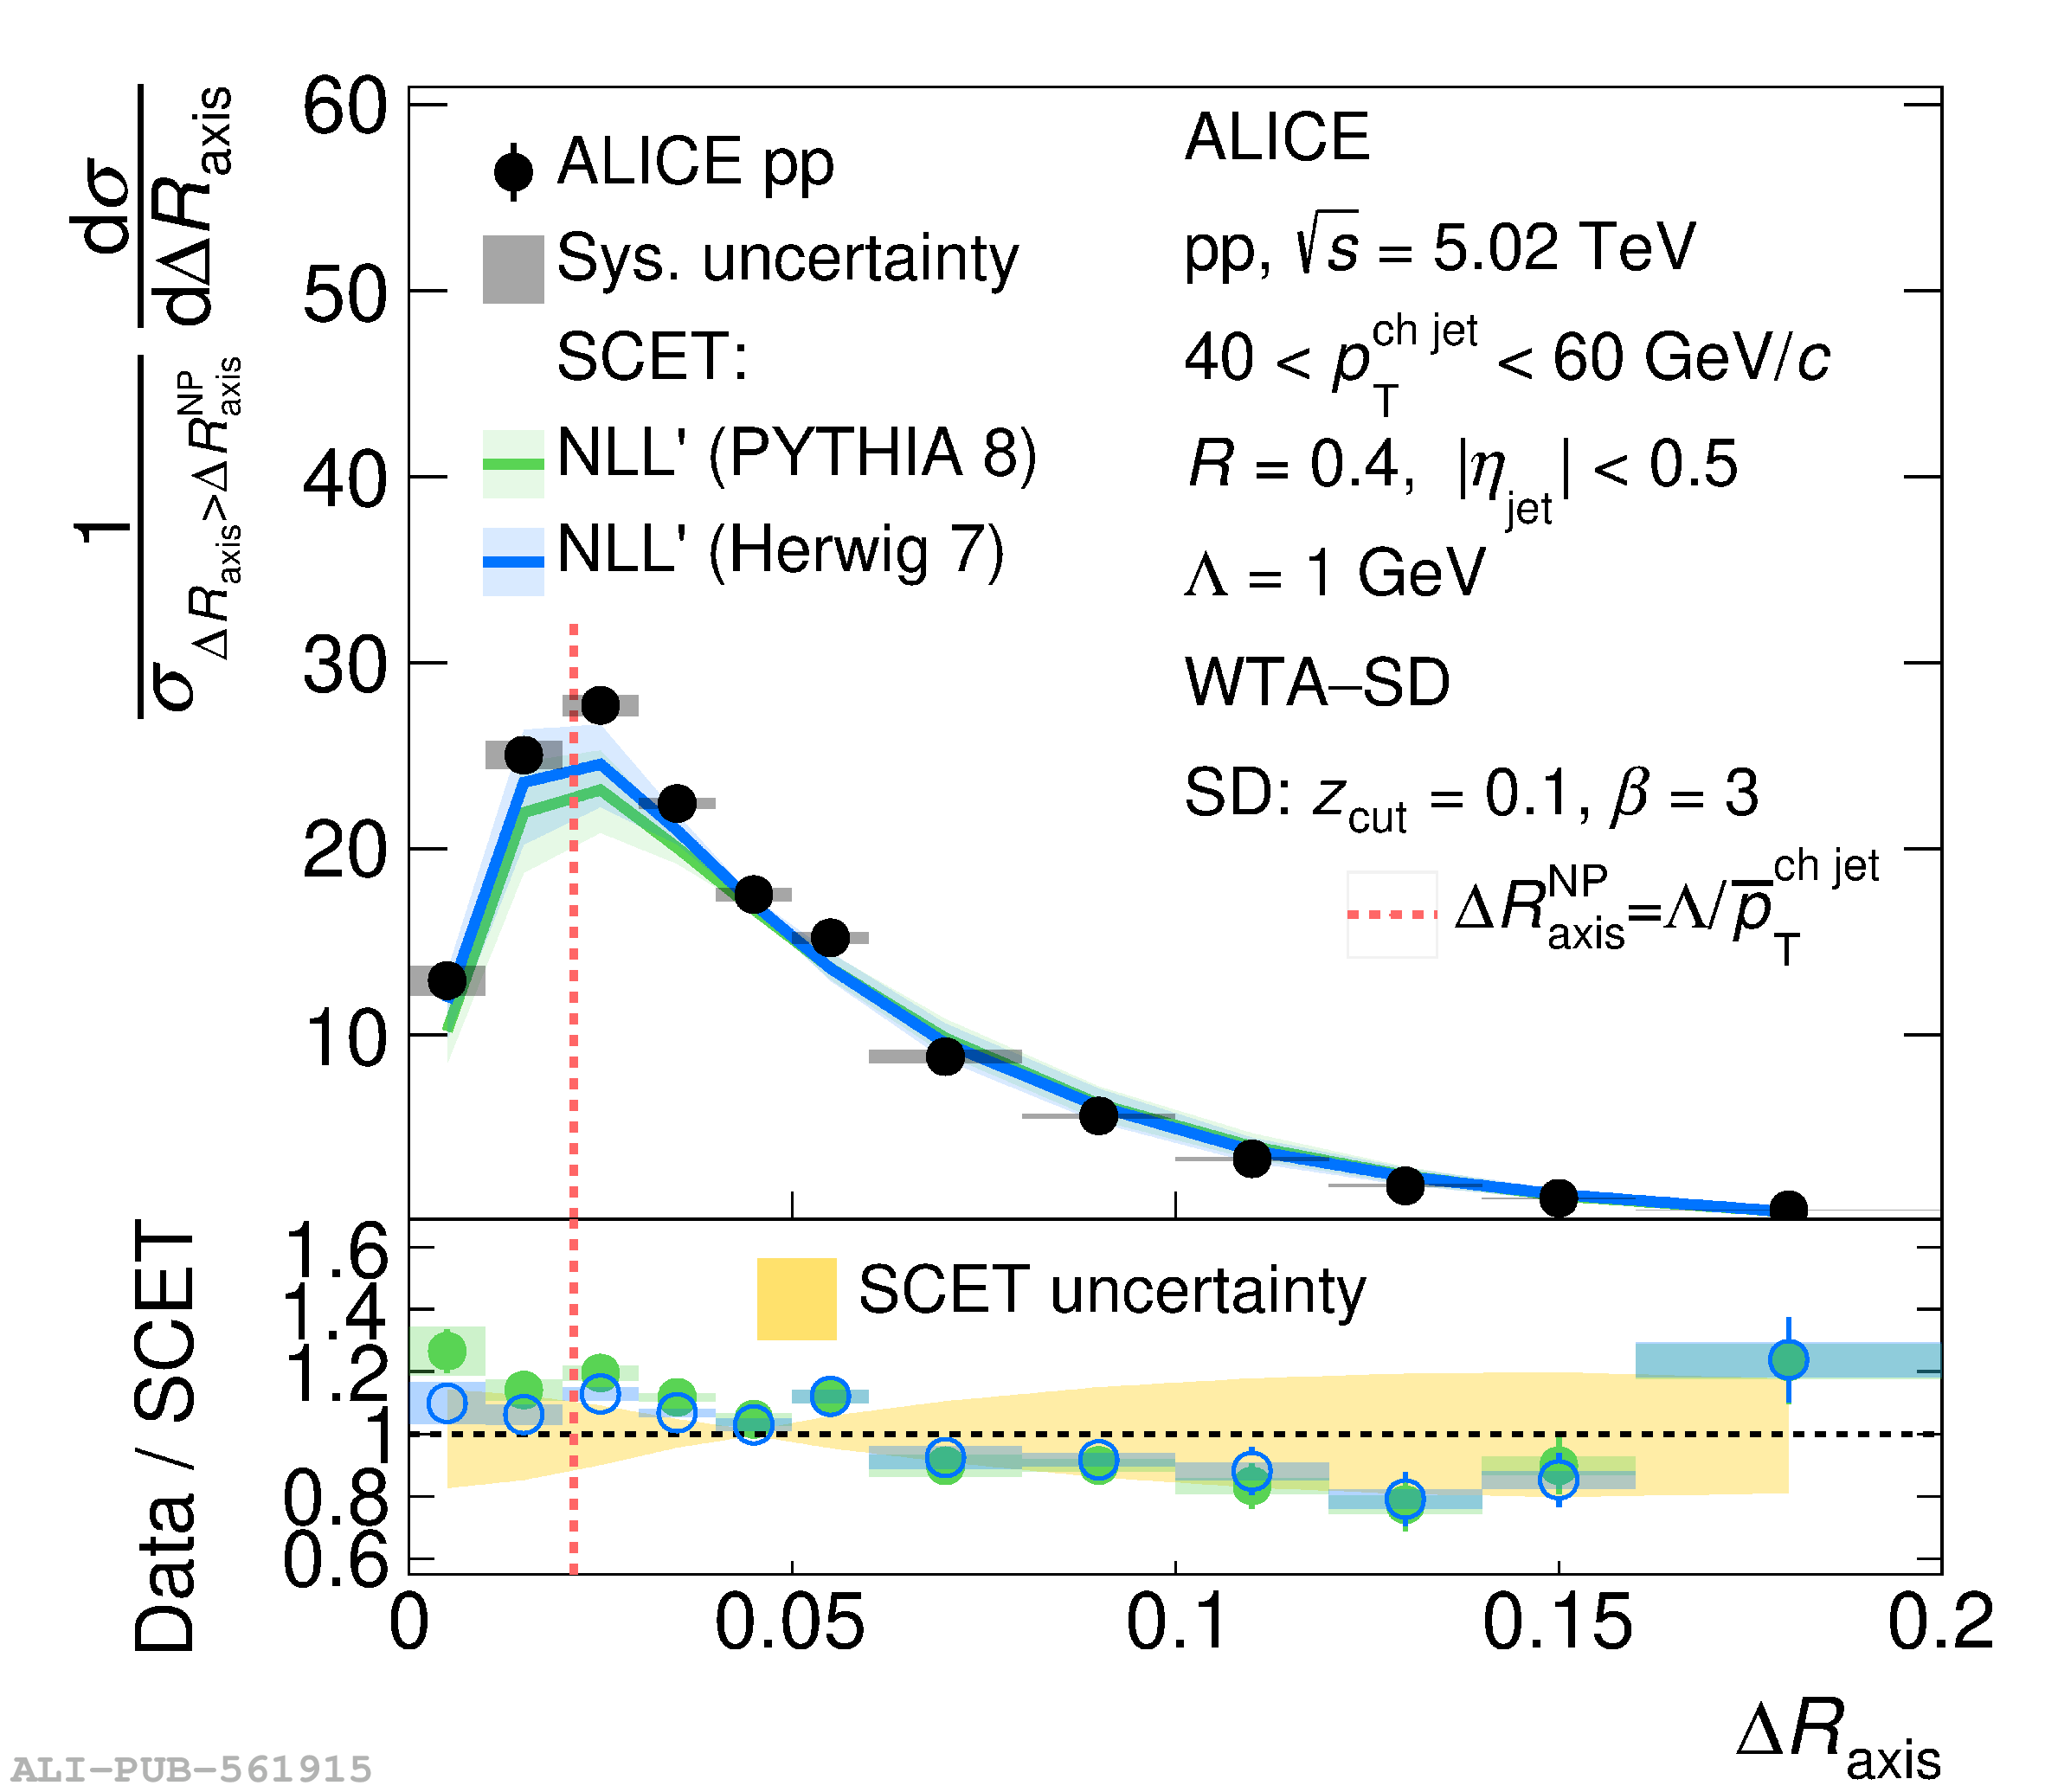
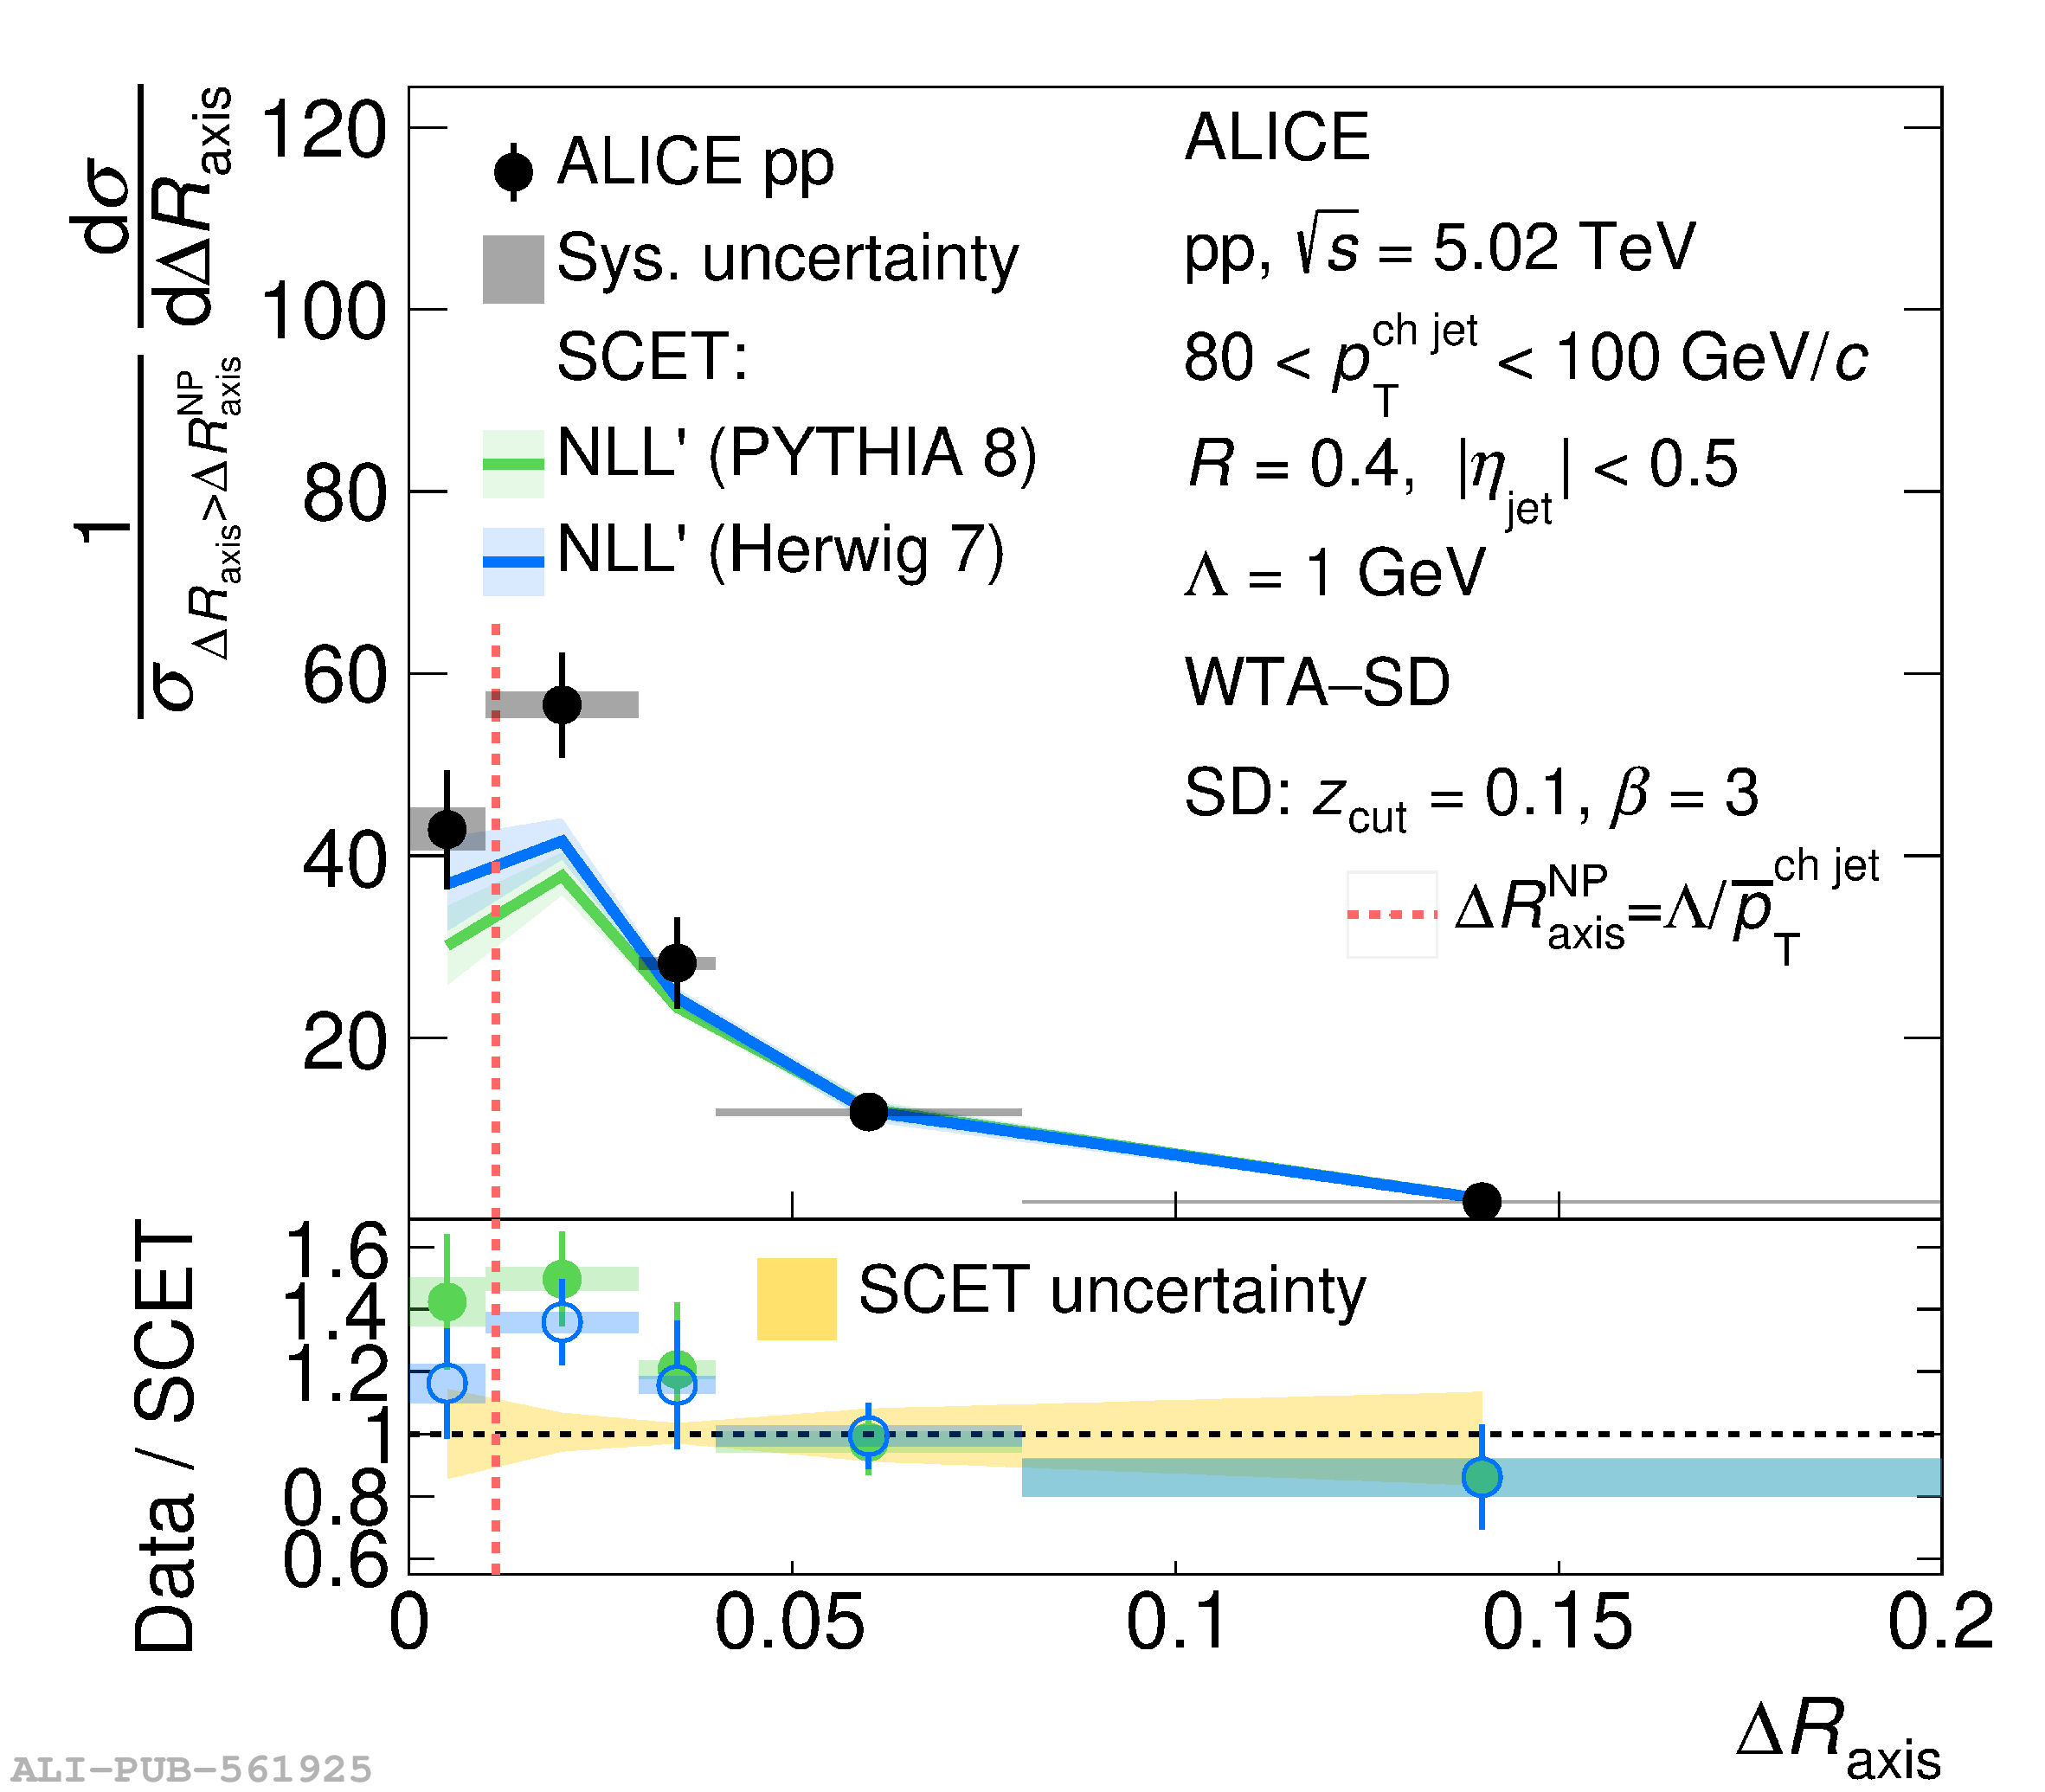
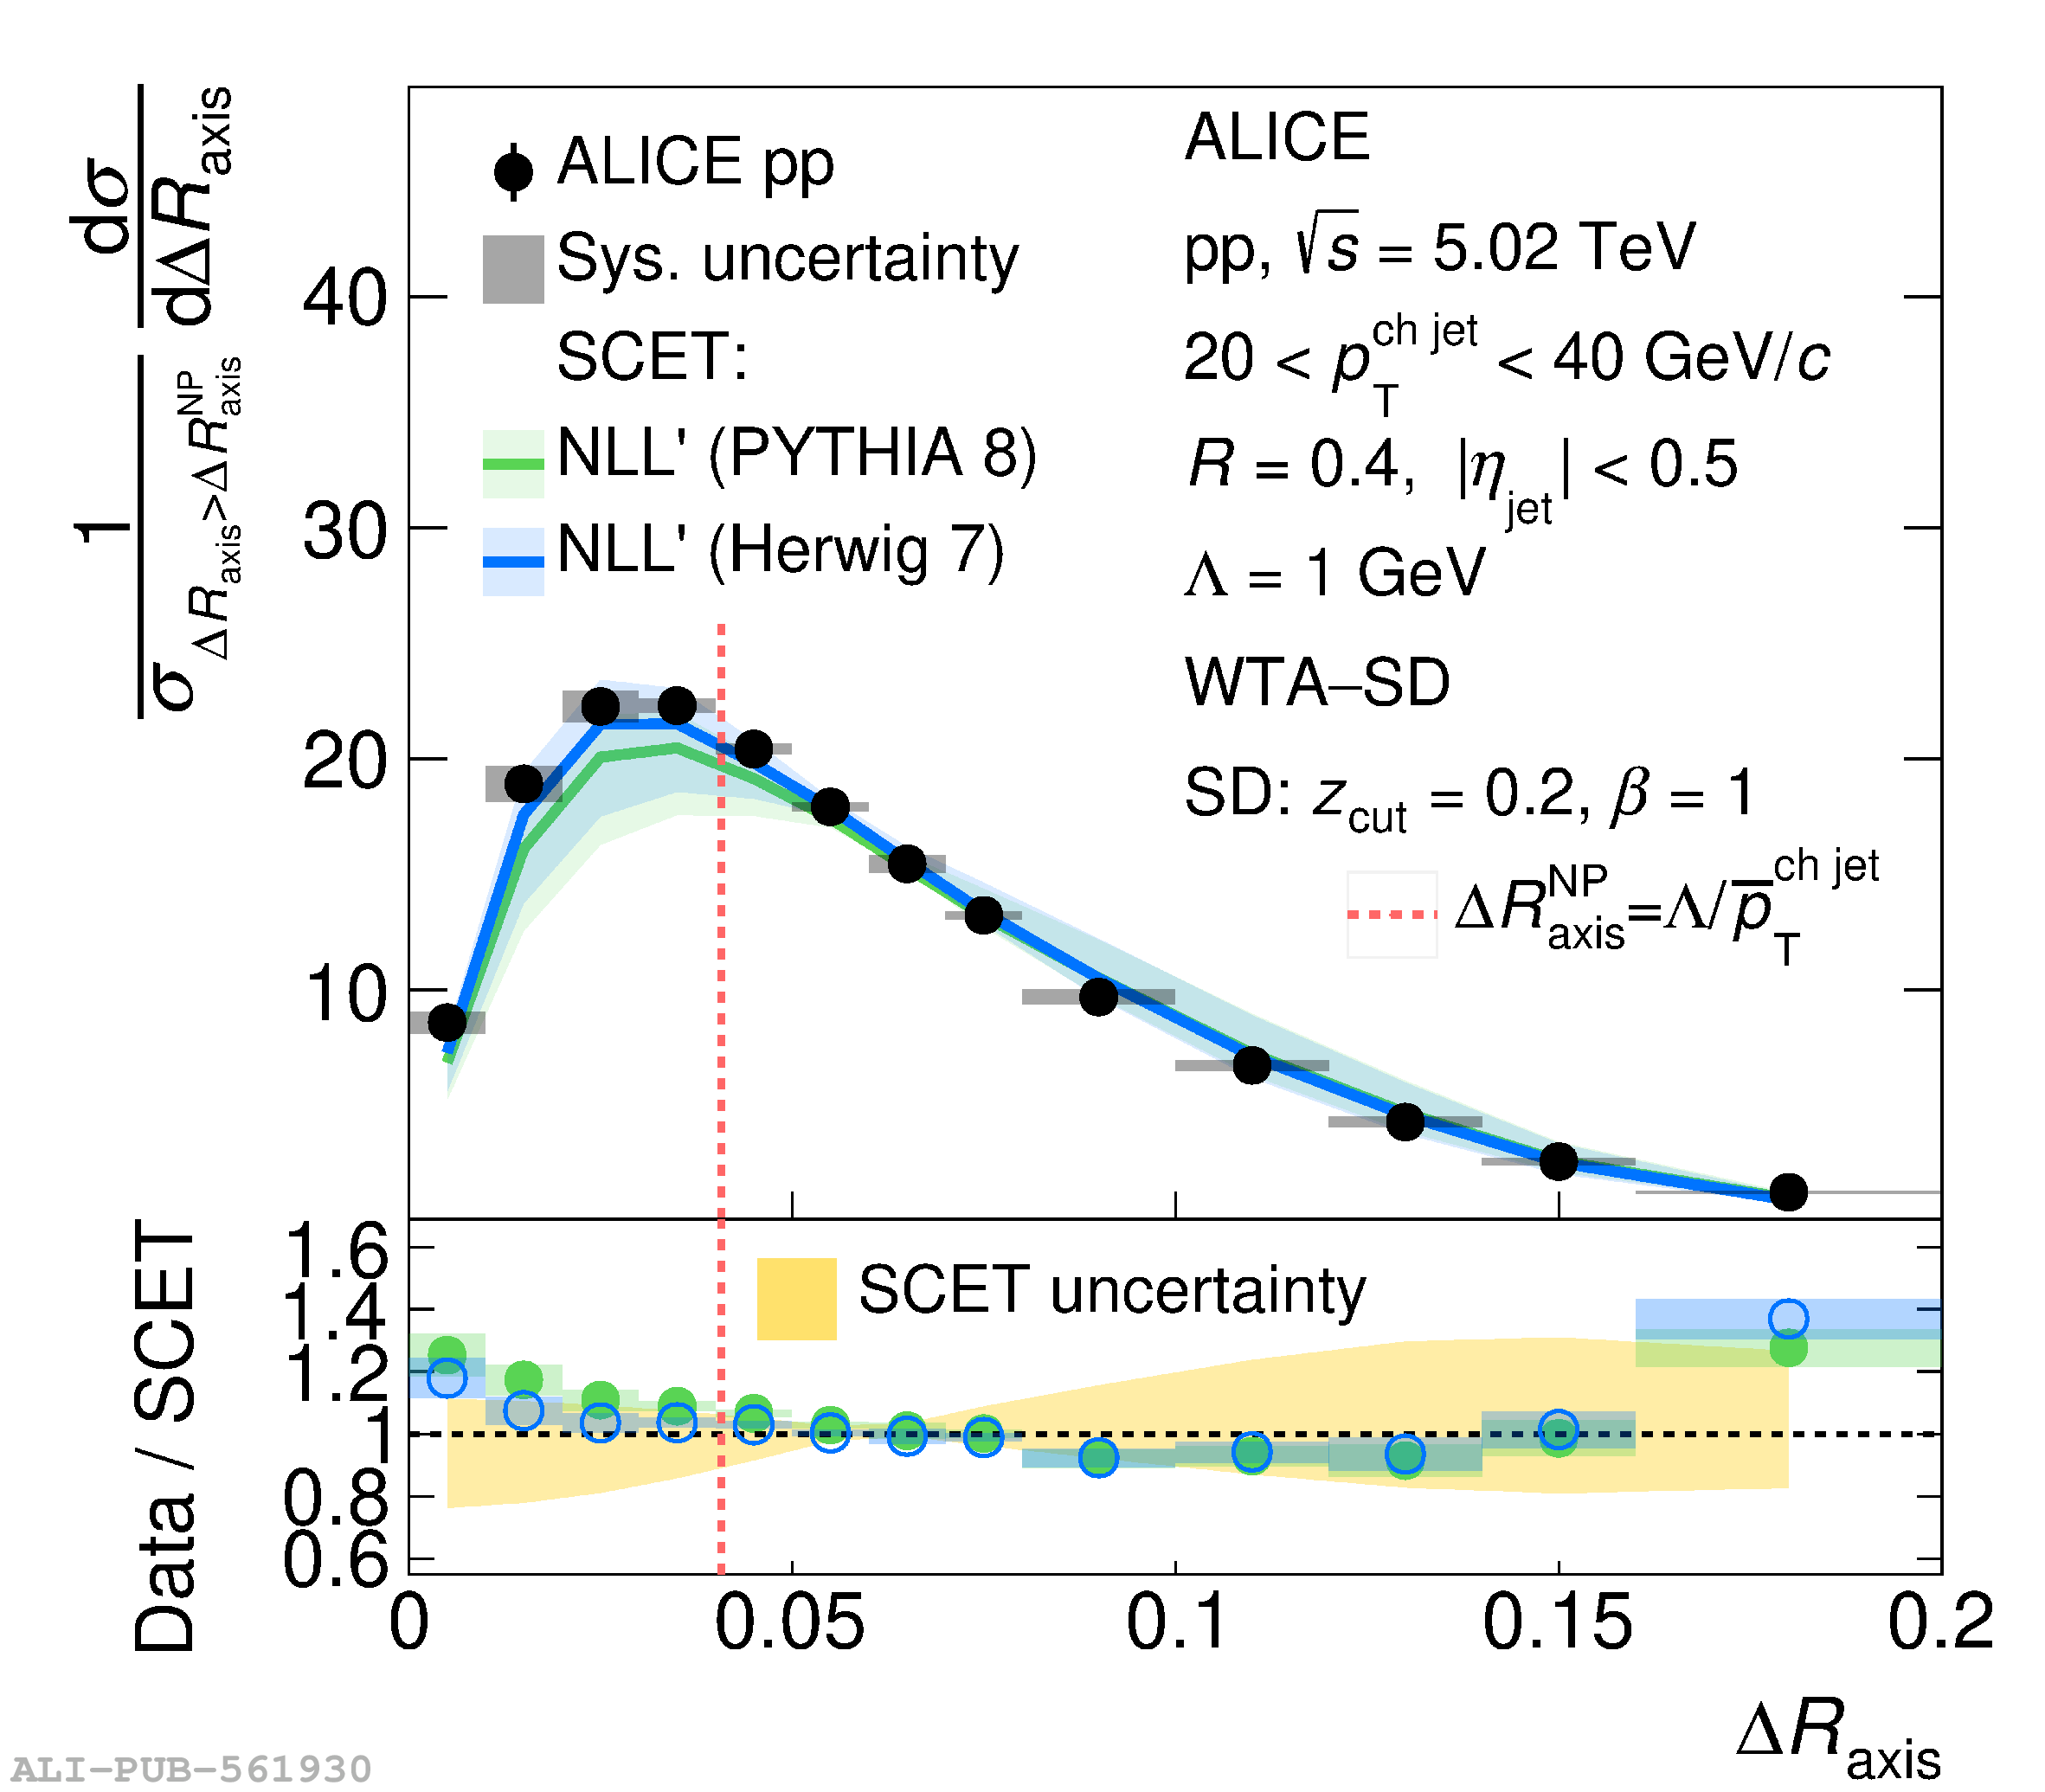
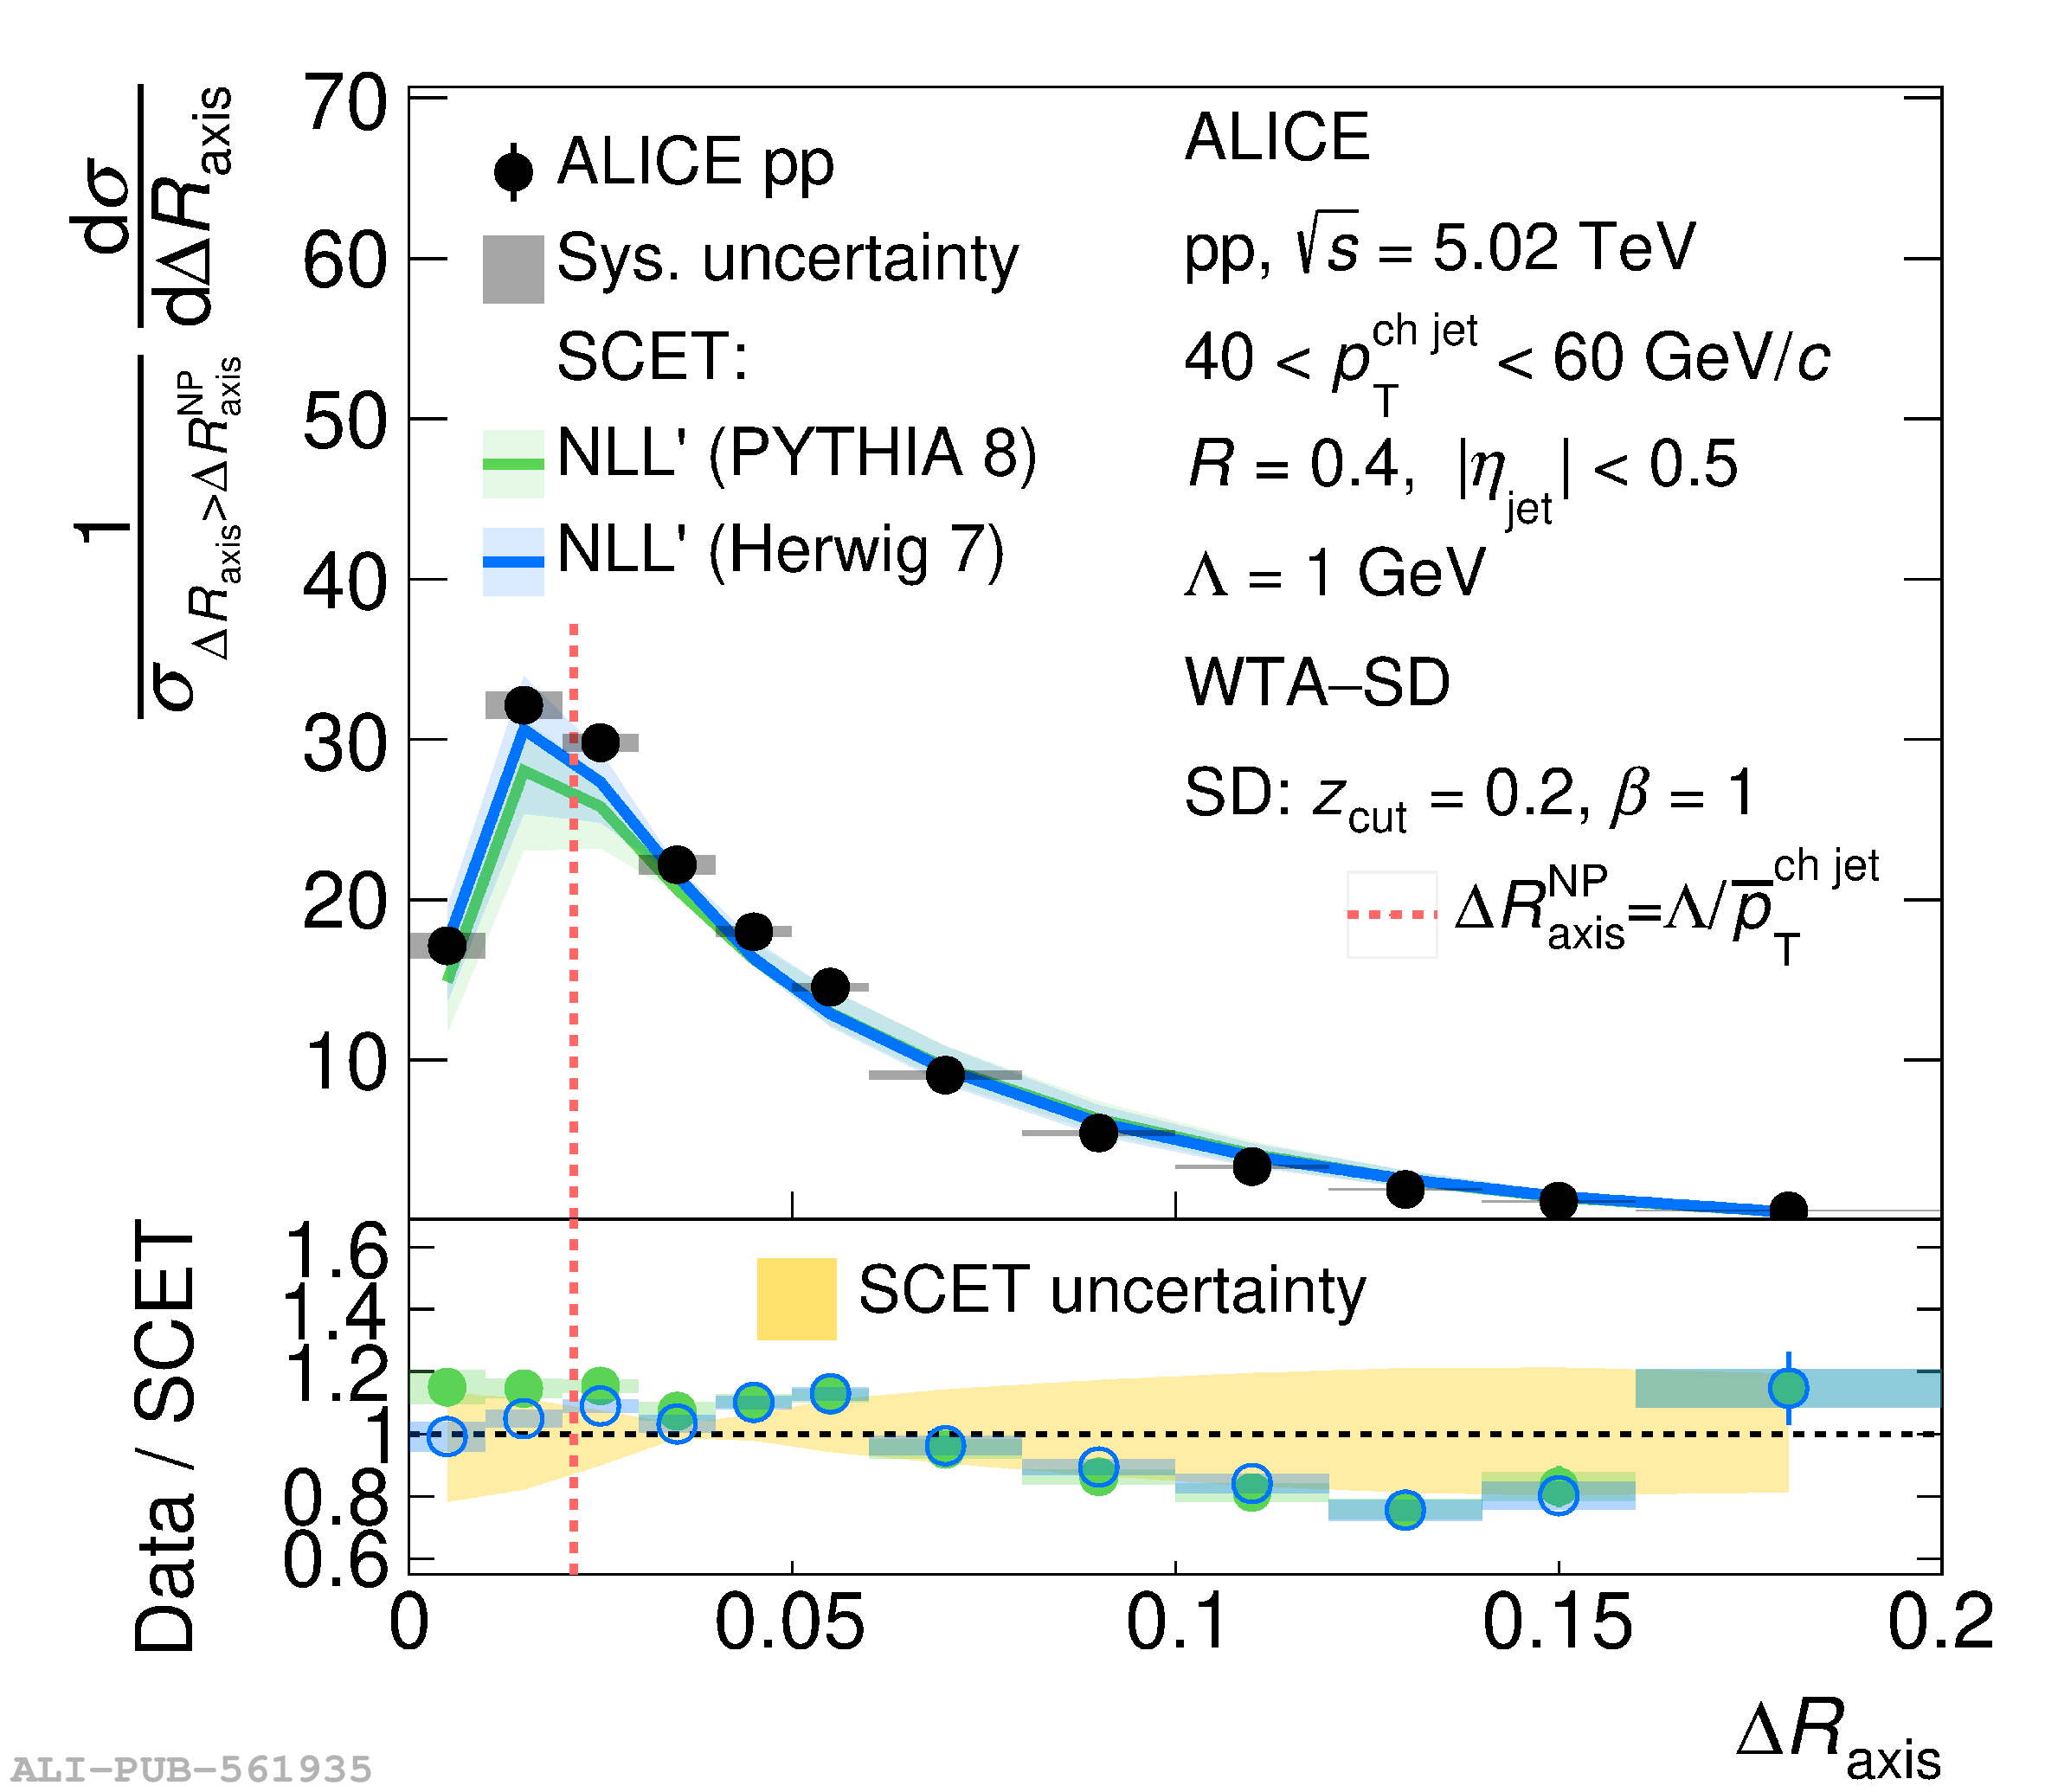
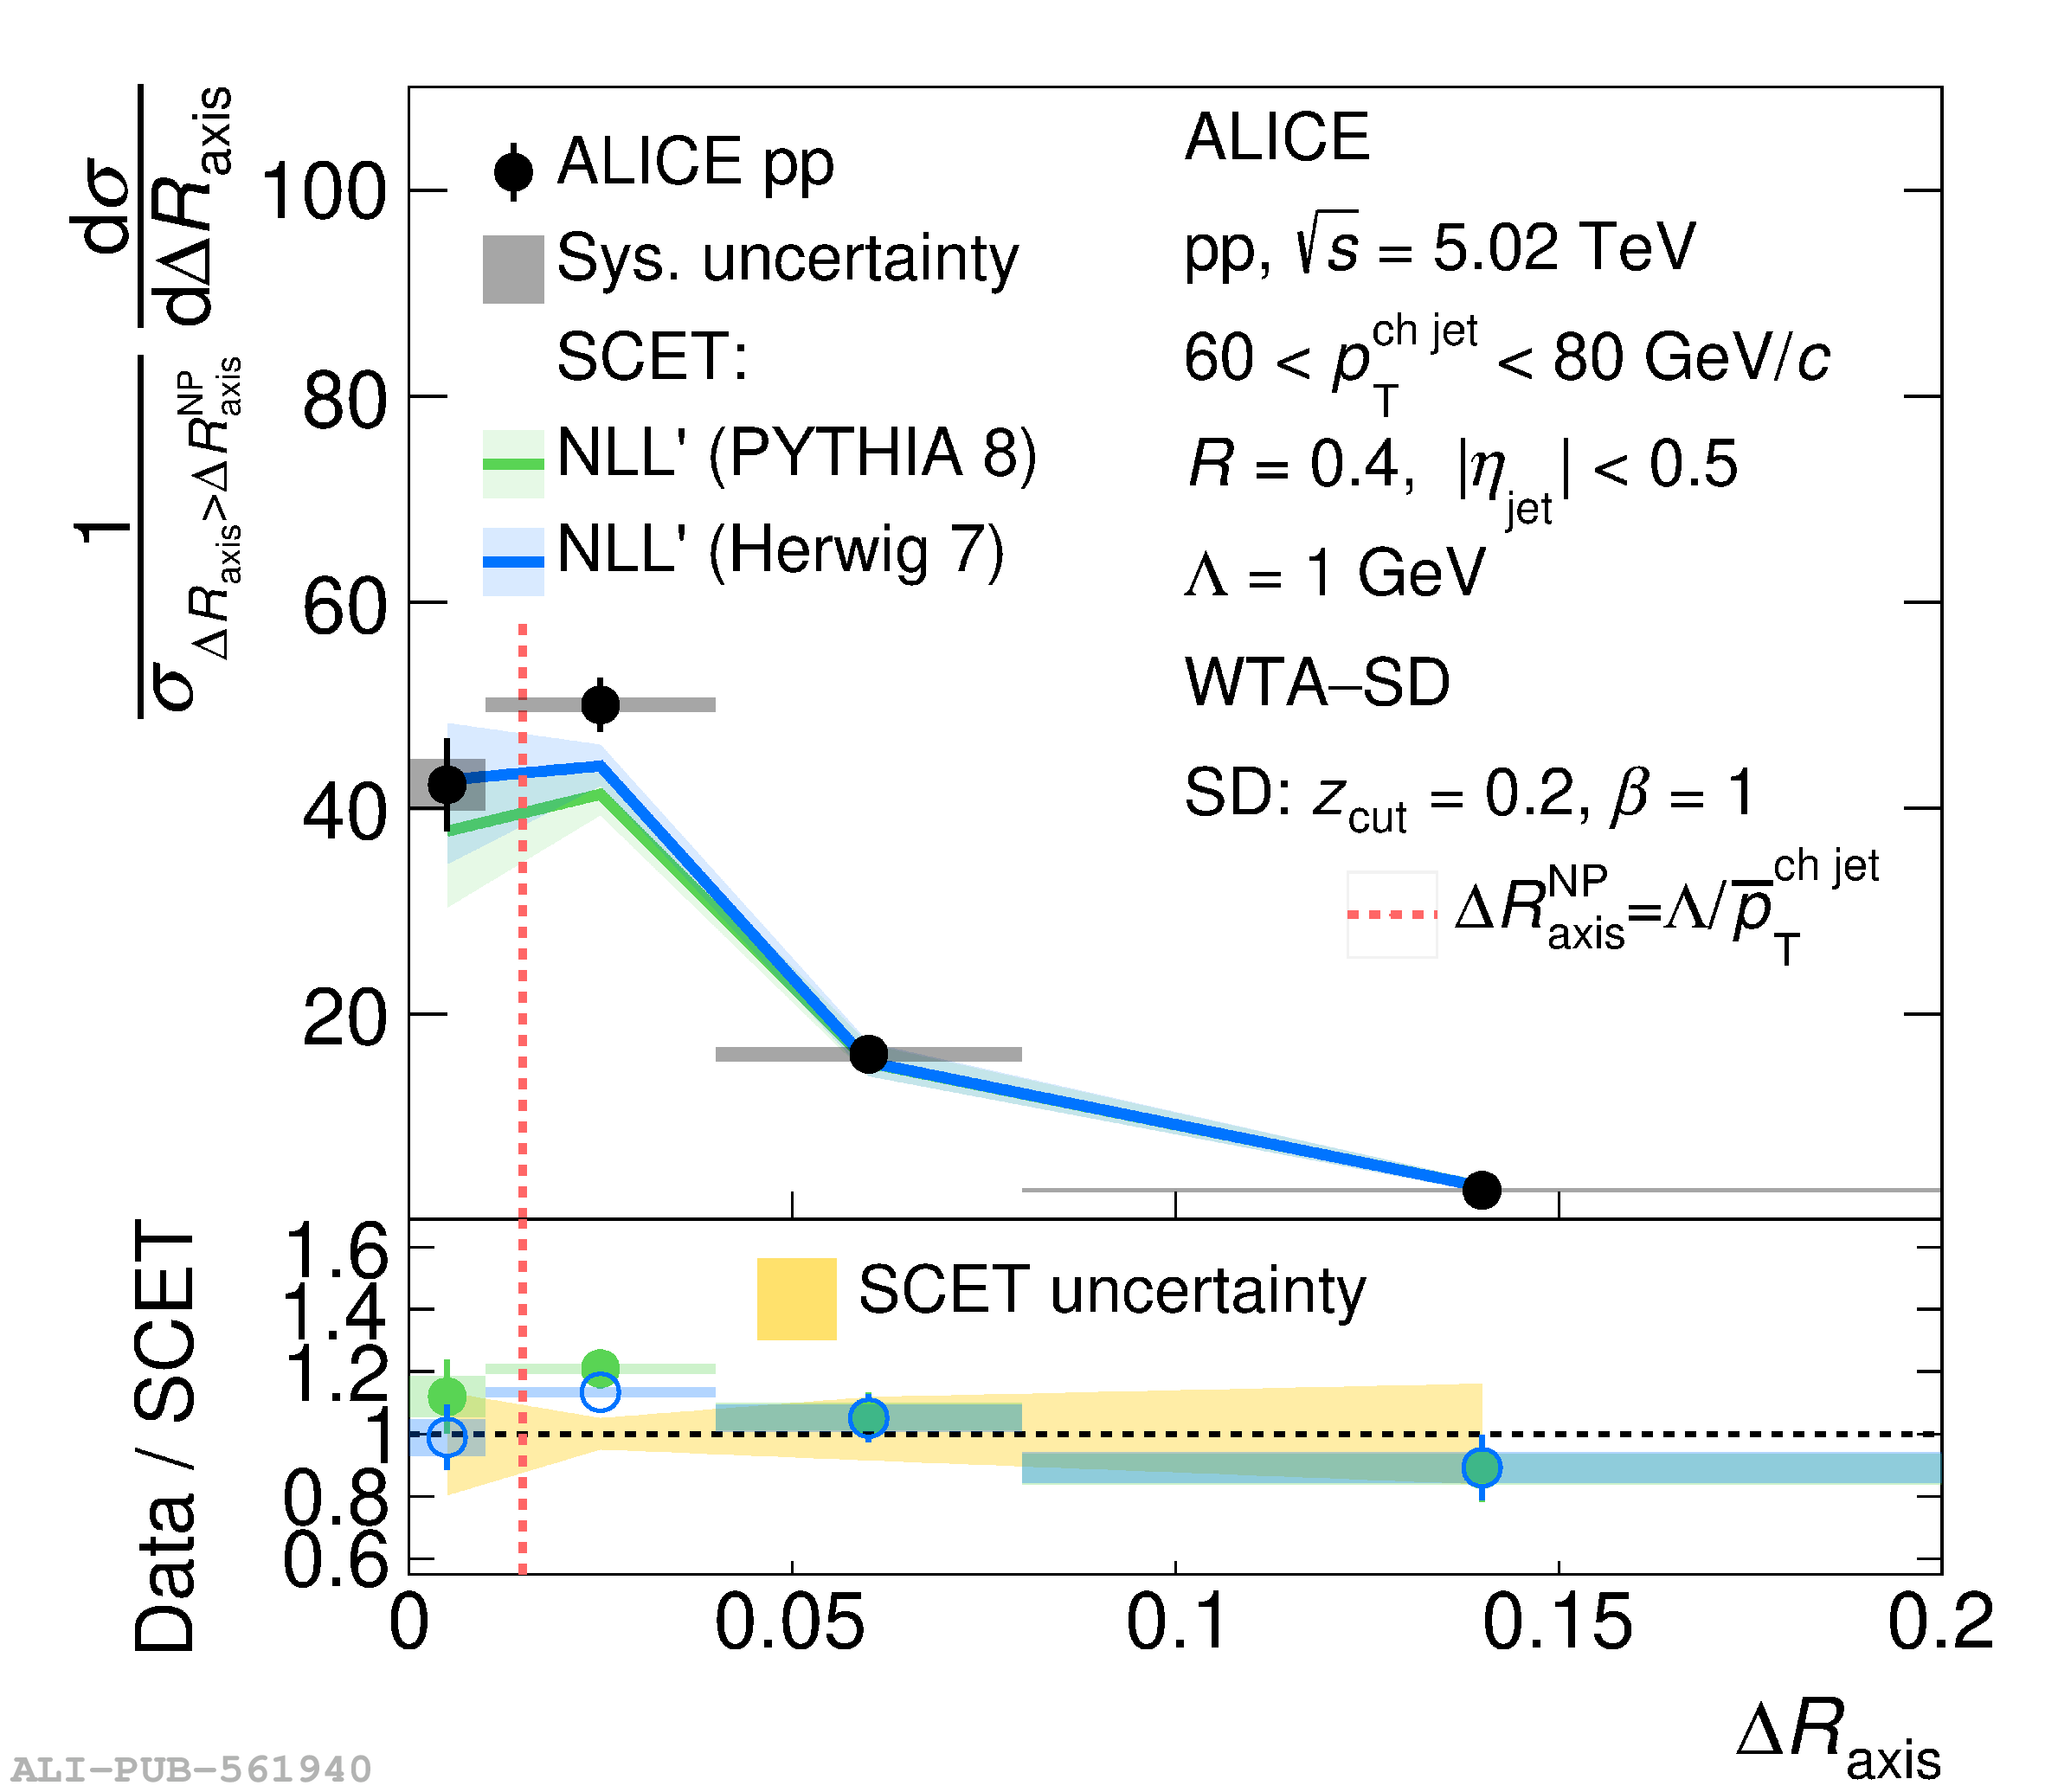
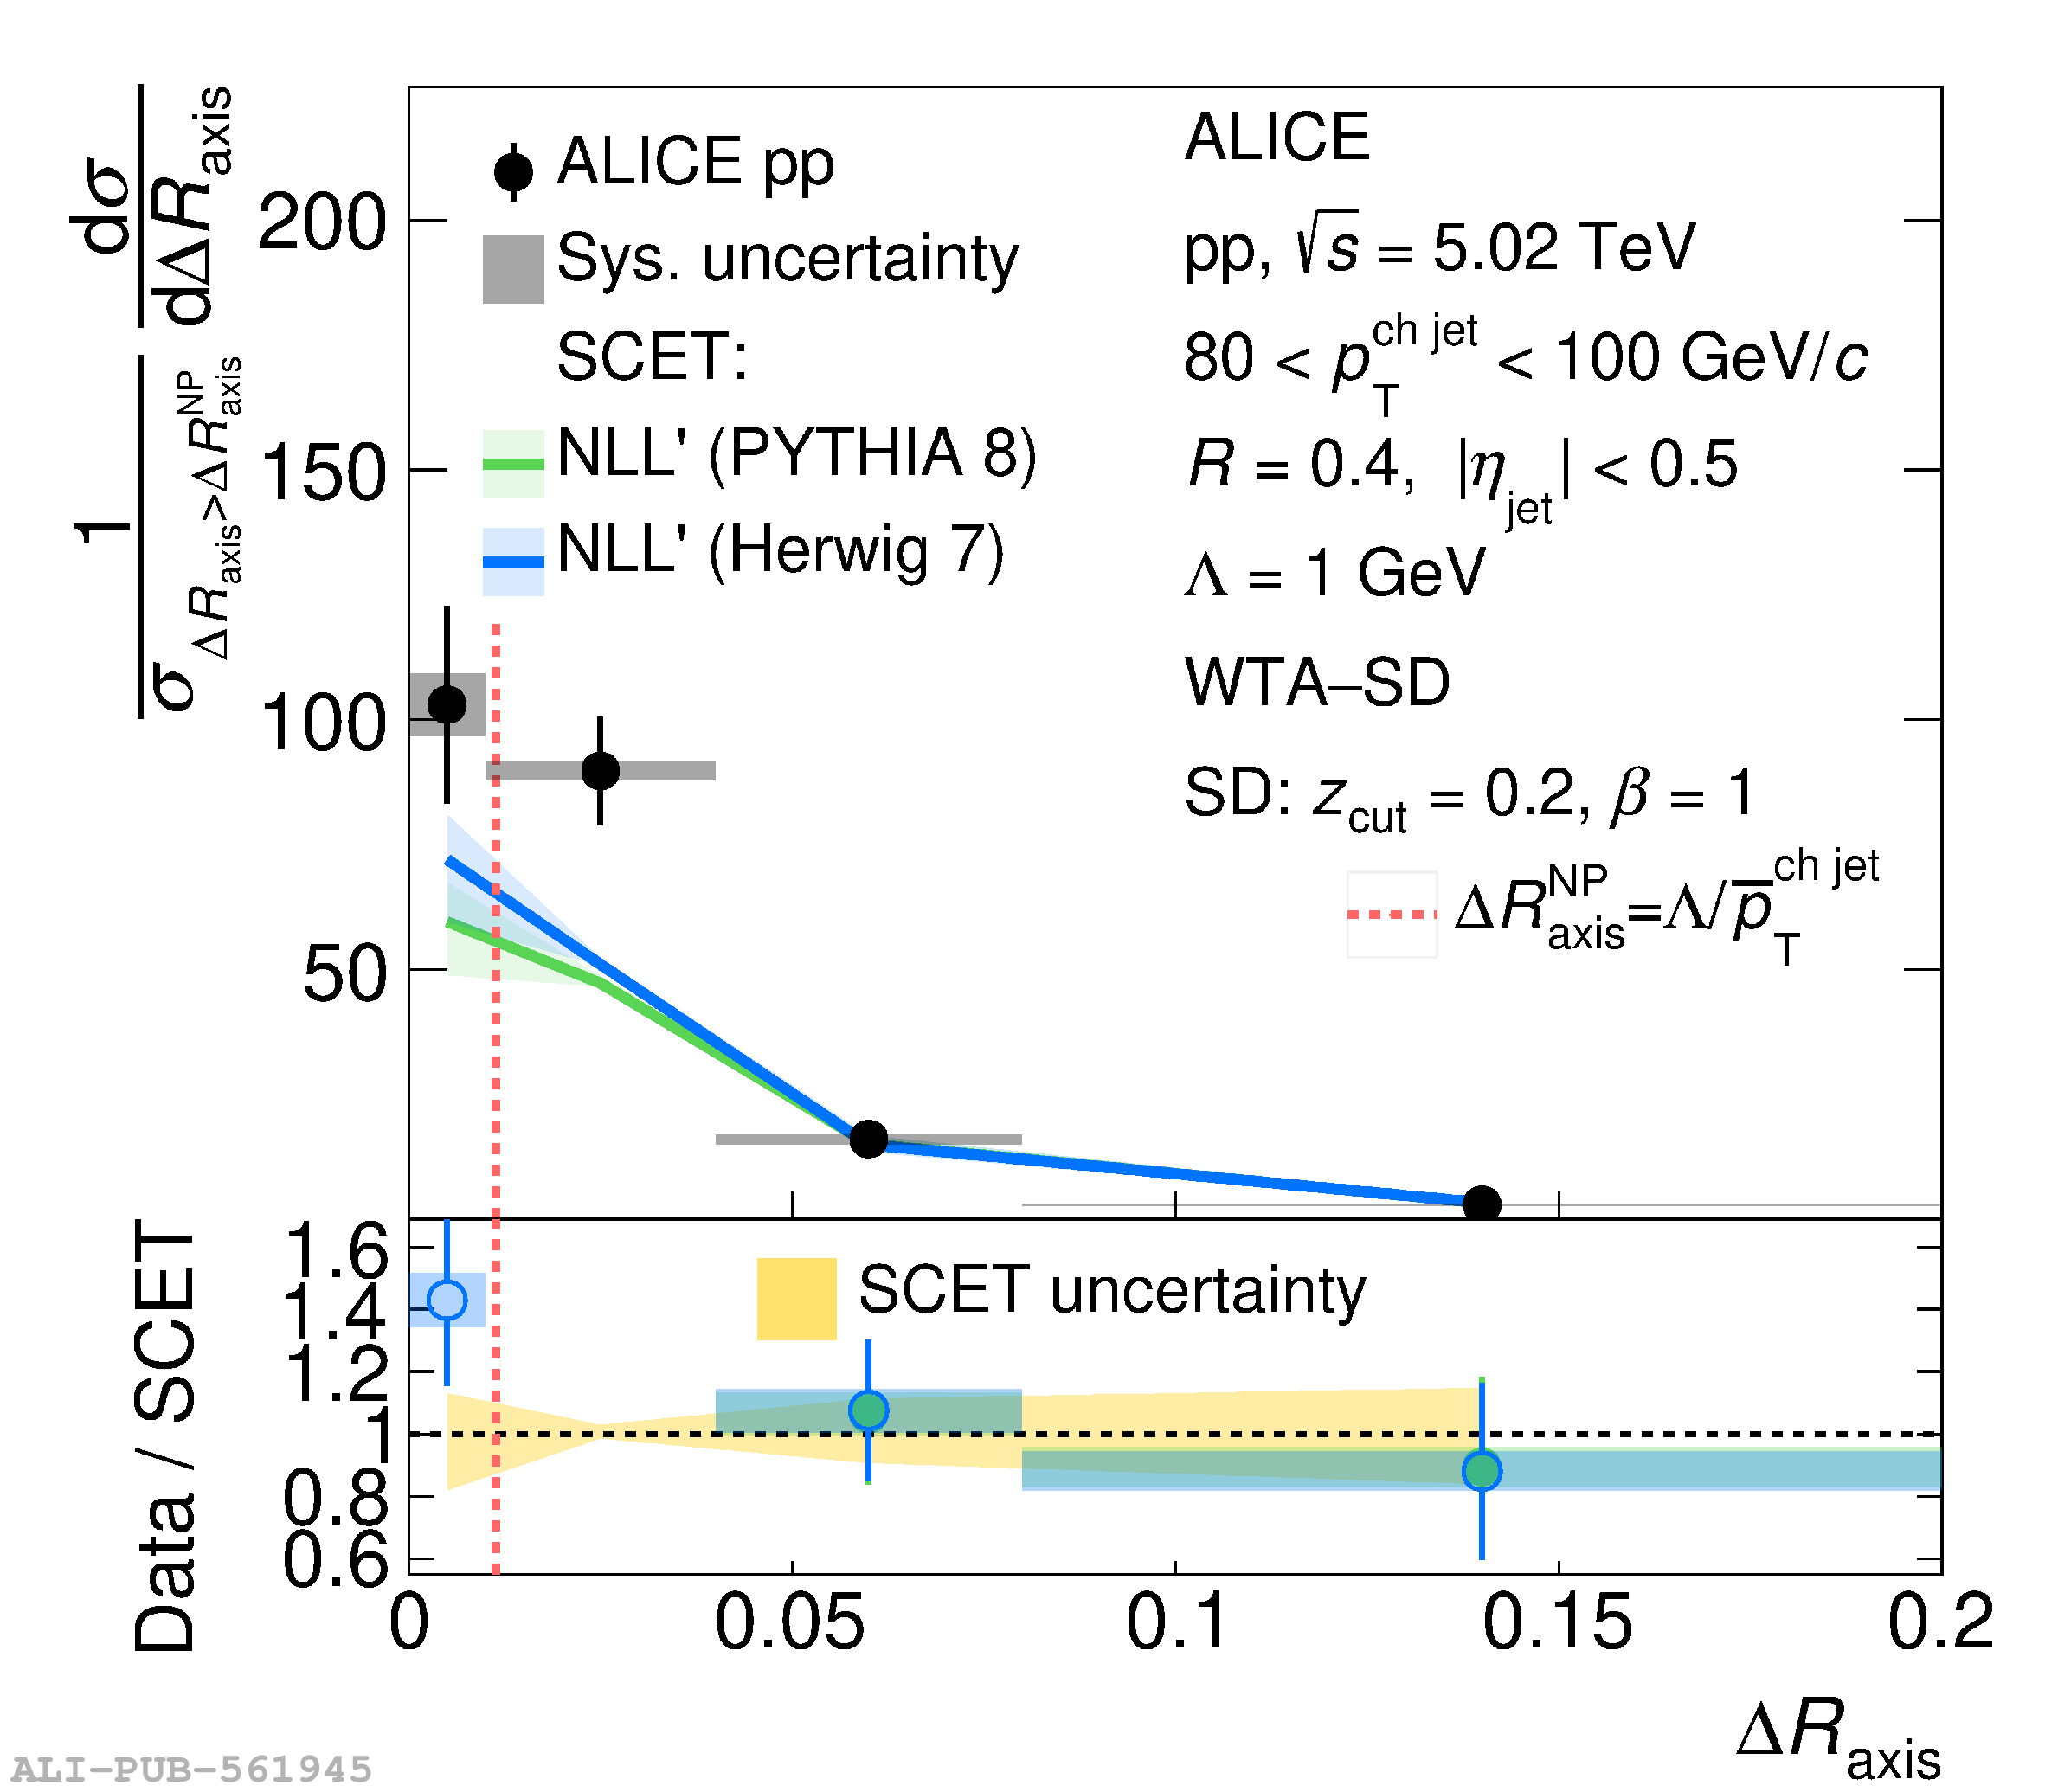
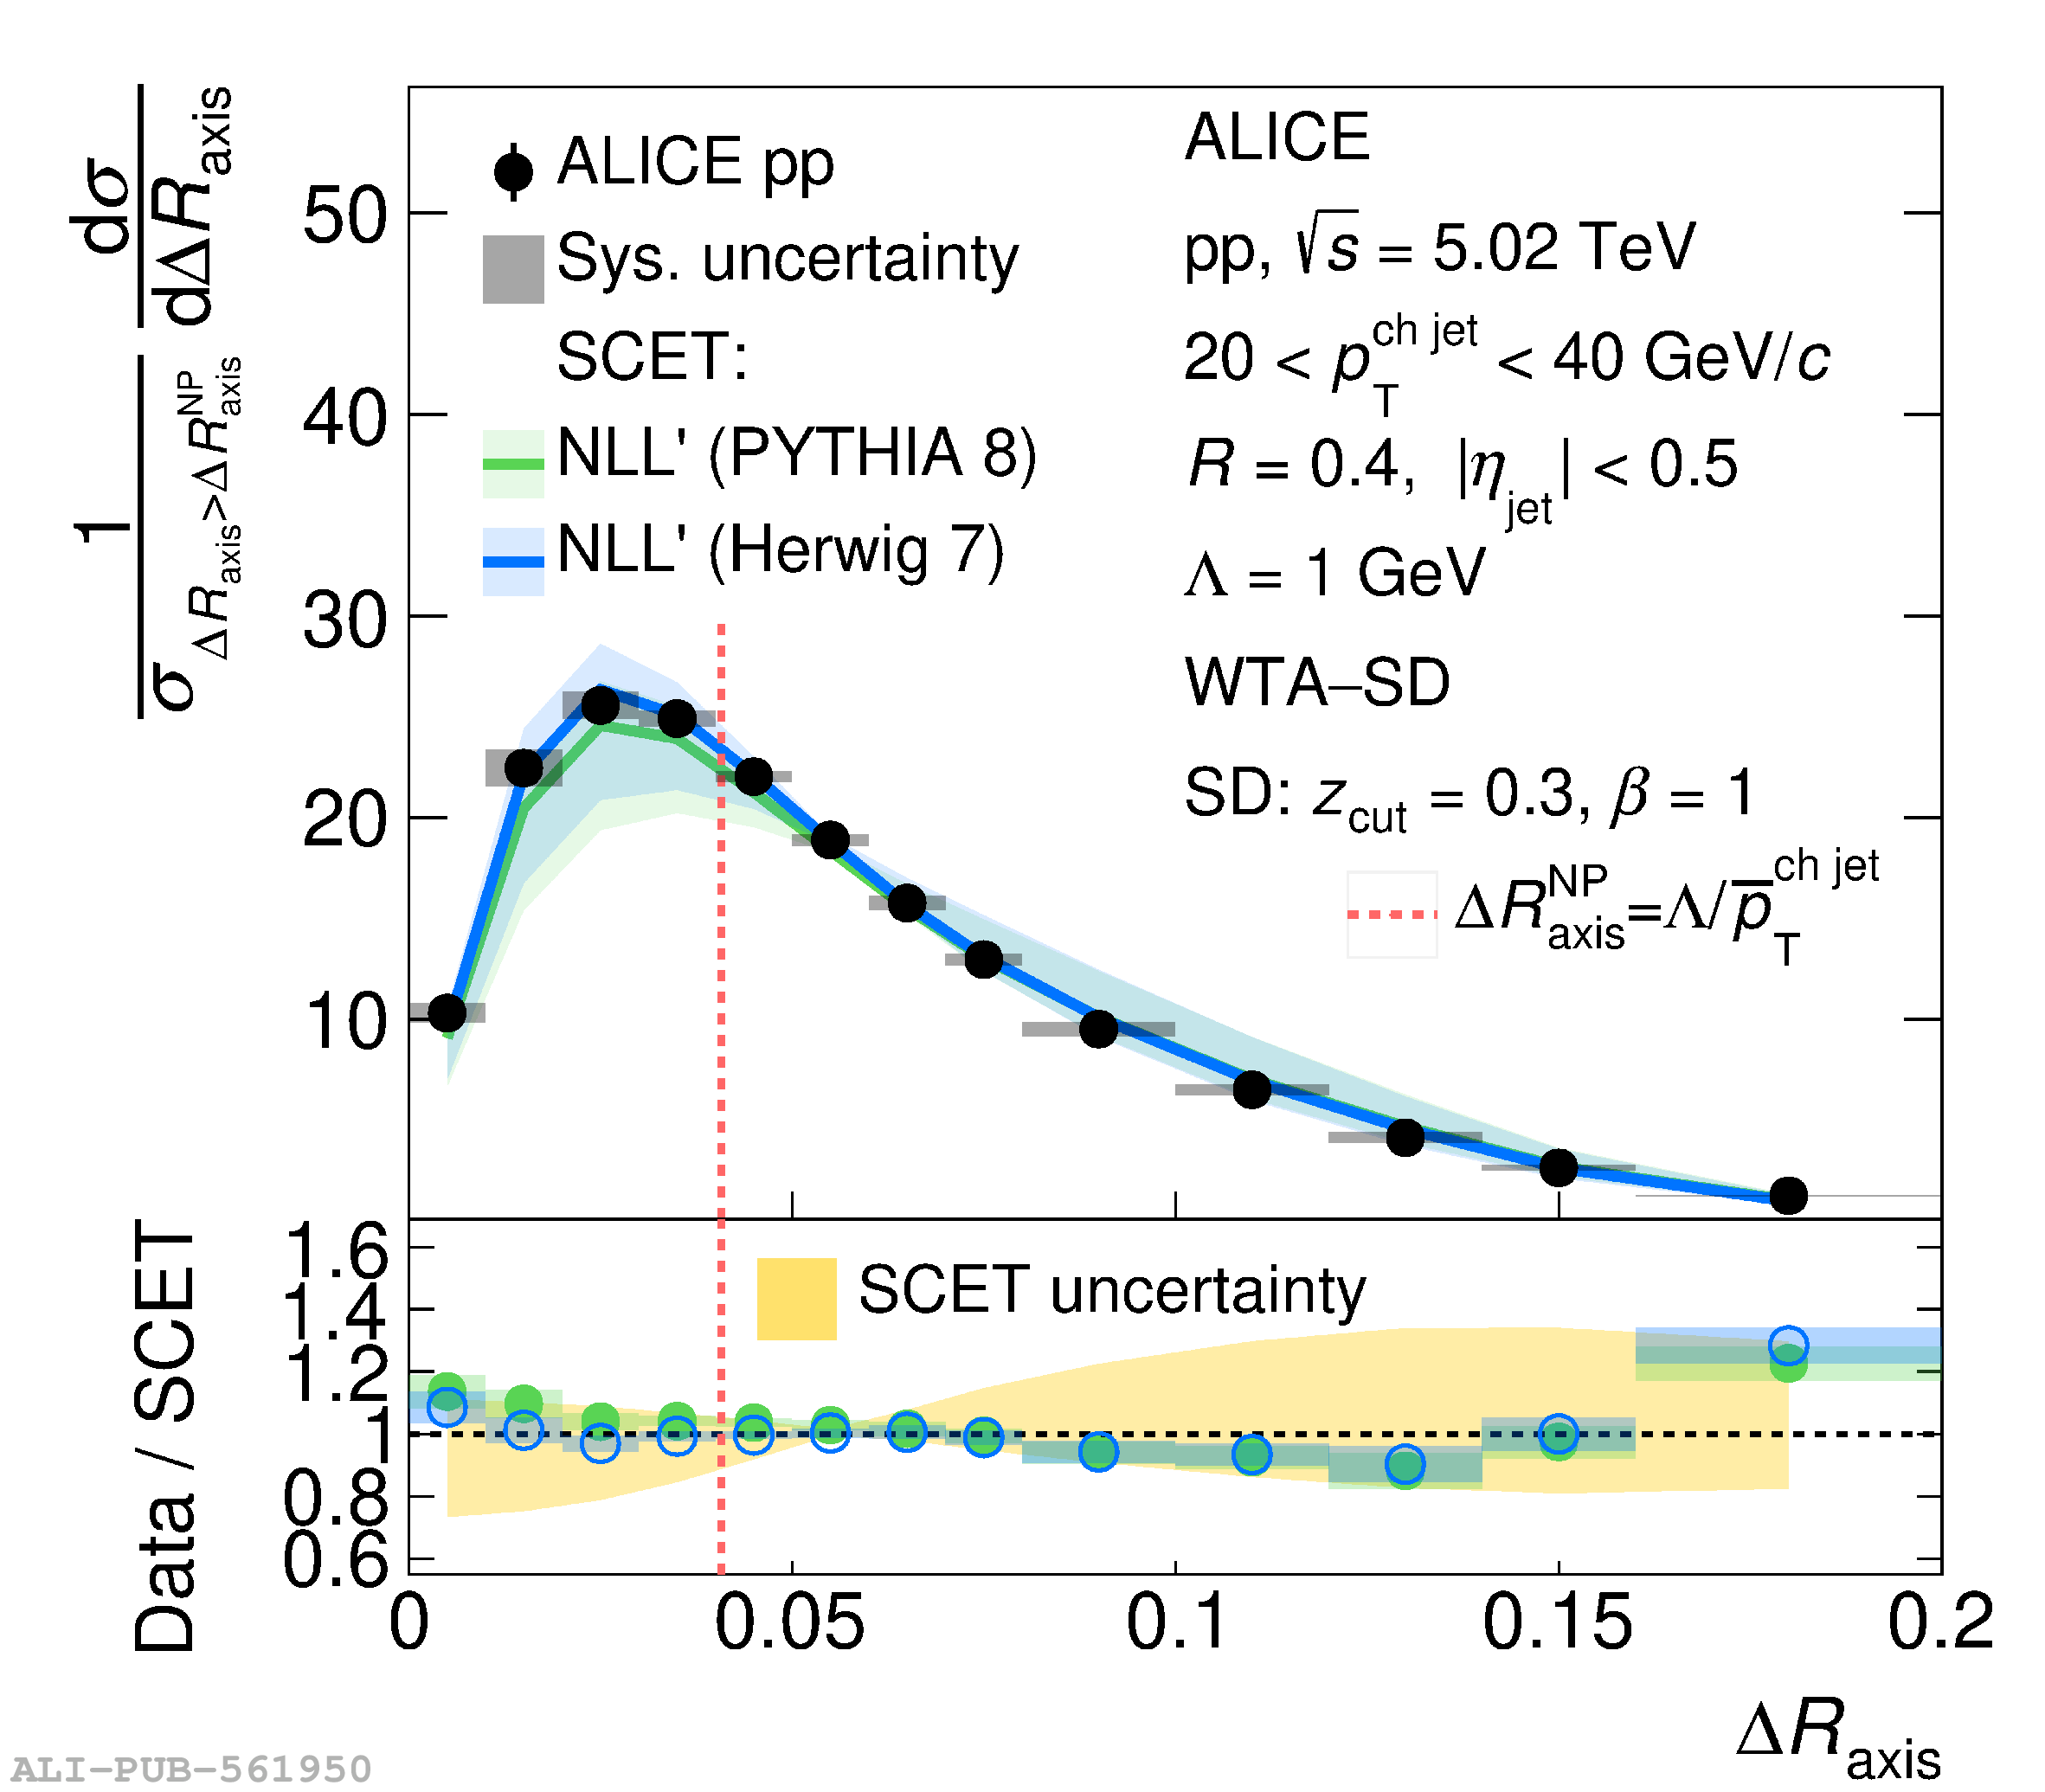
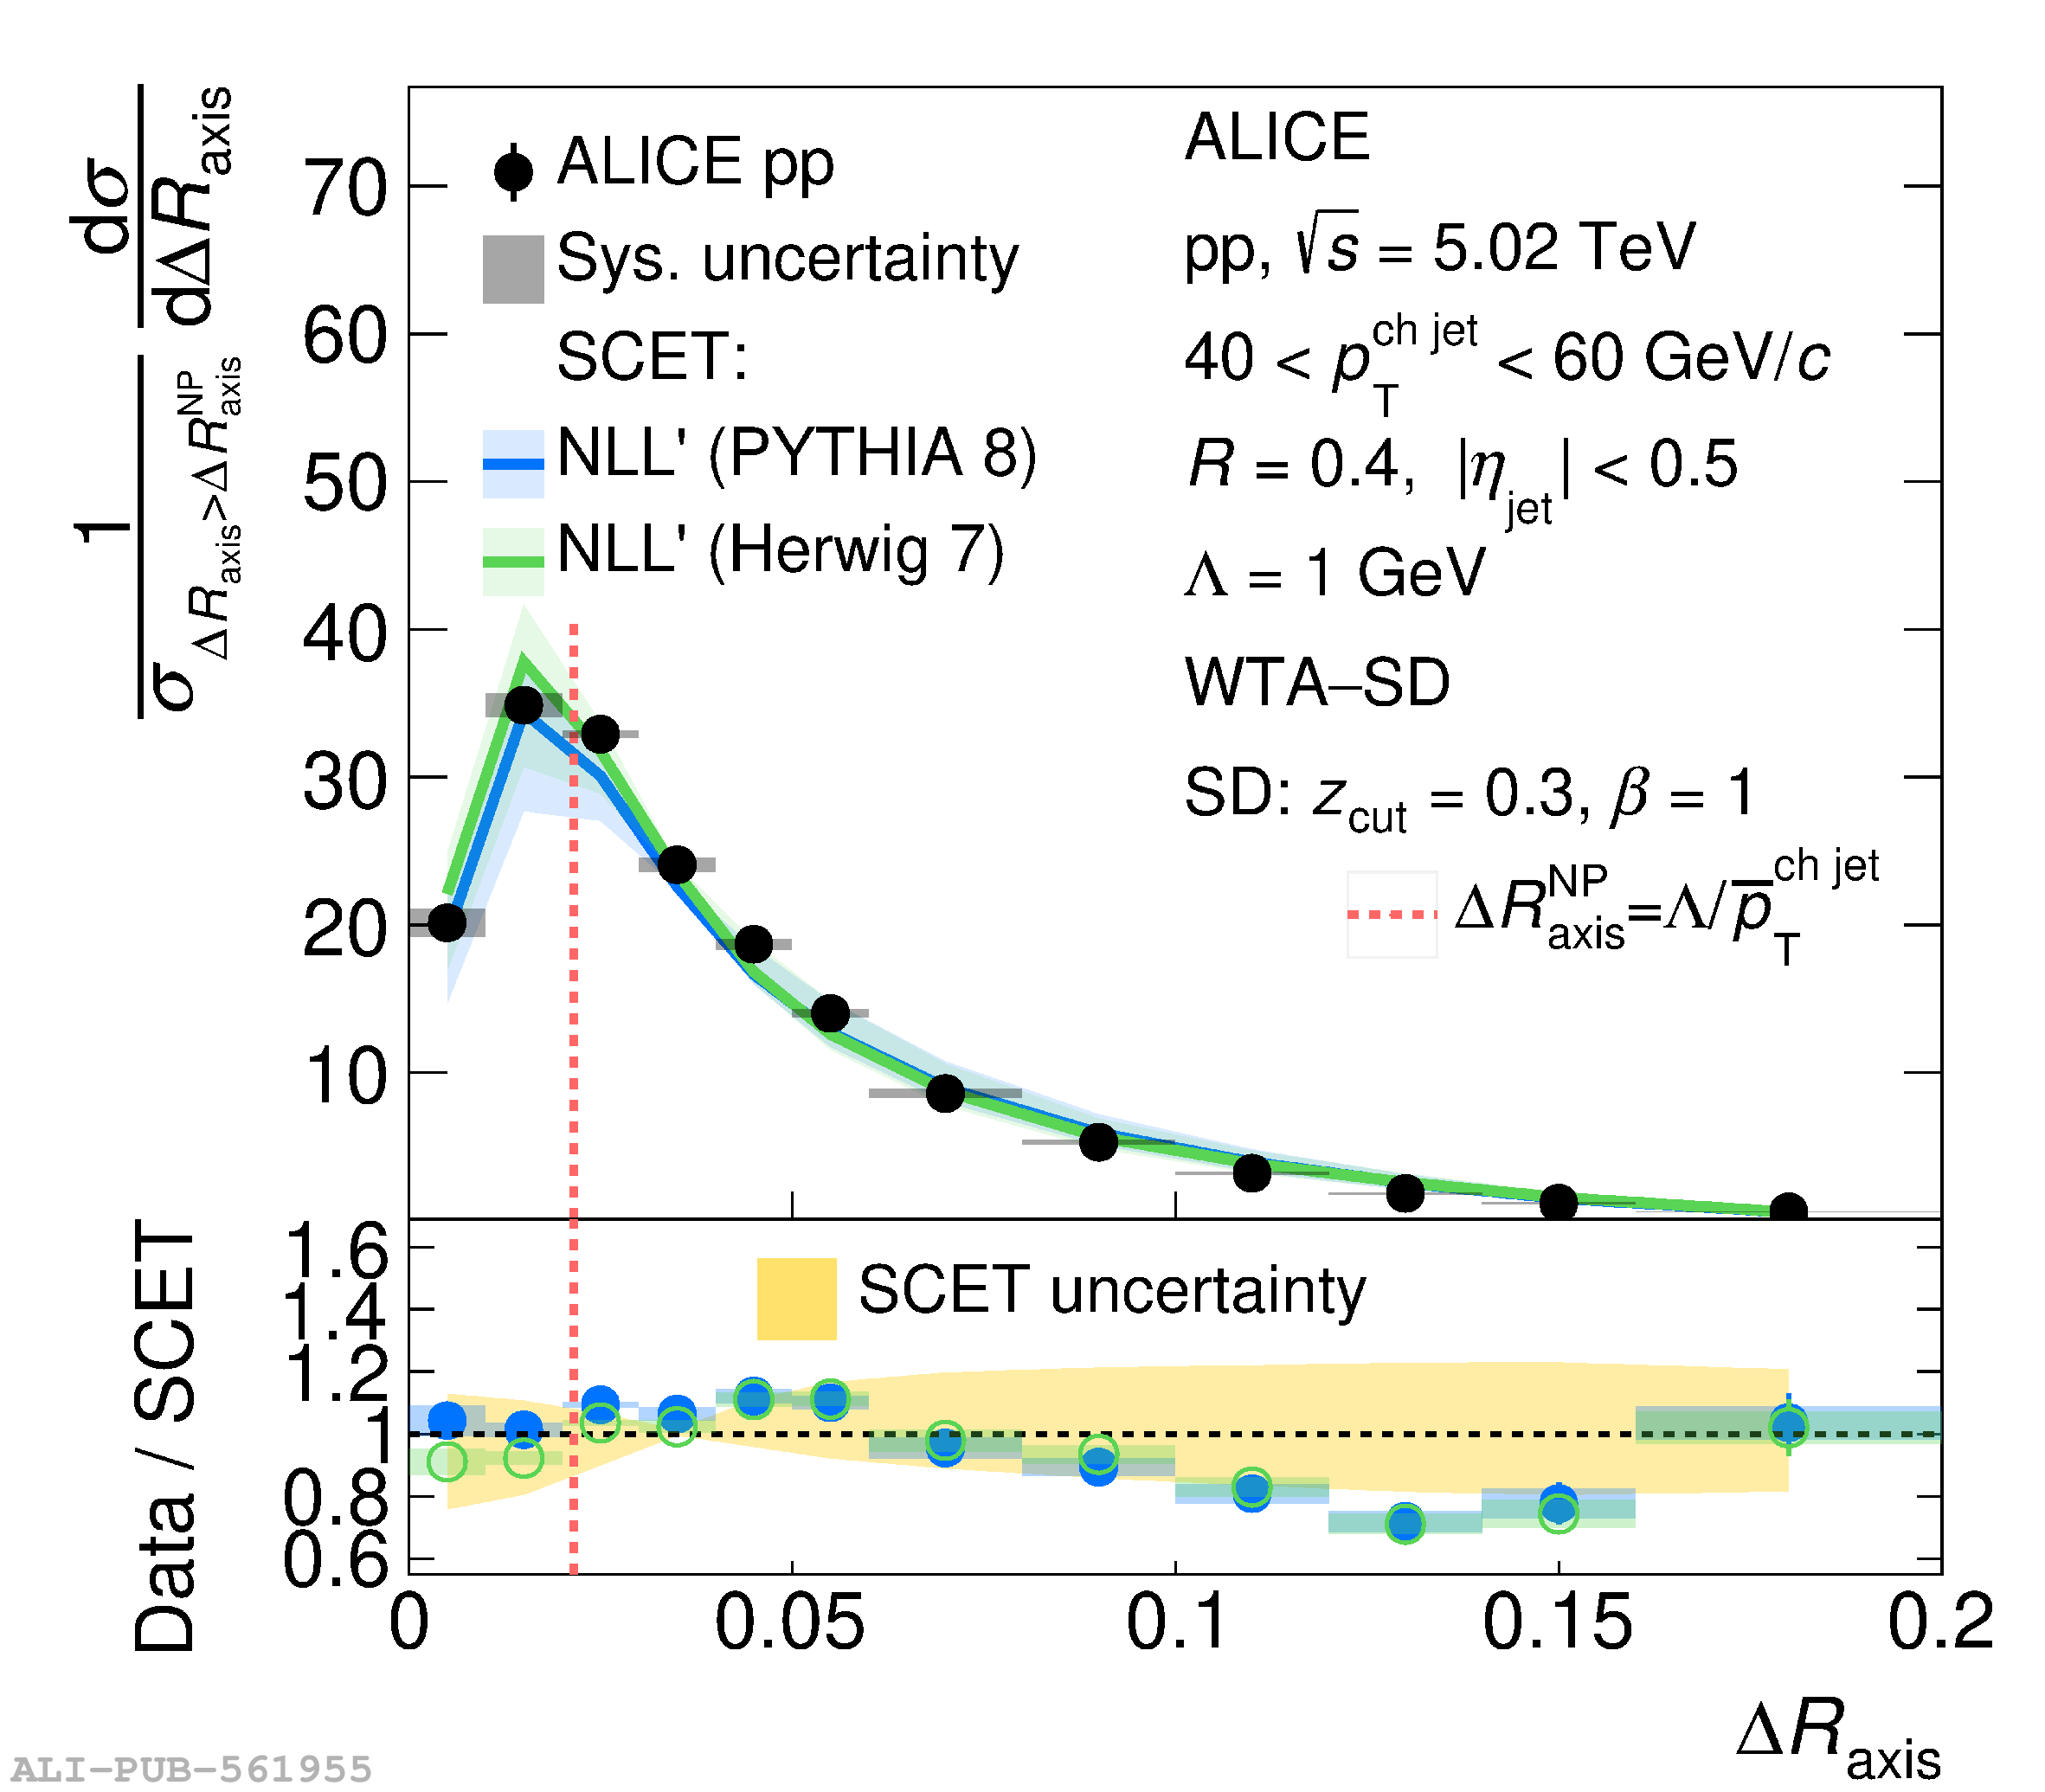
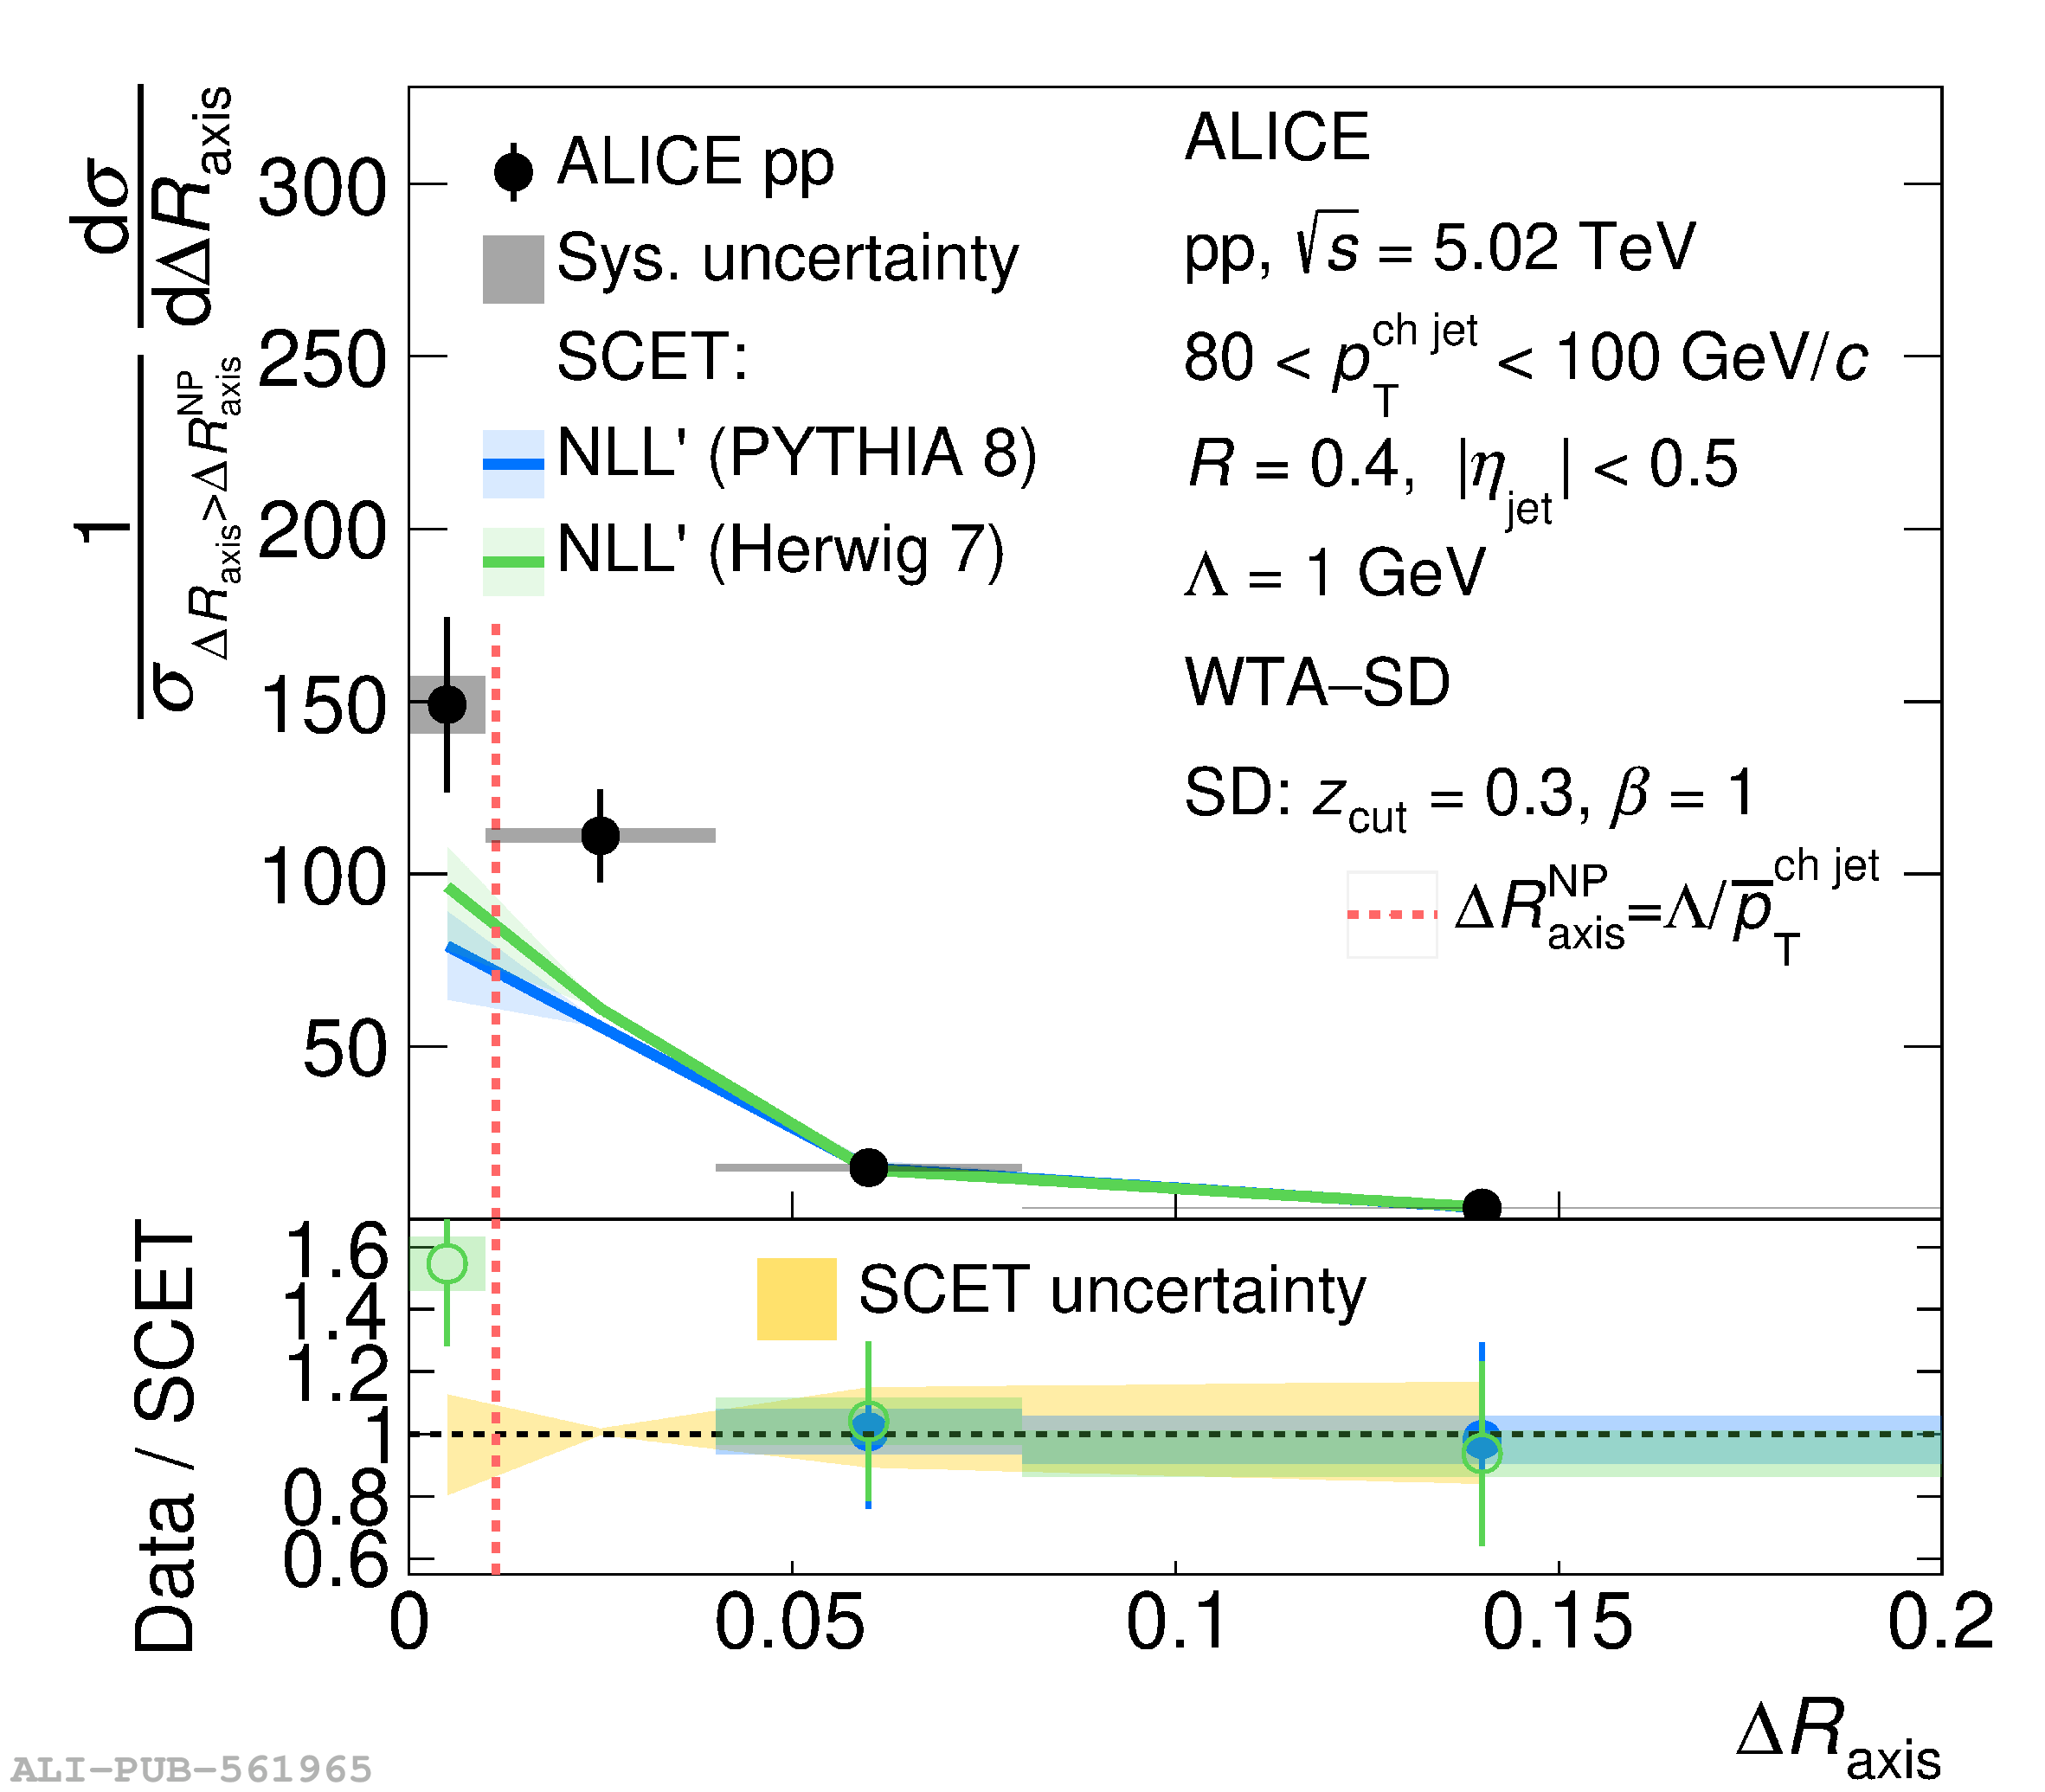
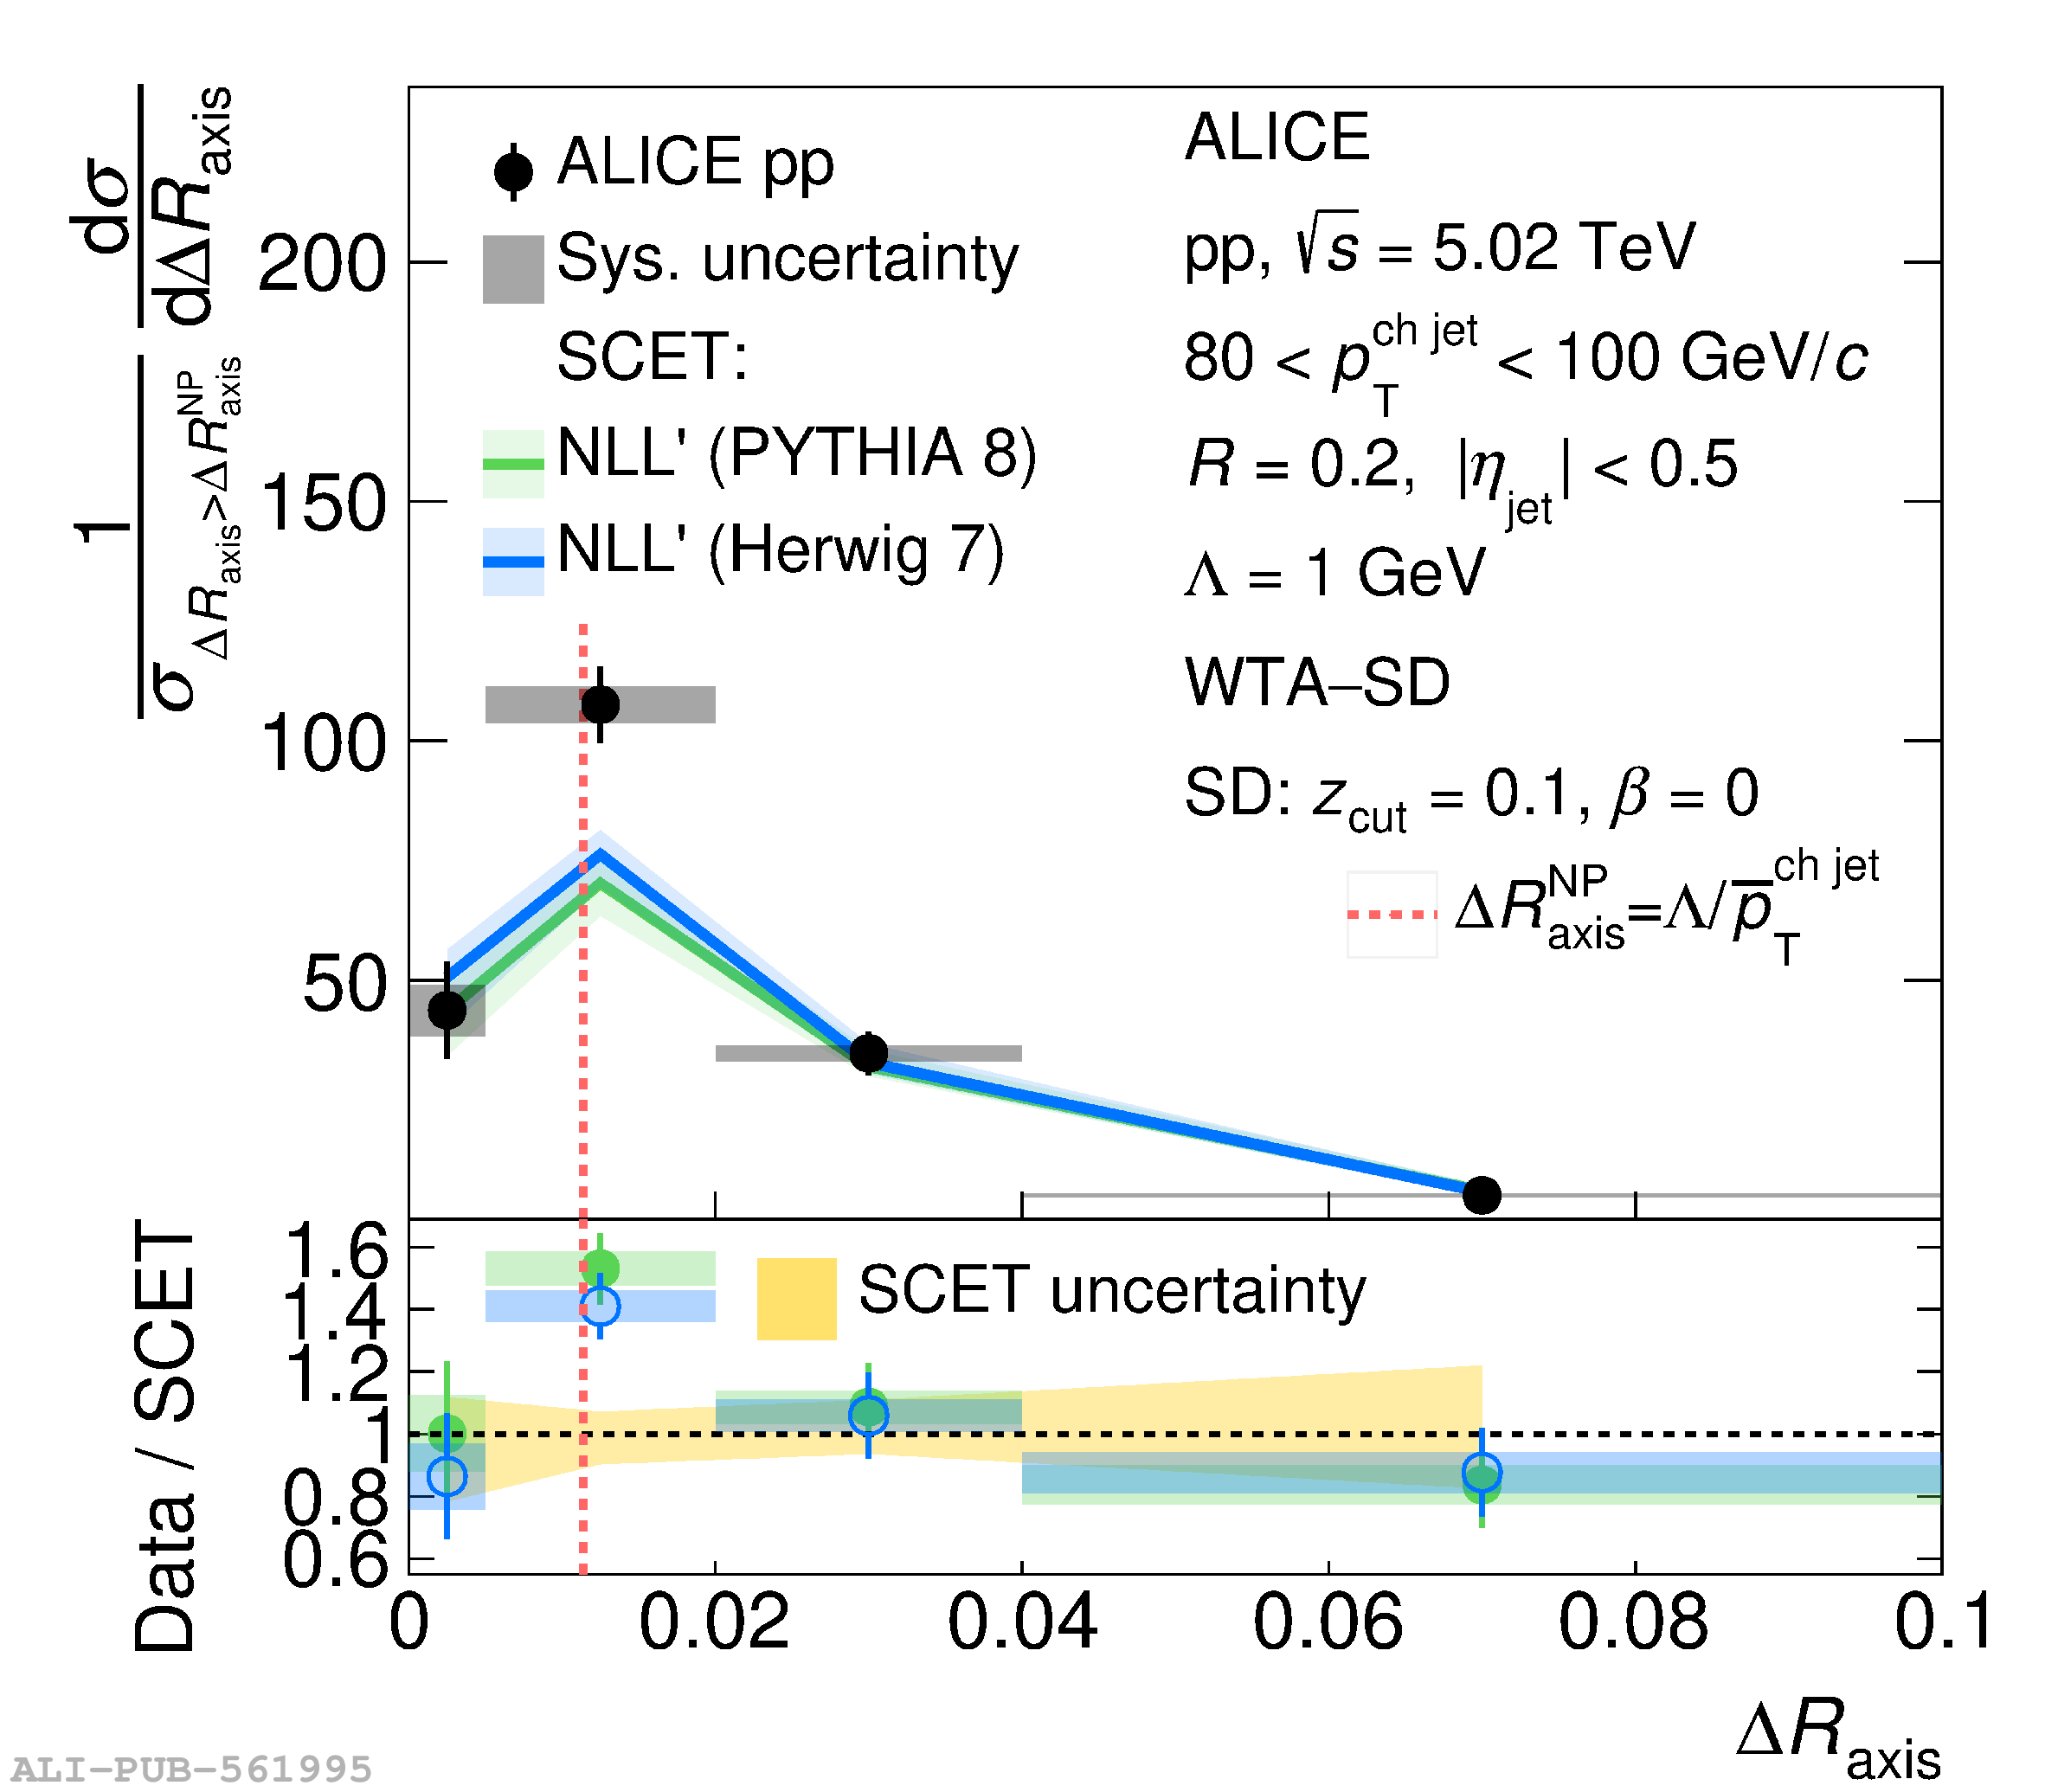
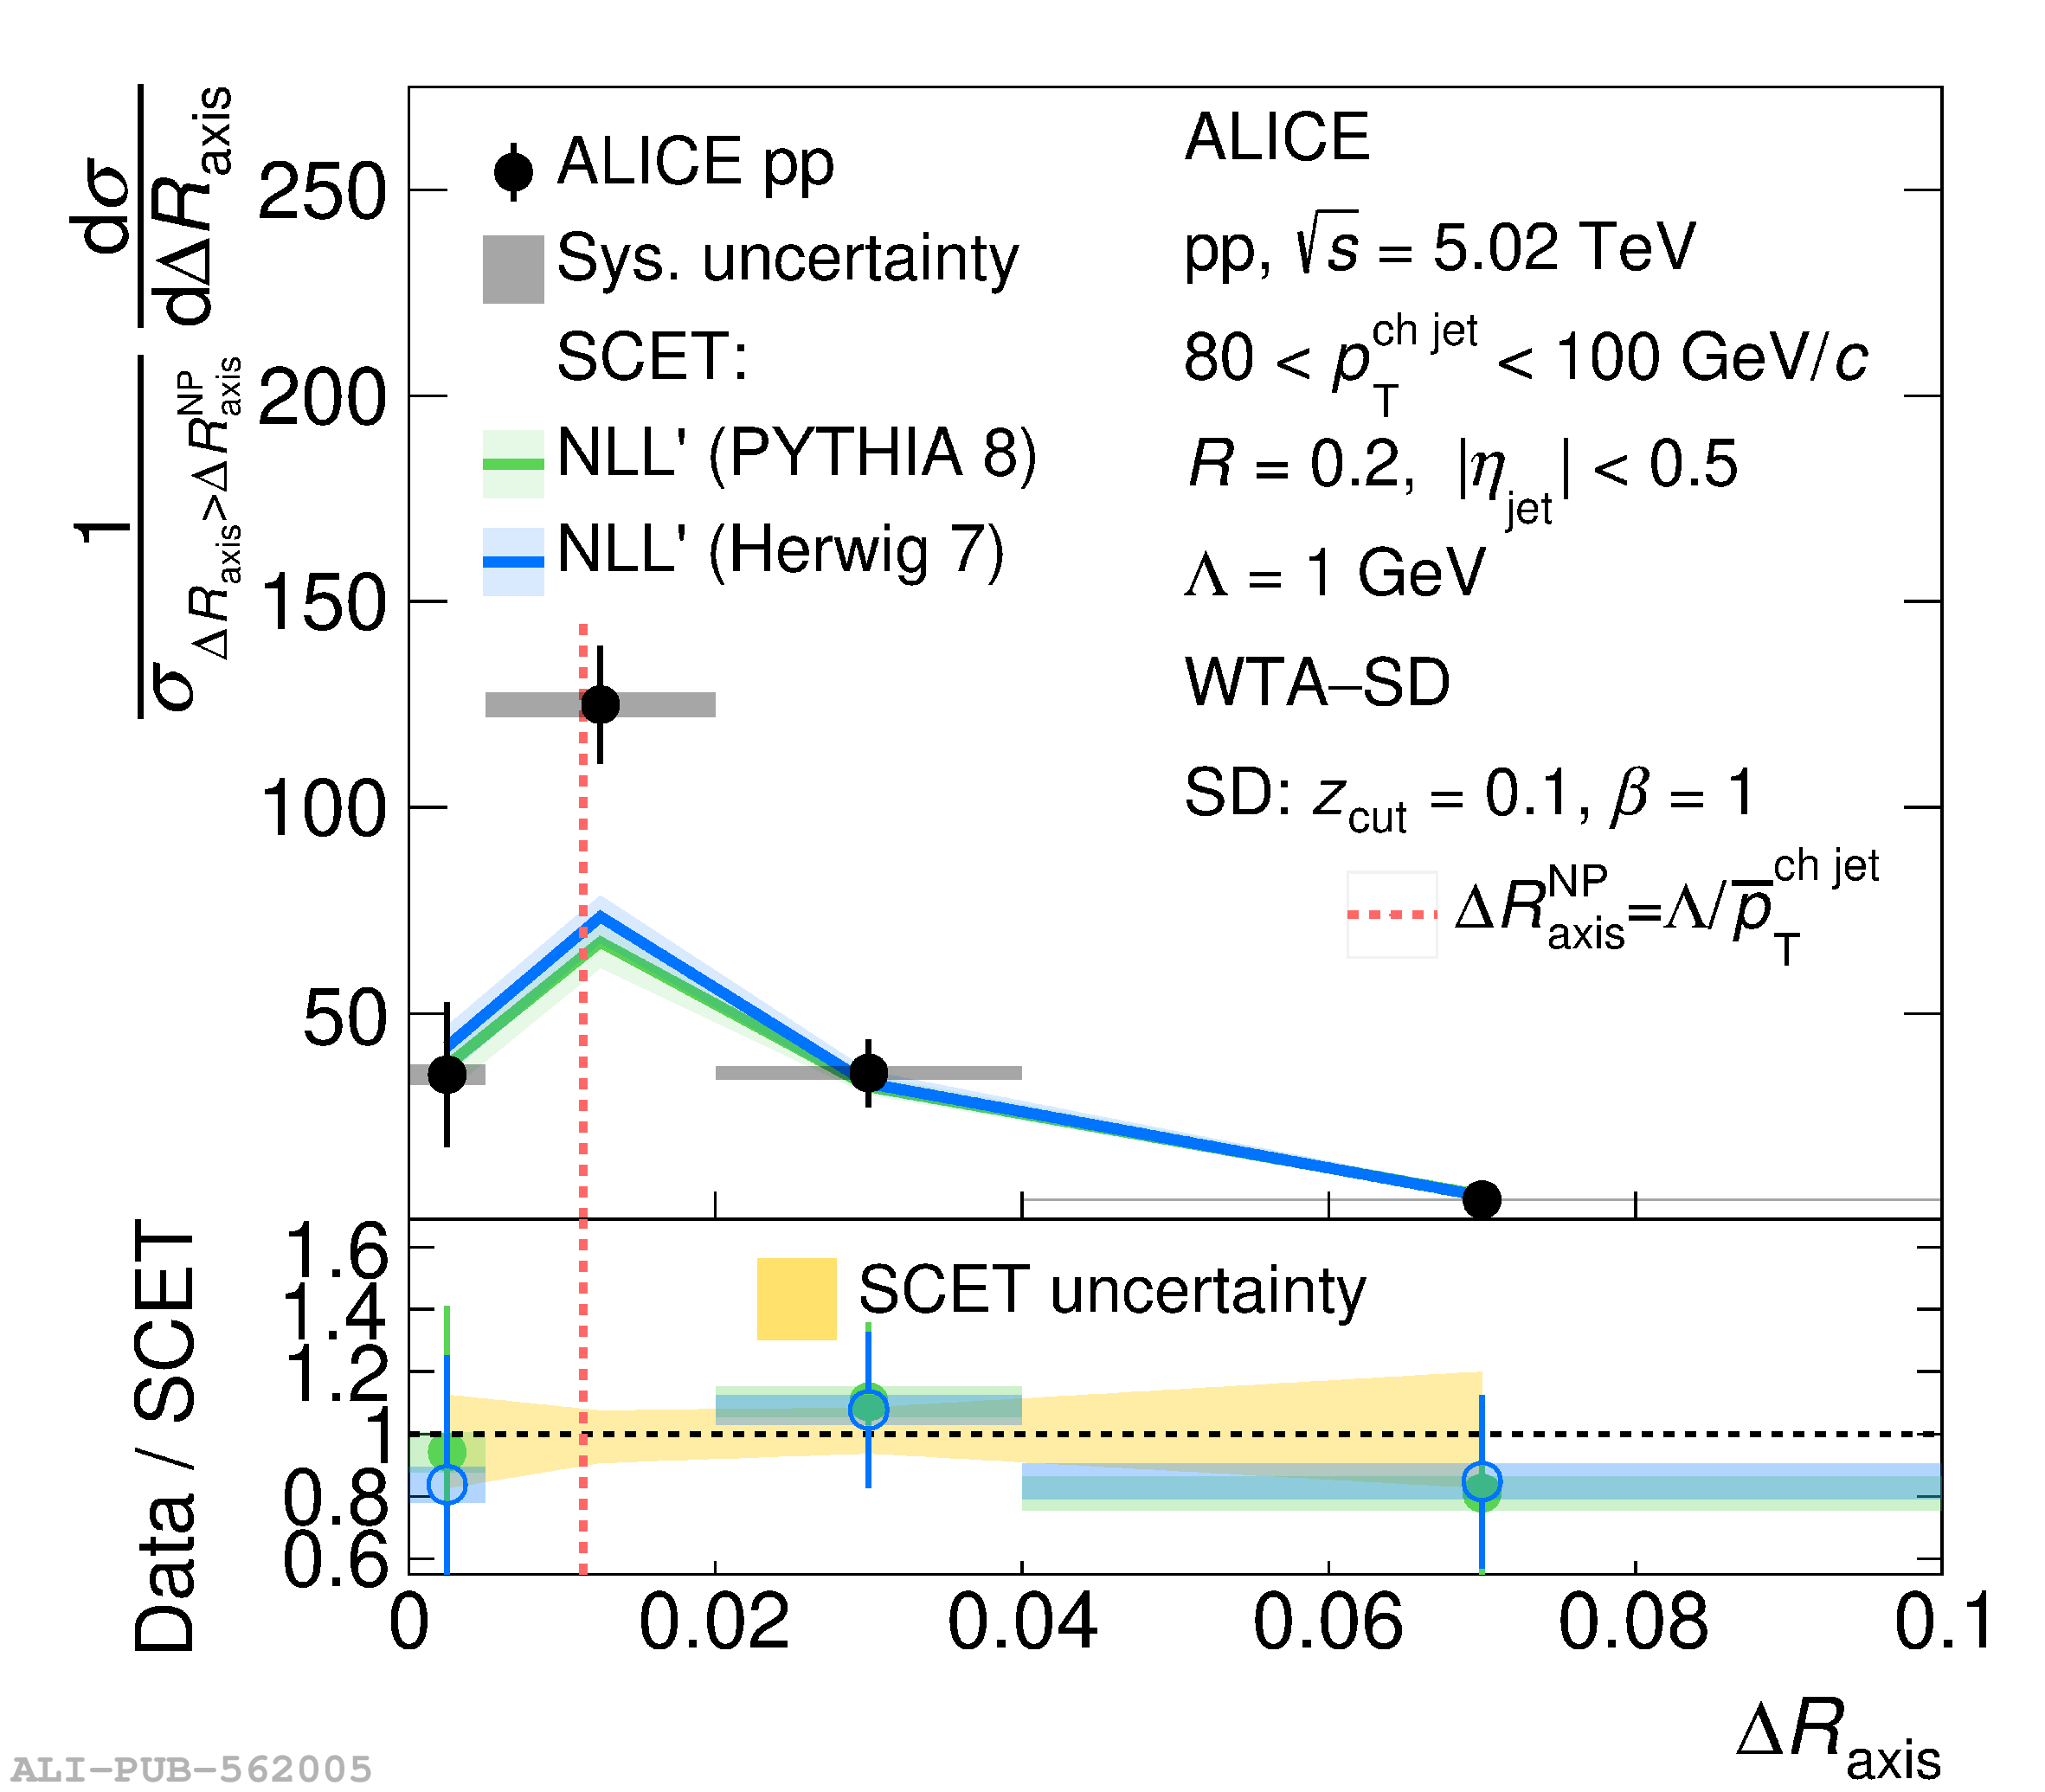
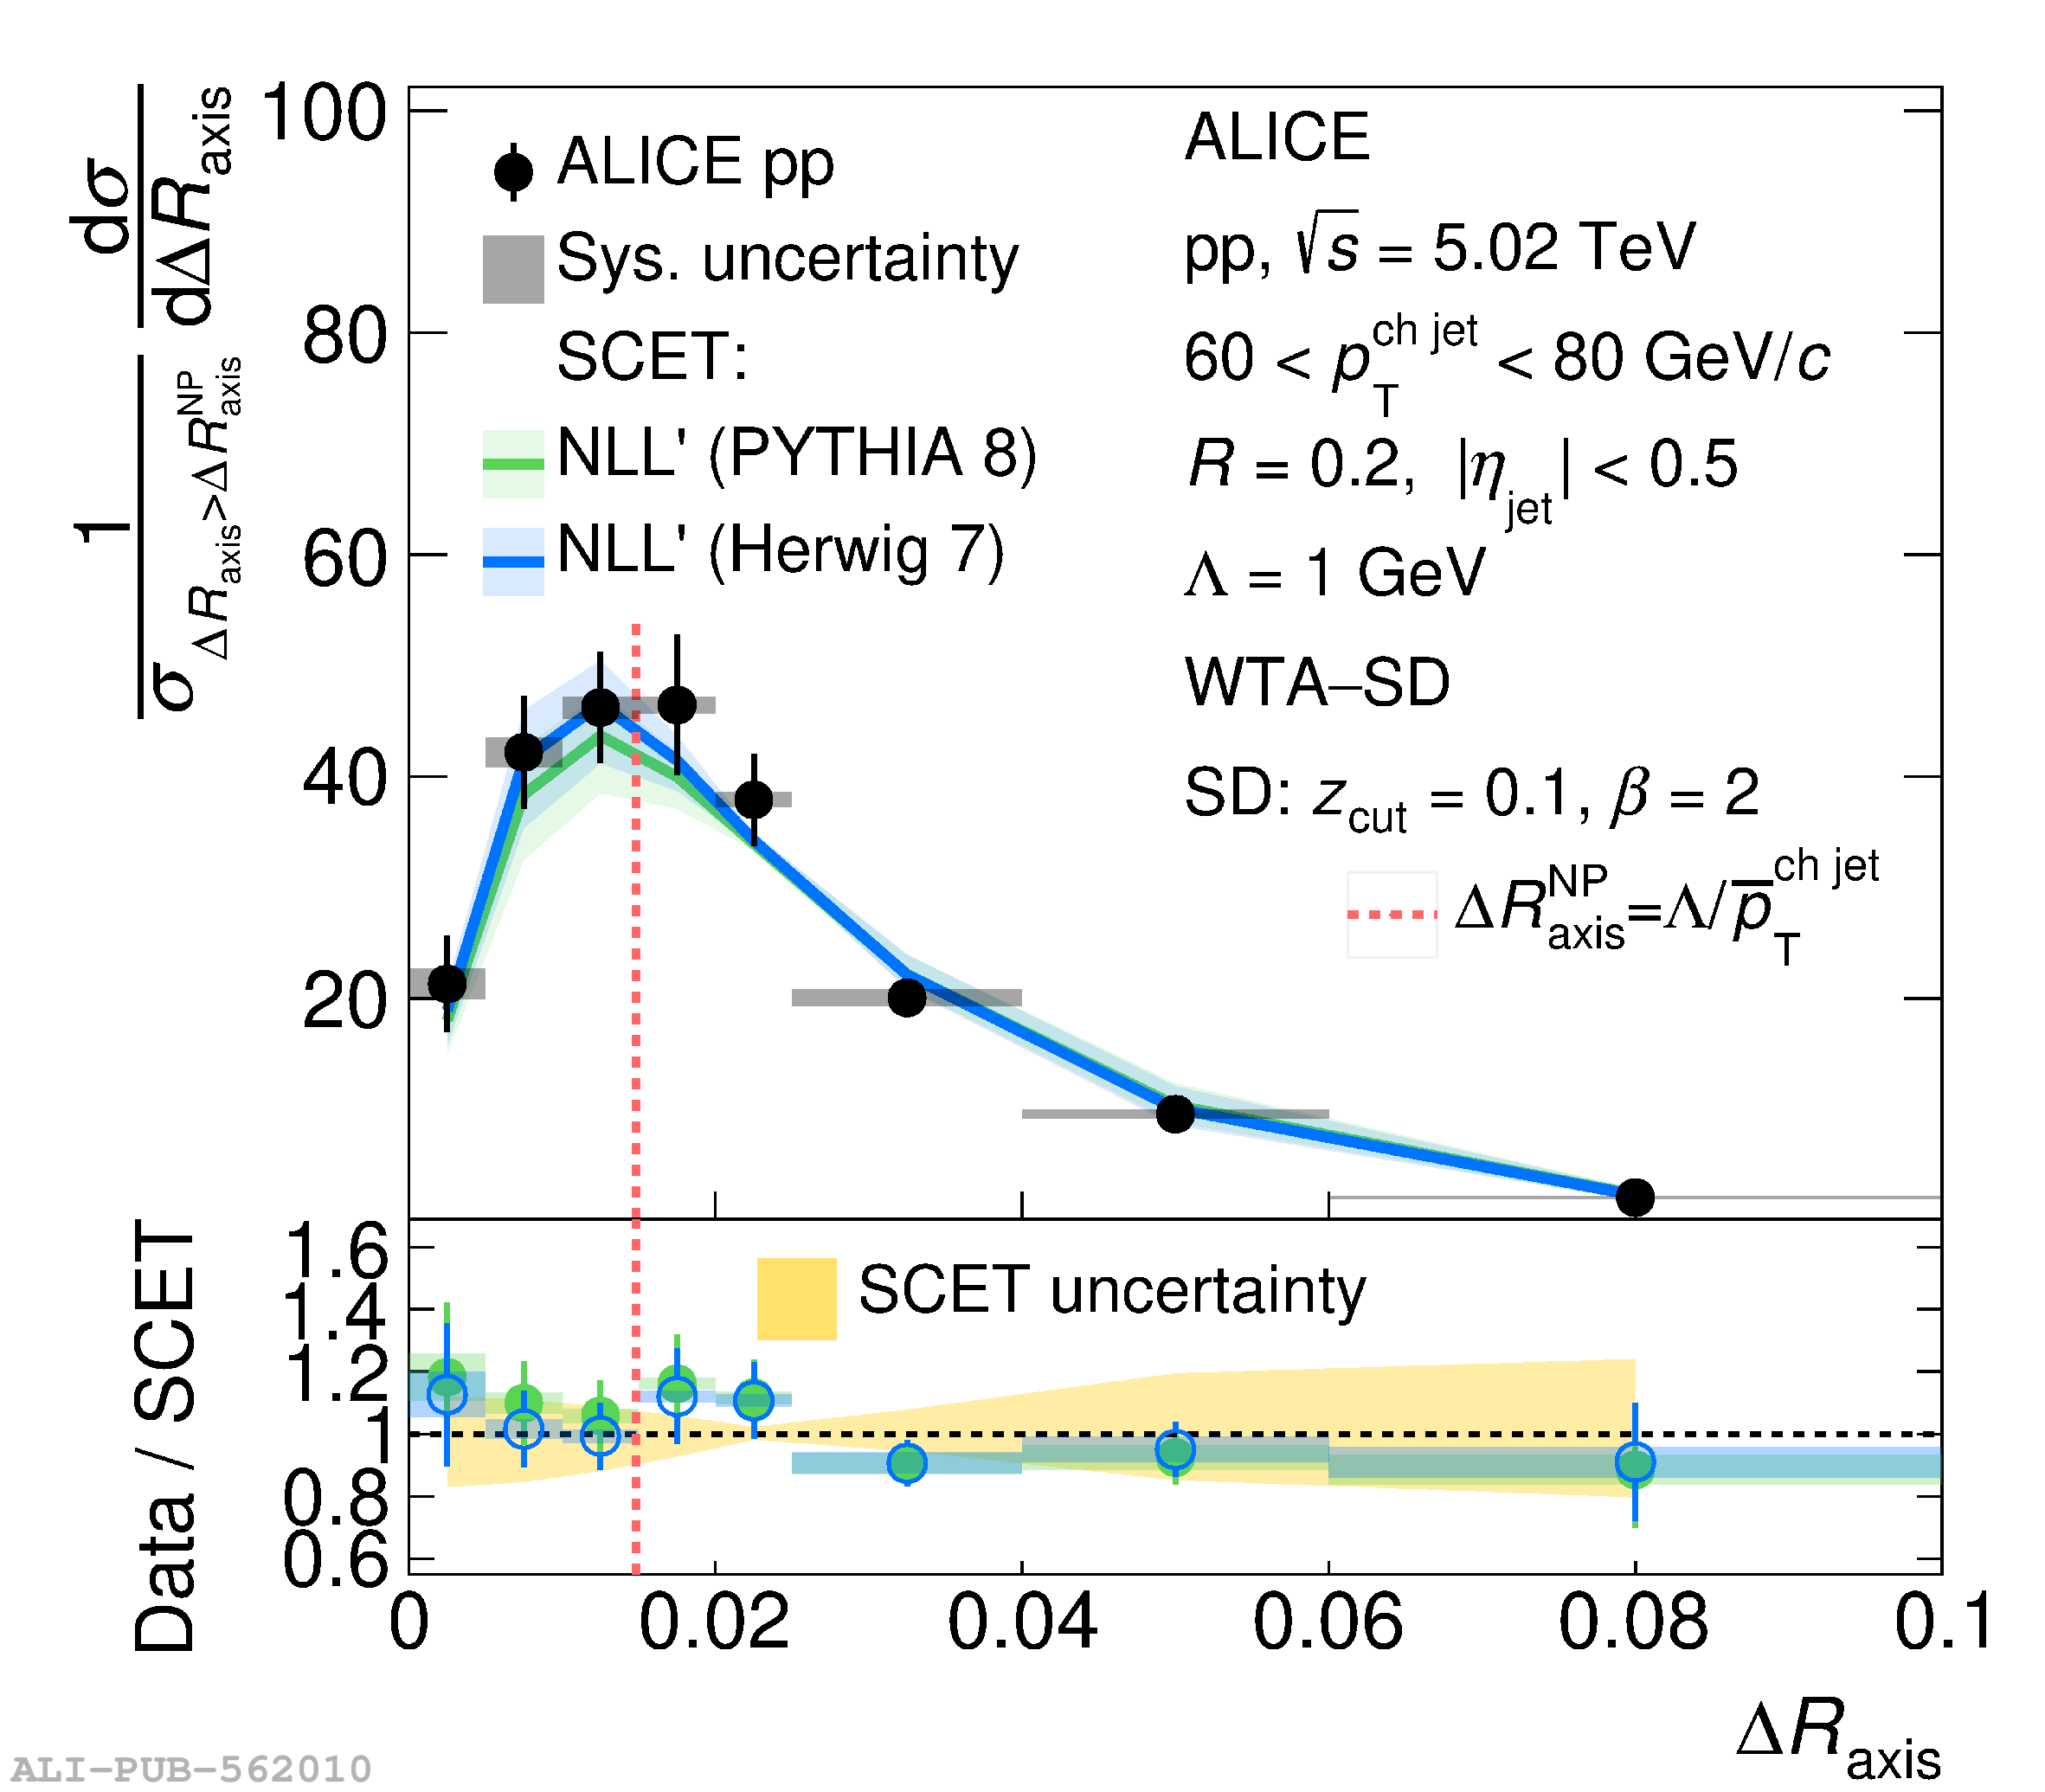
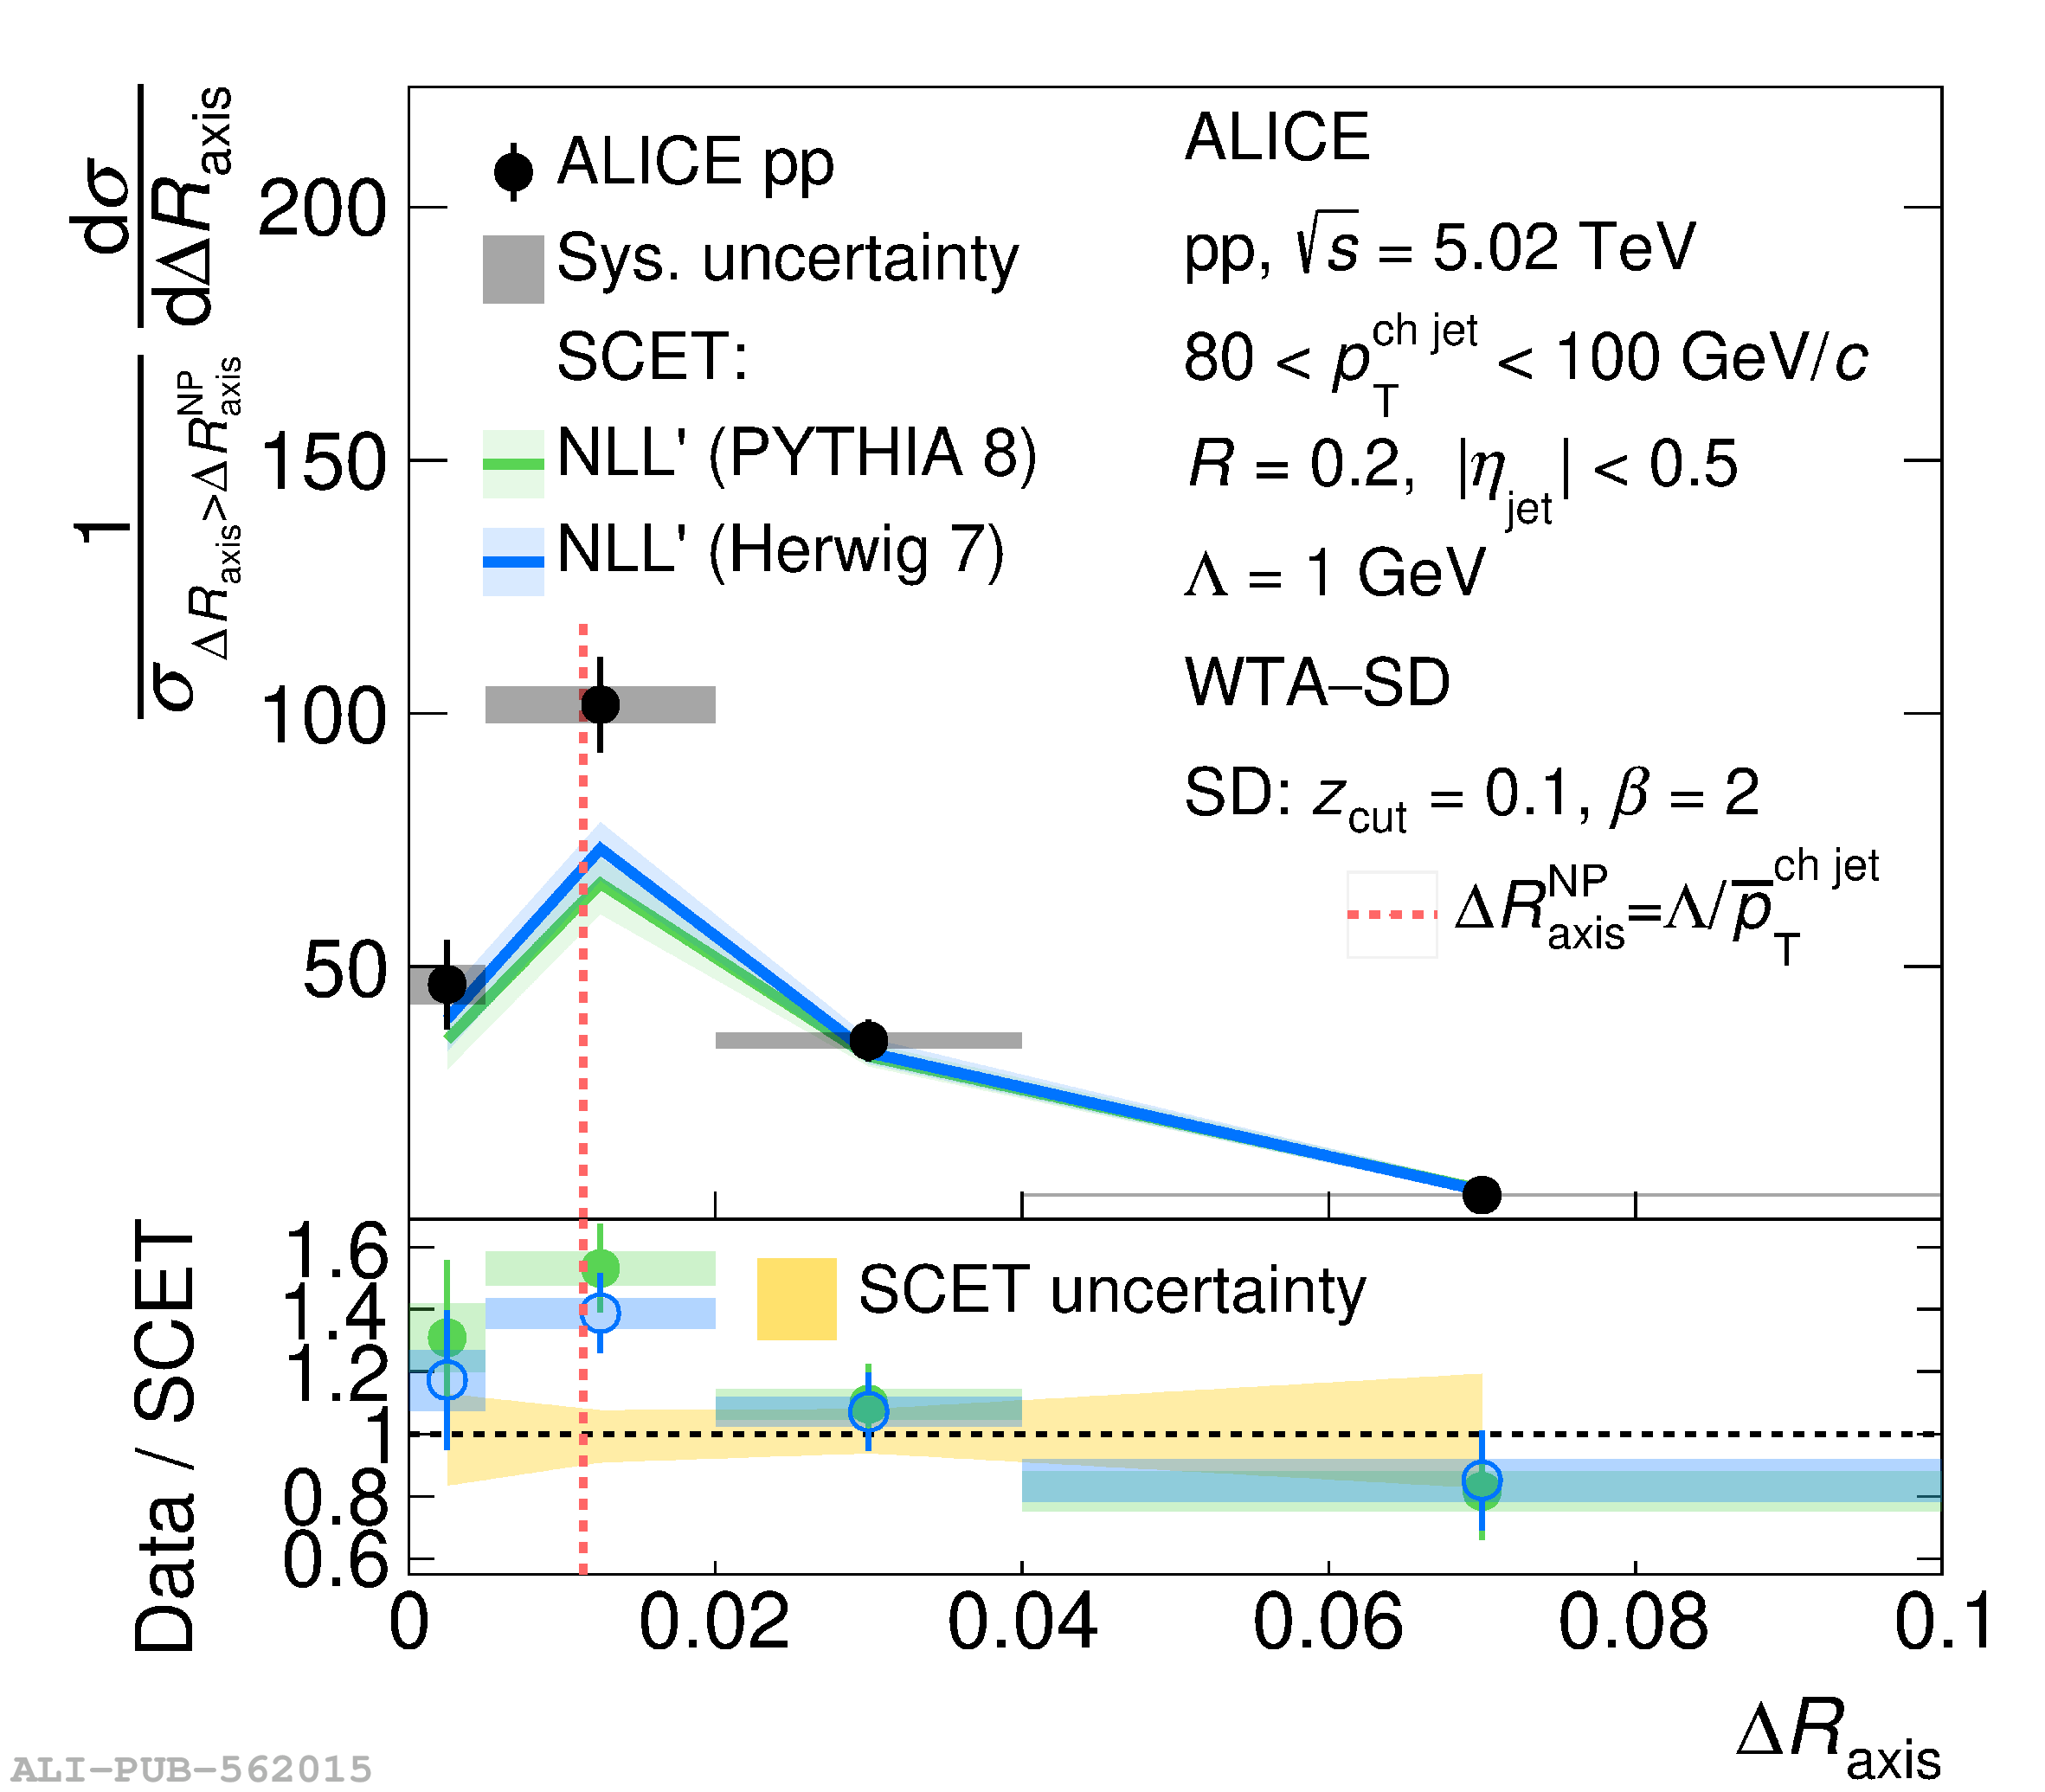
Figure 5
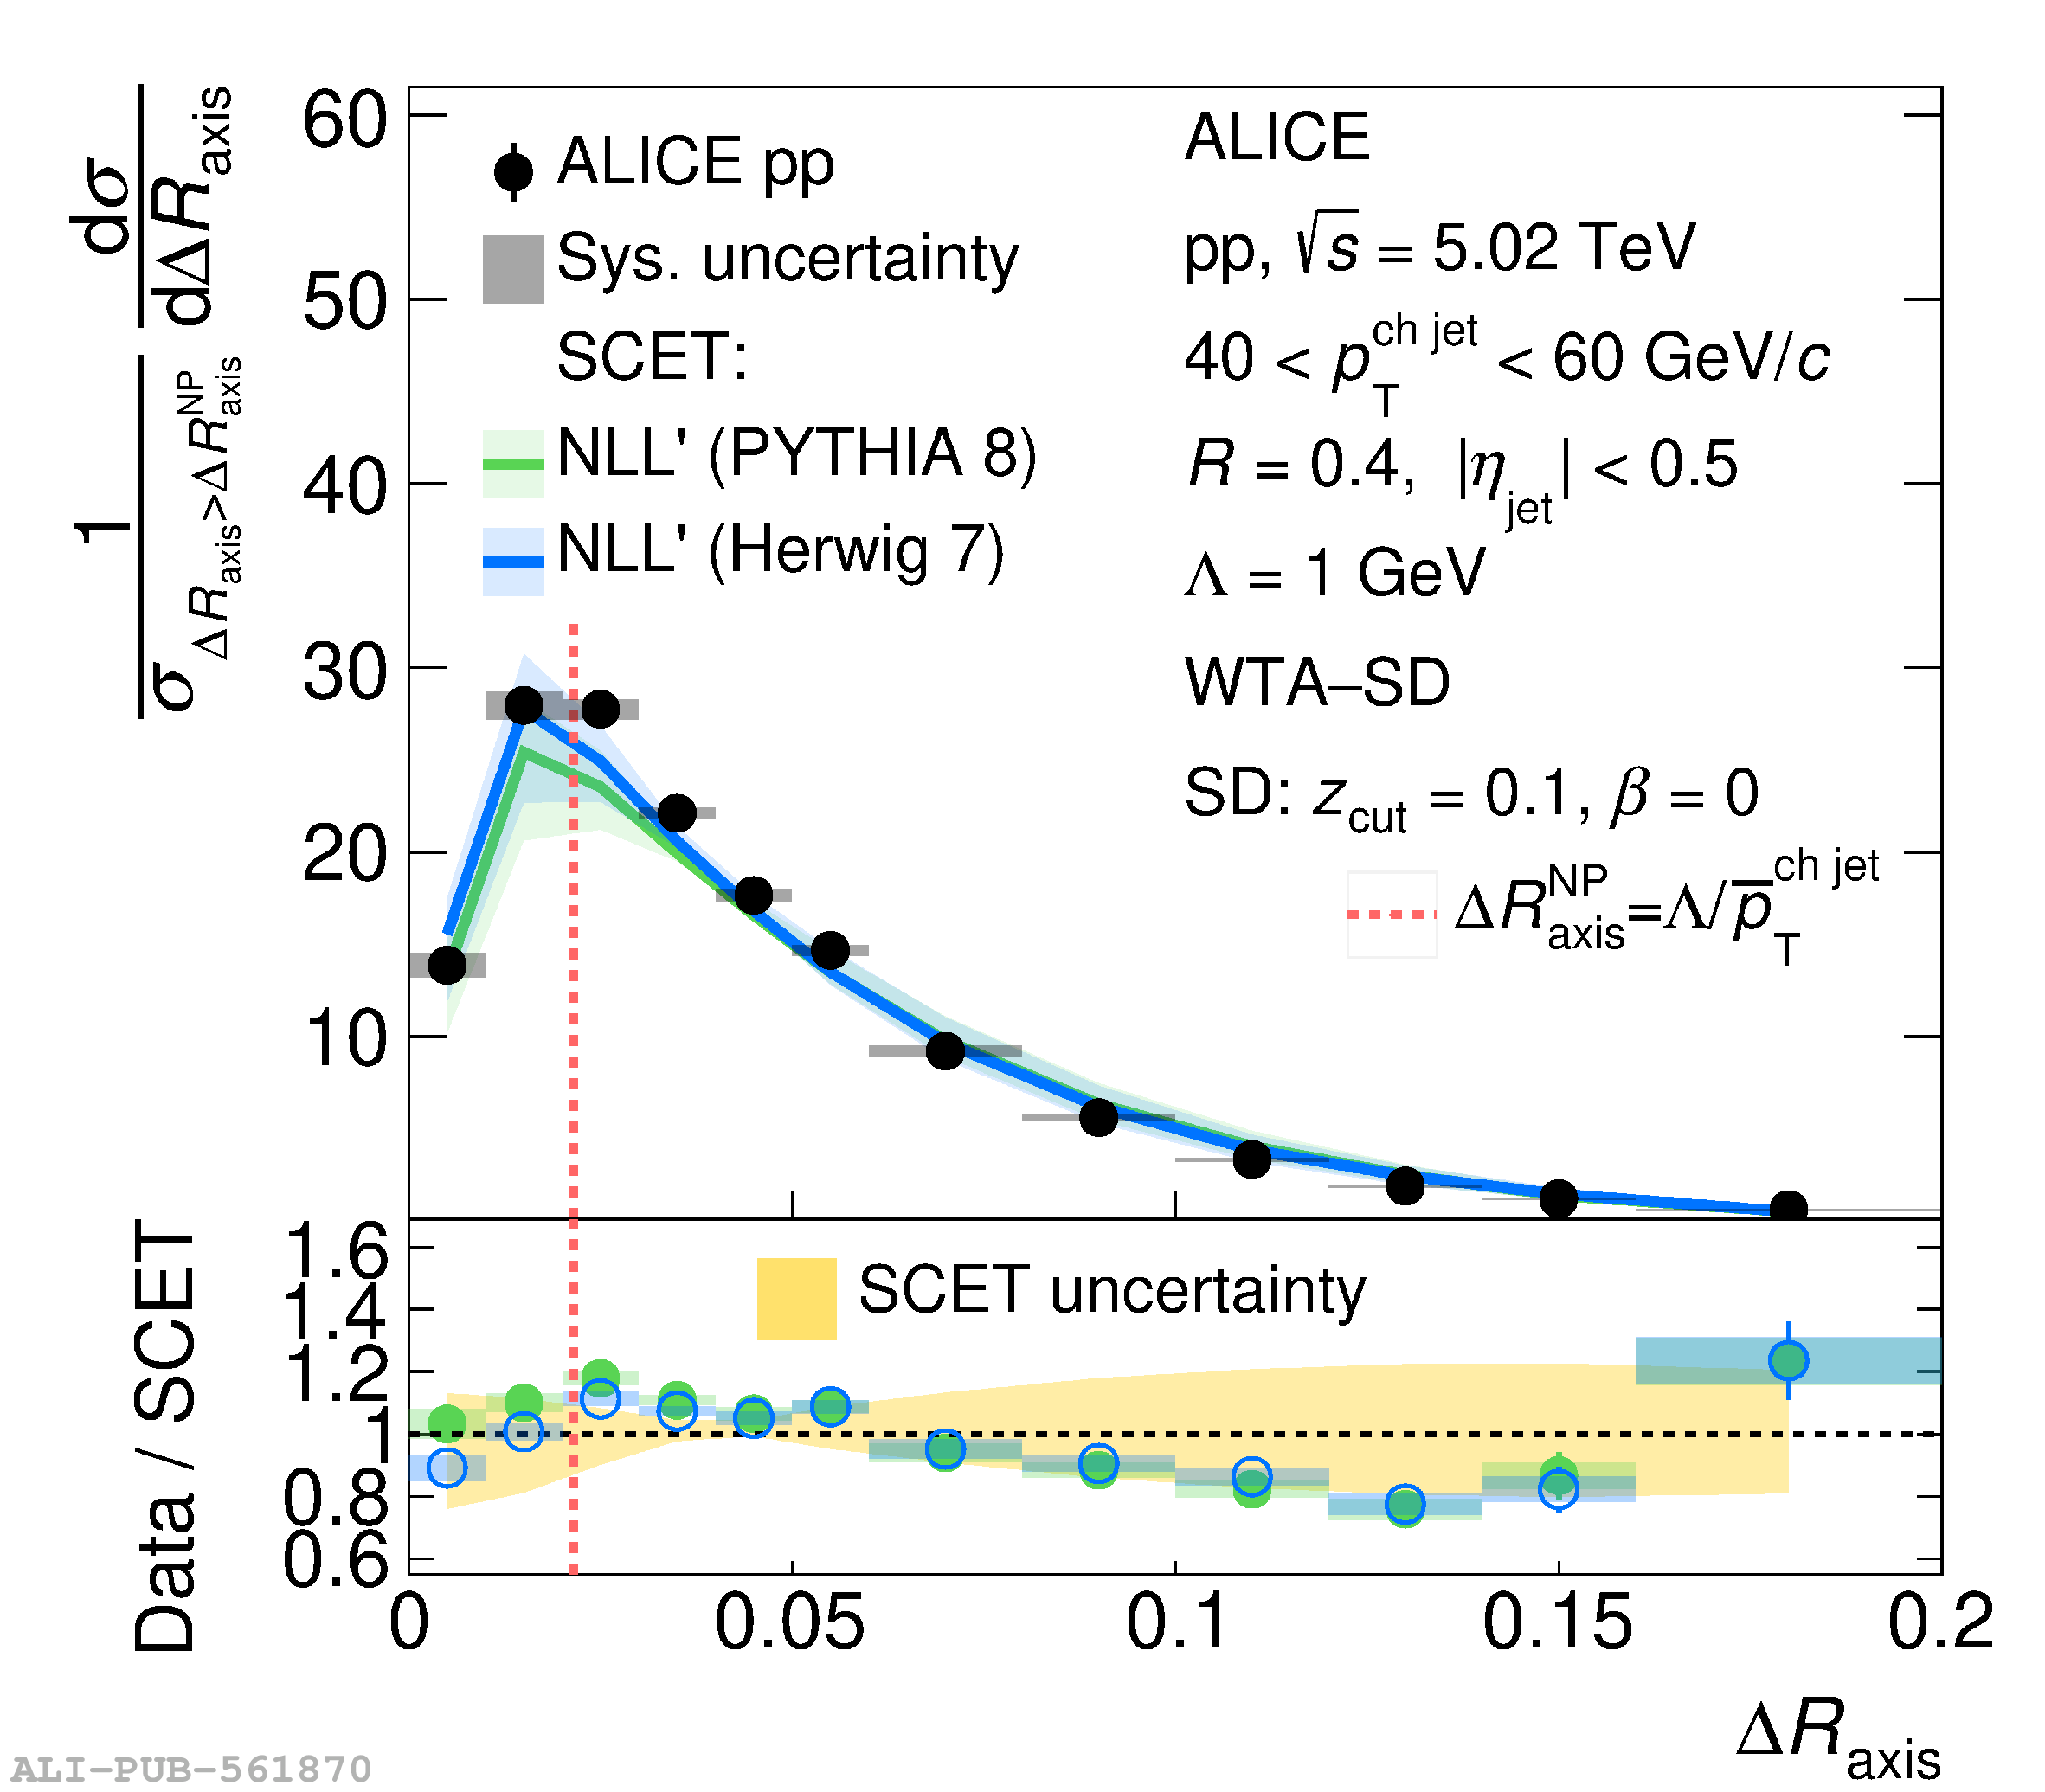
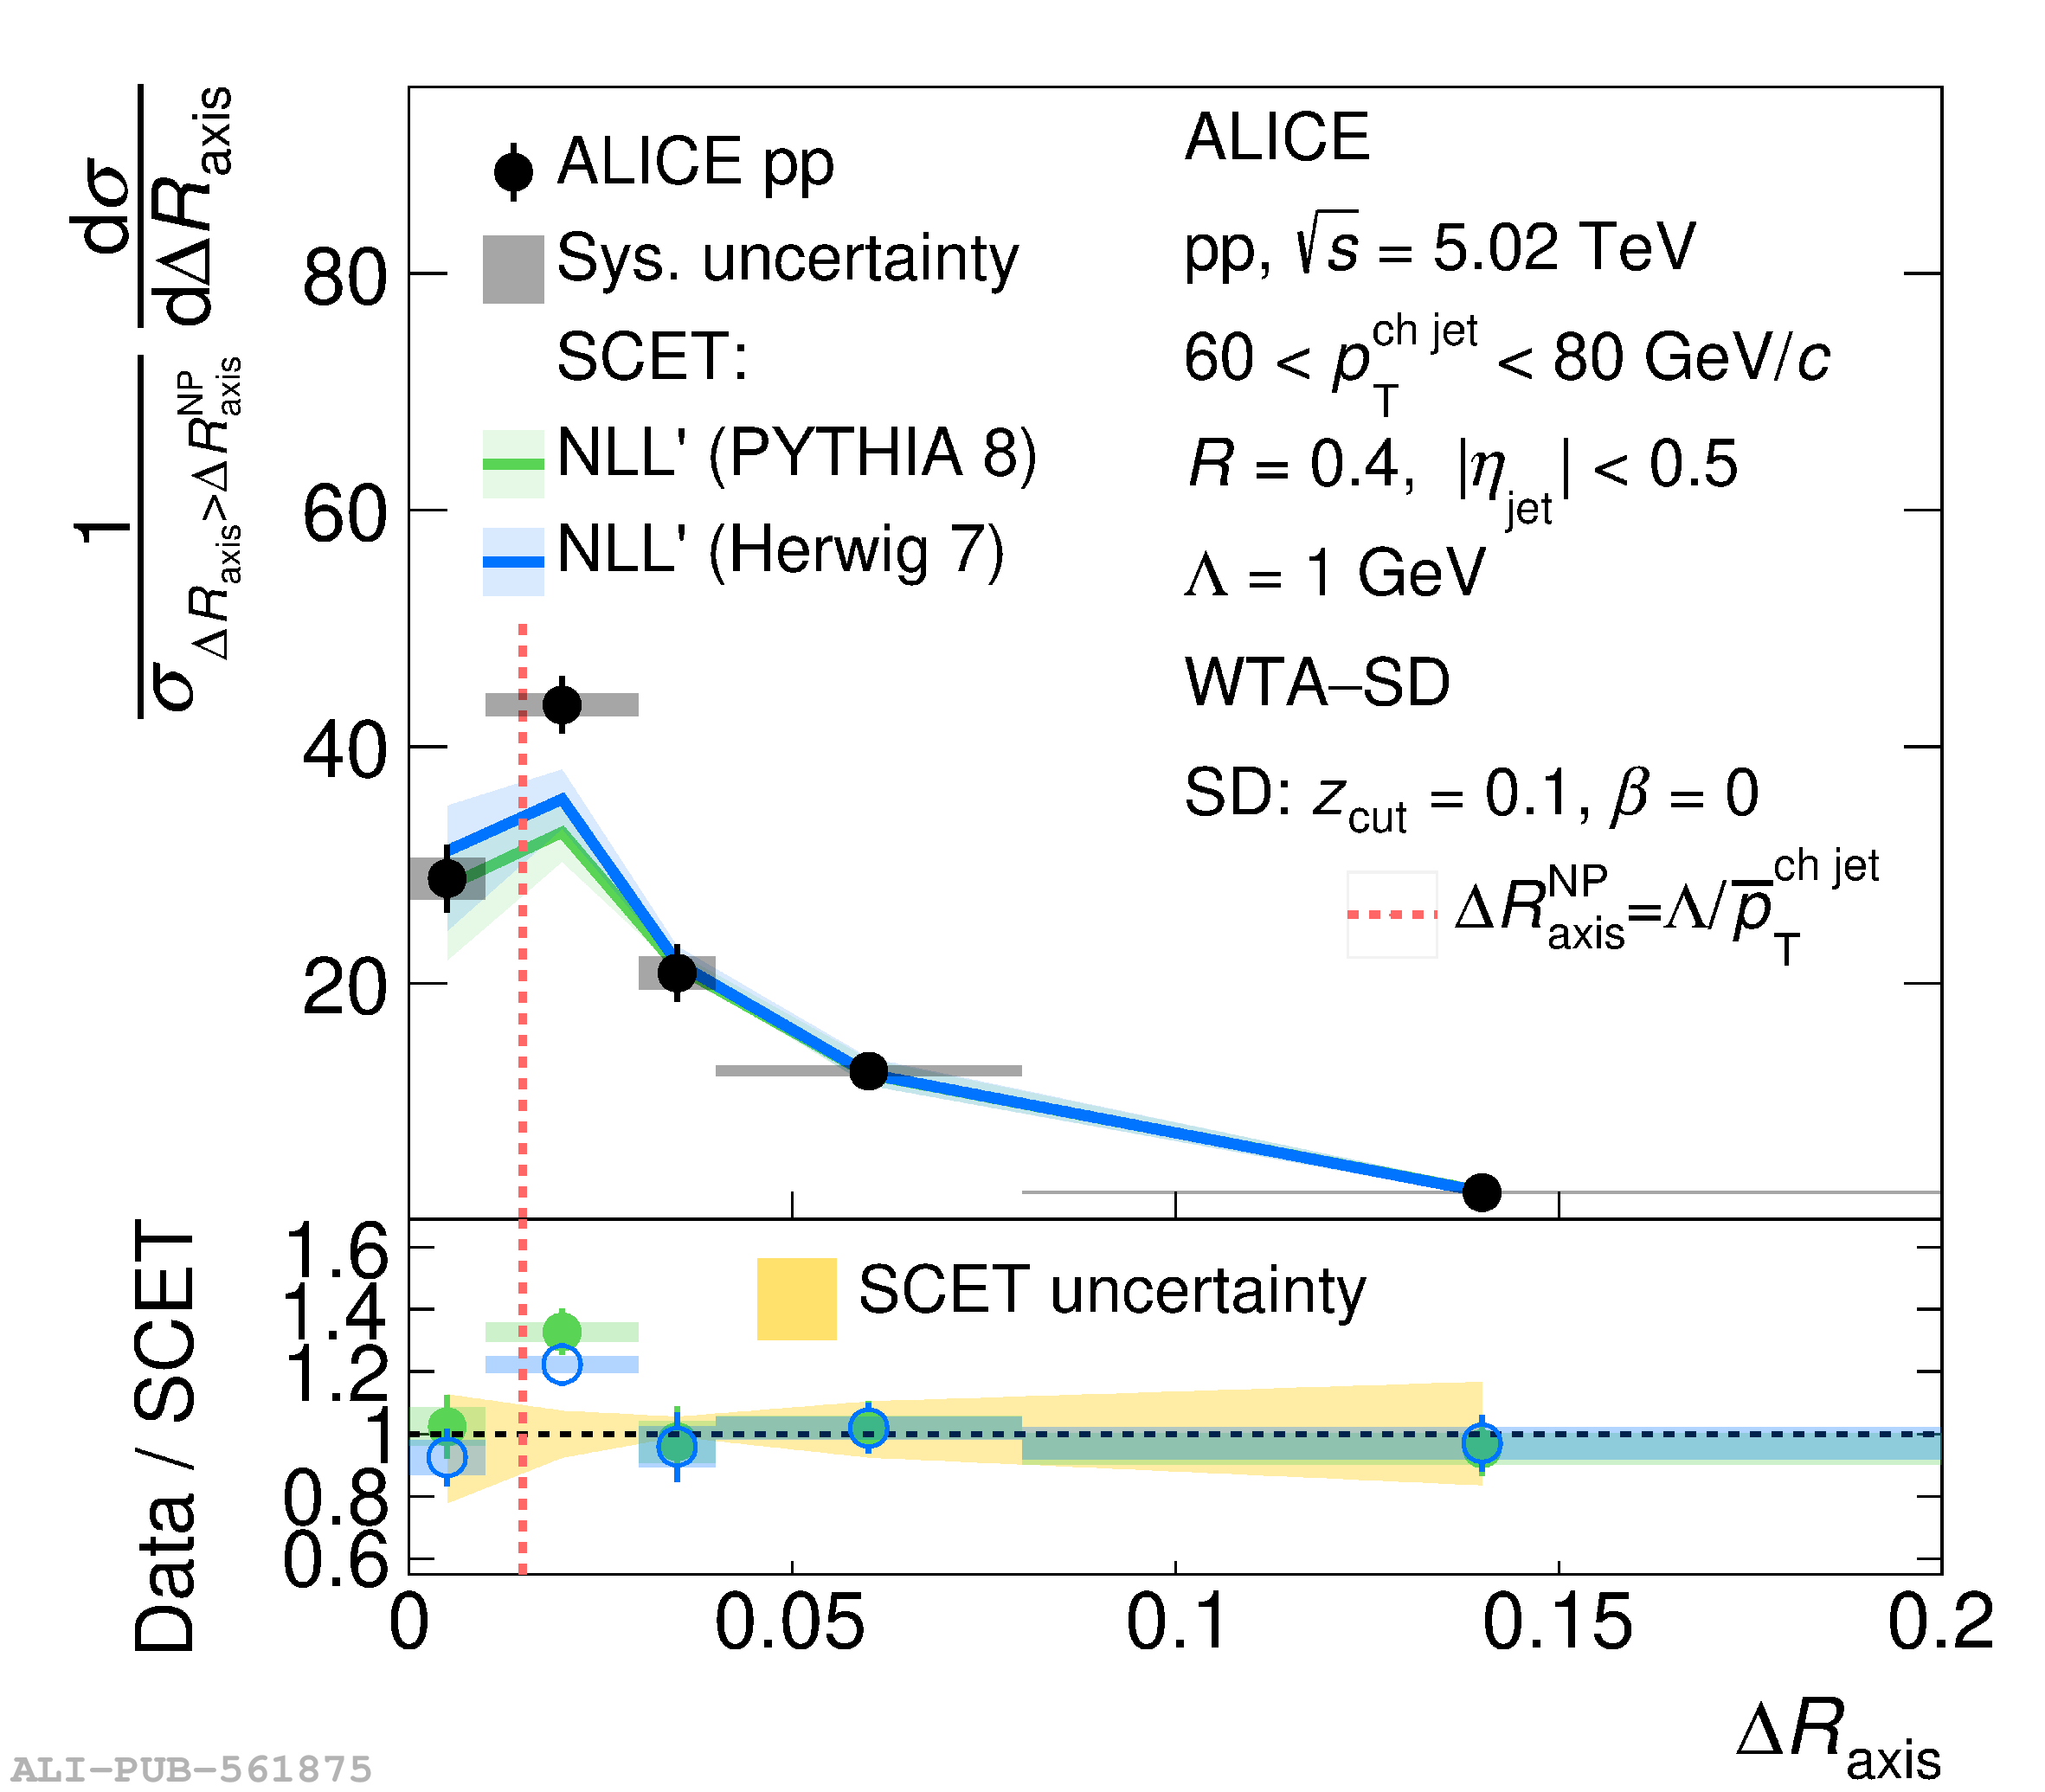
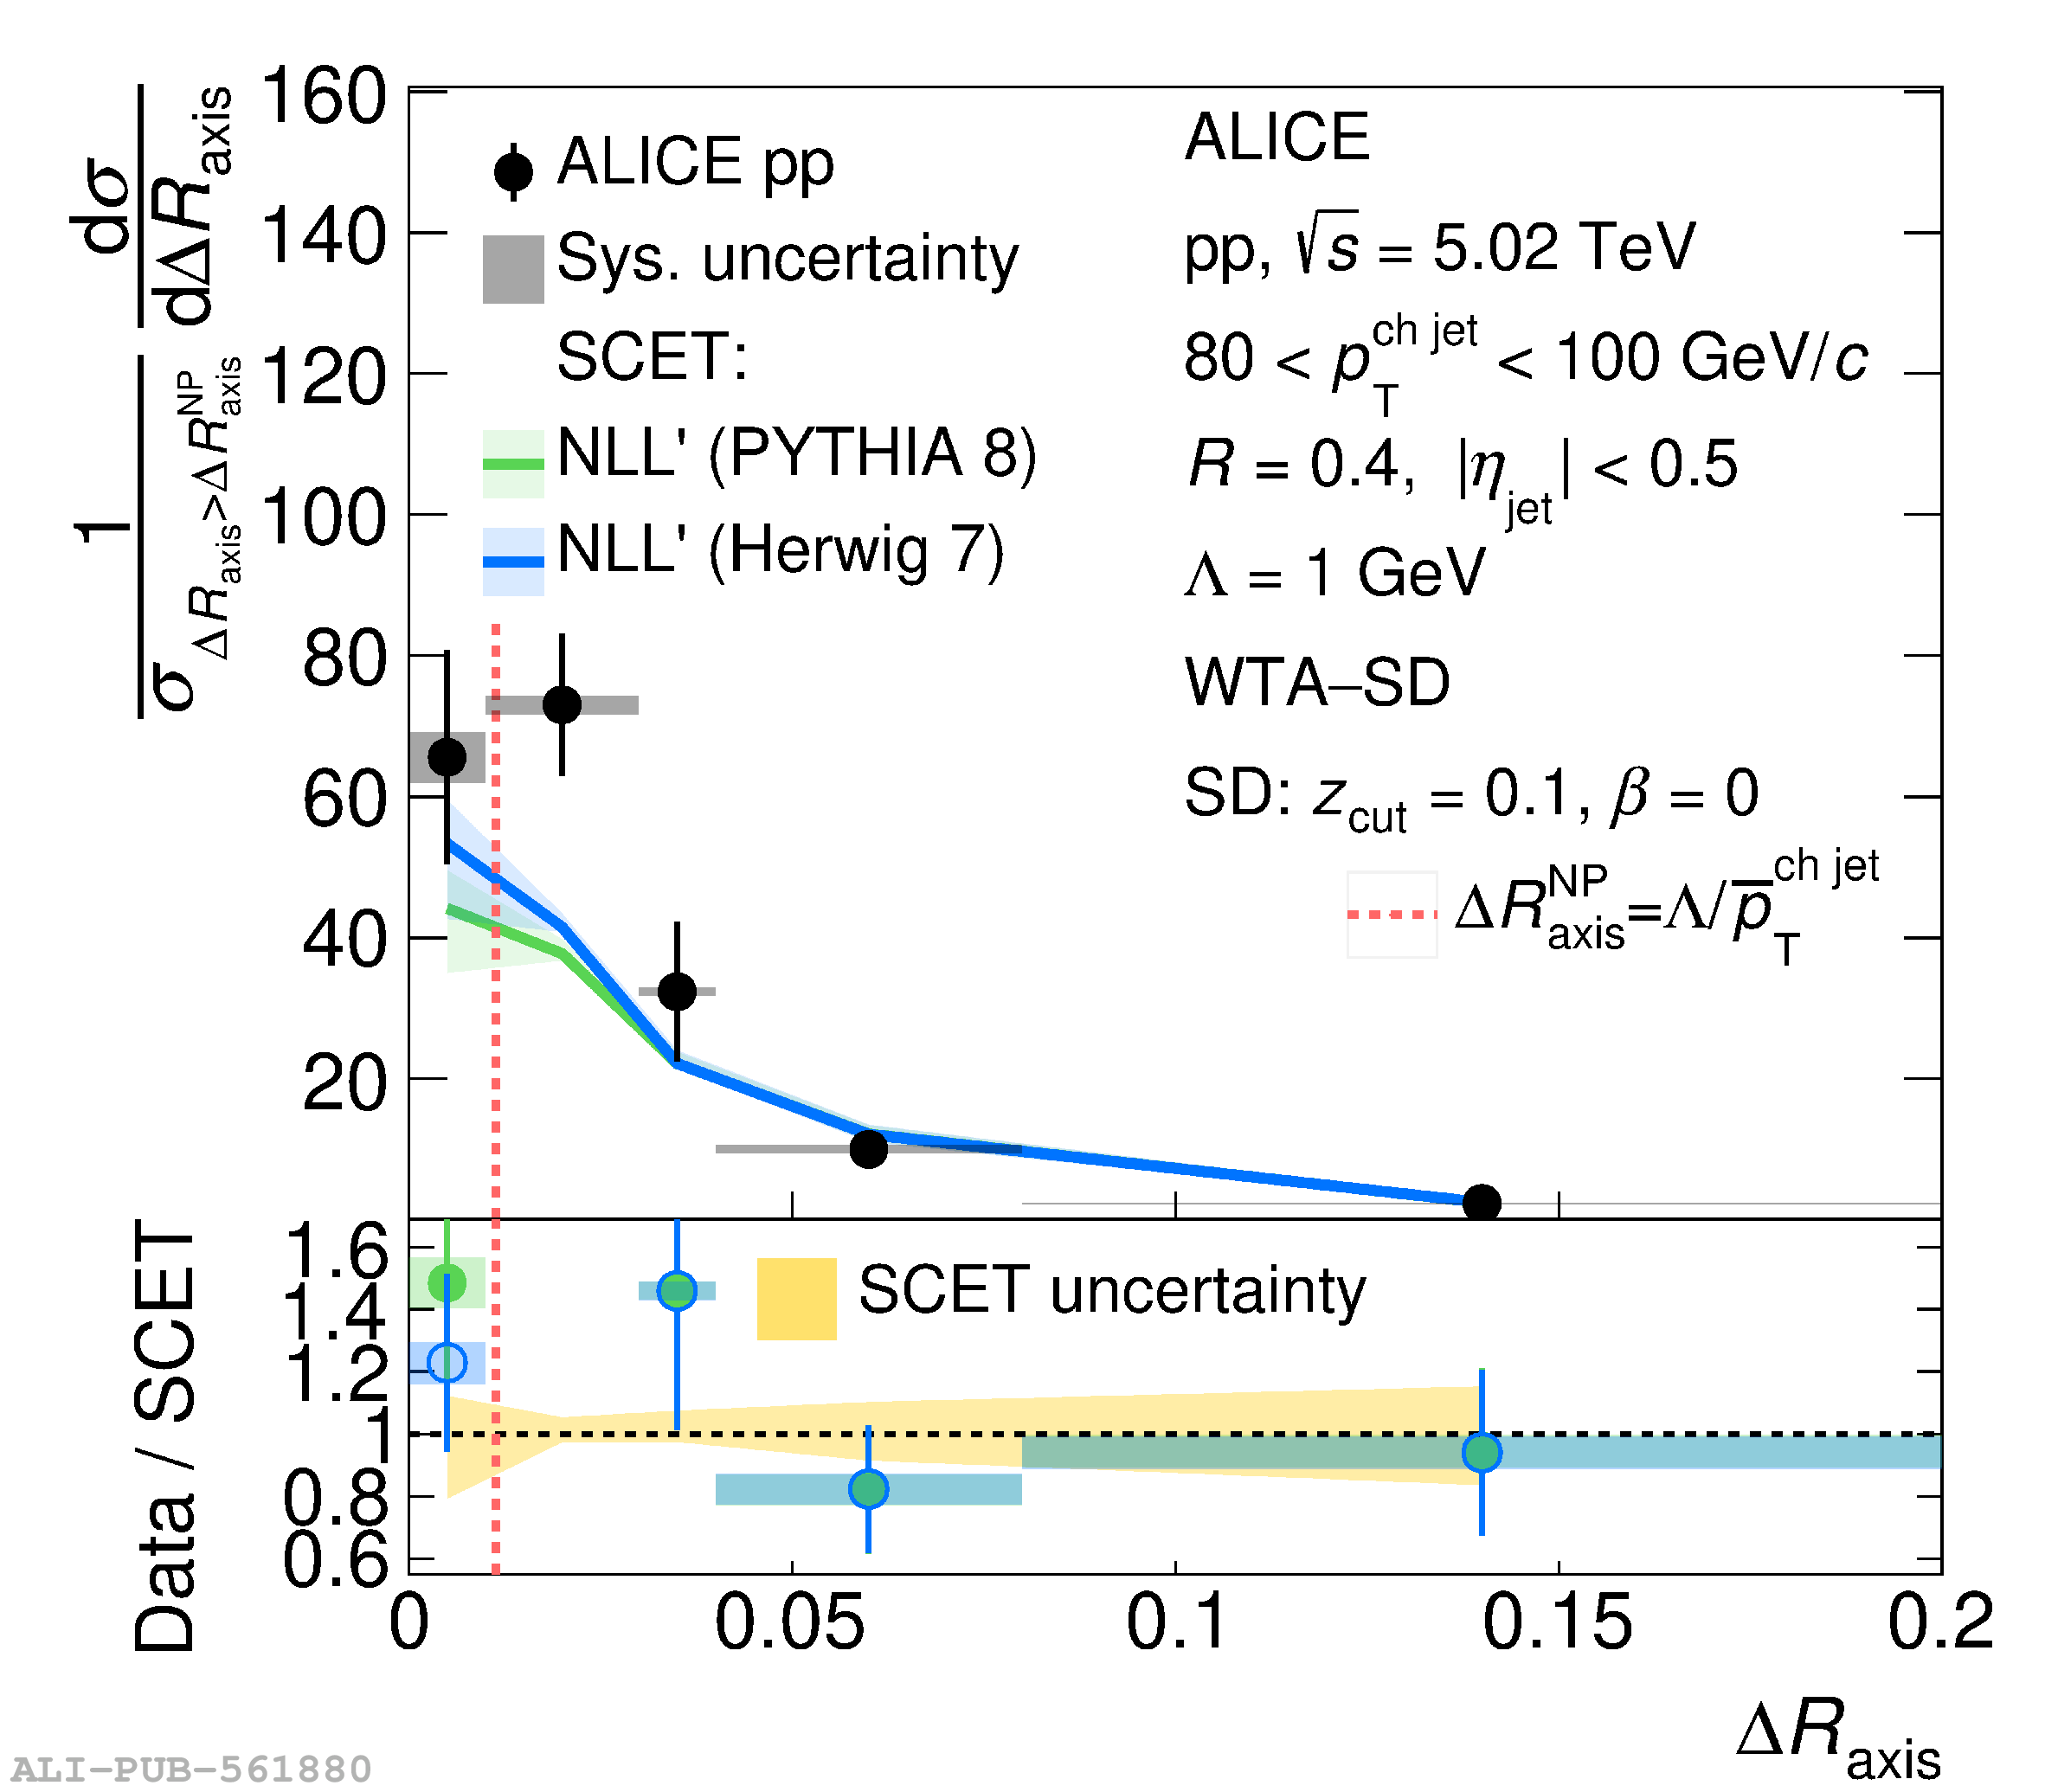
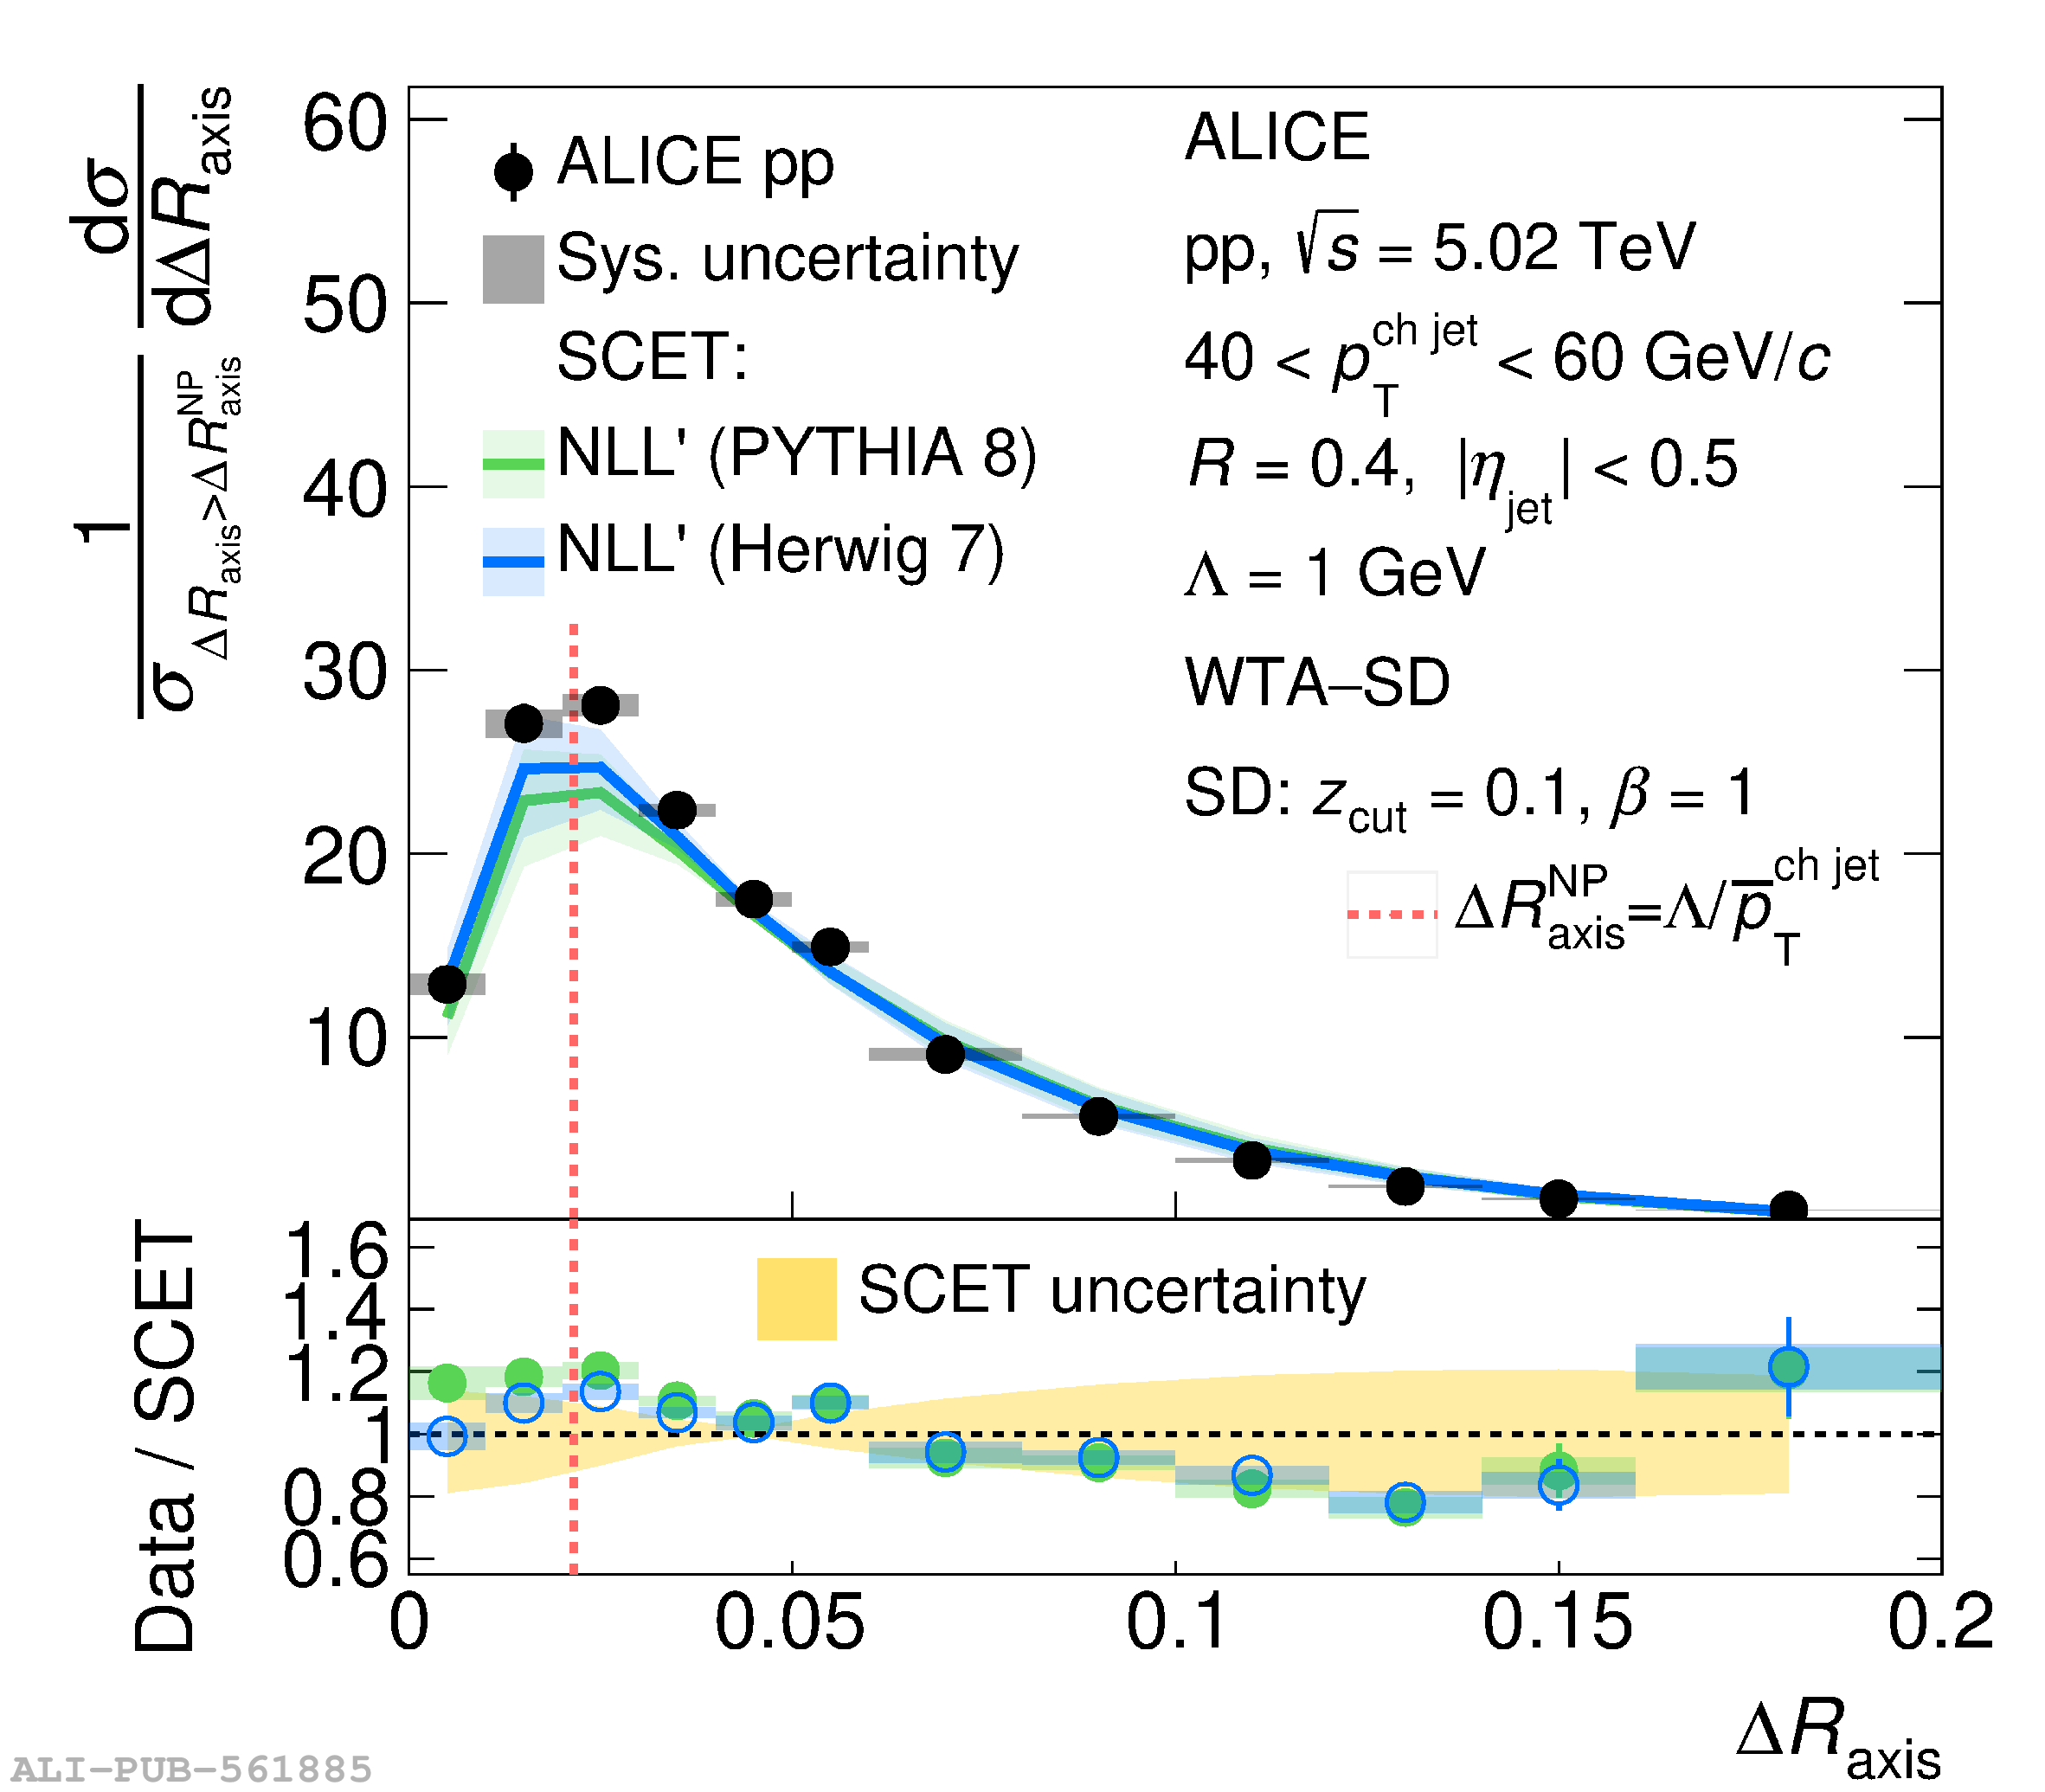
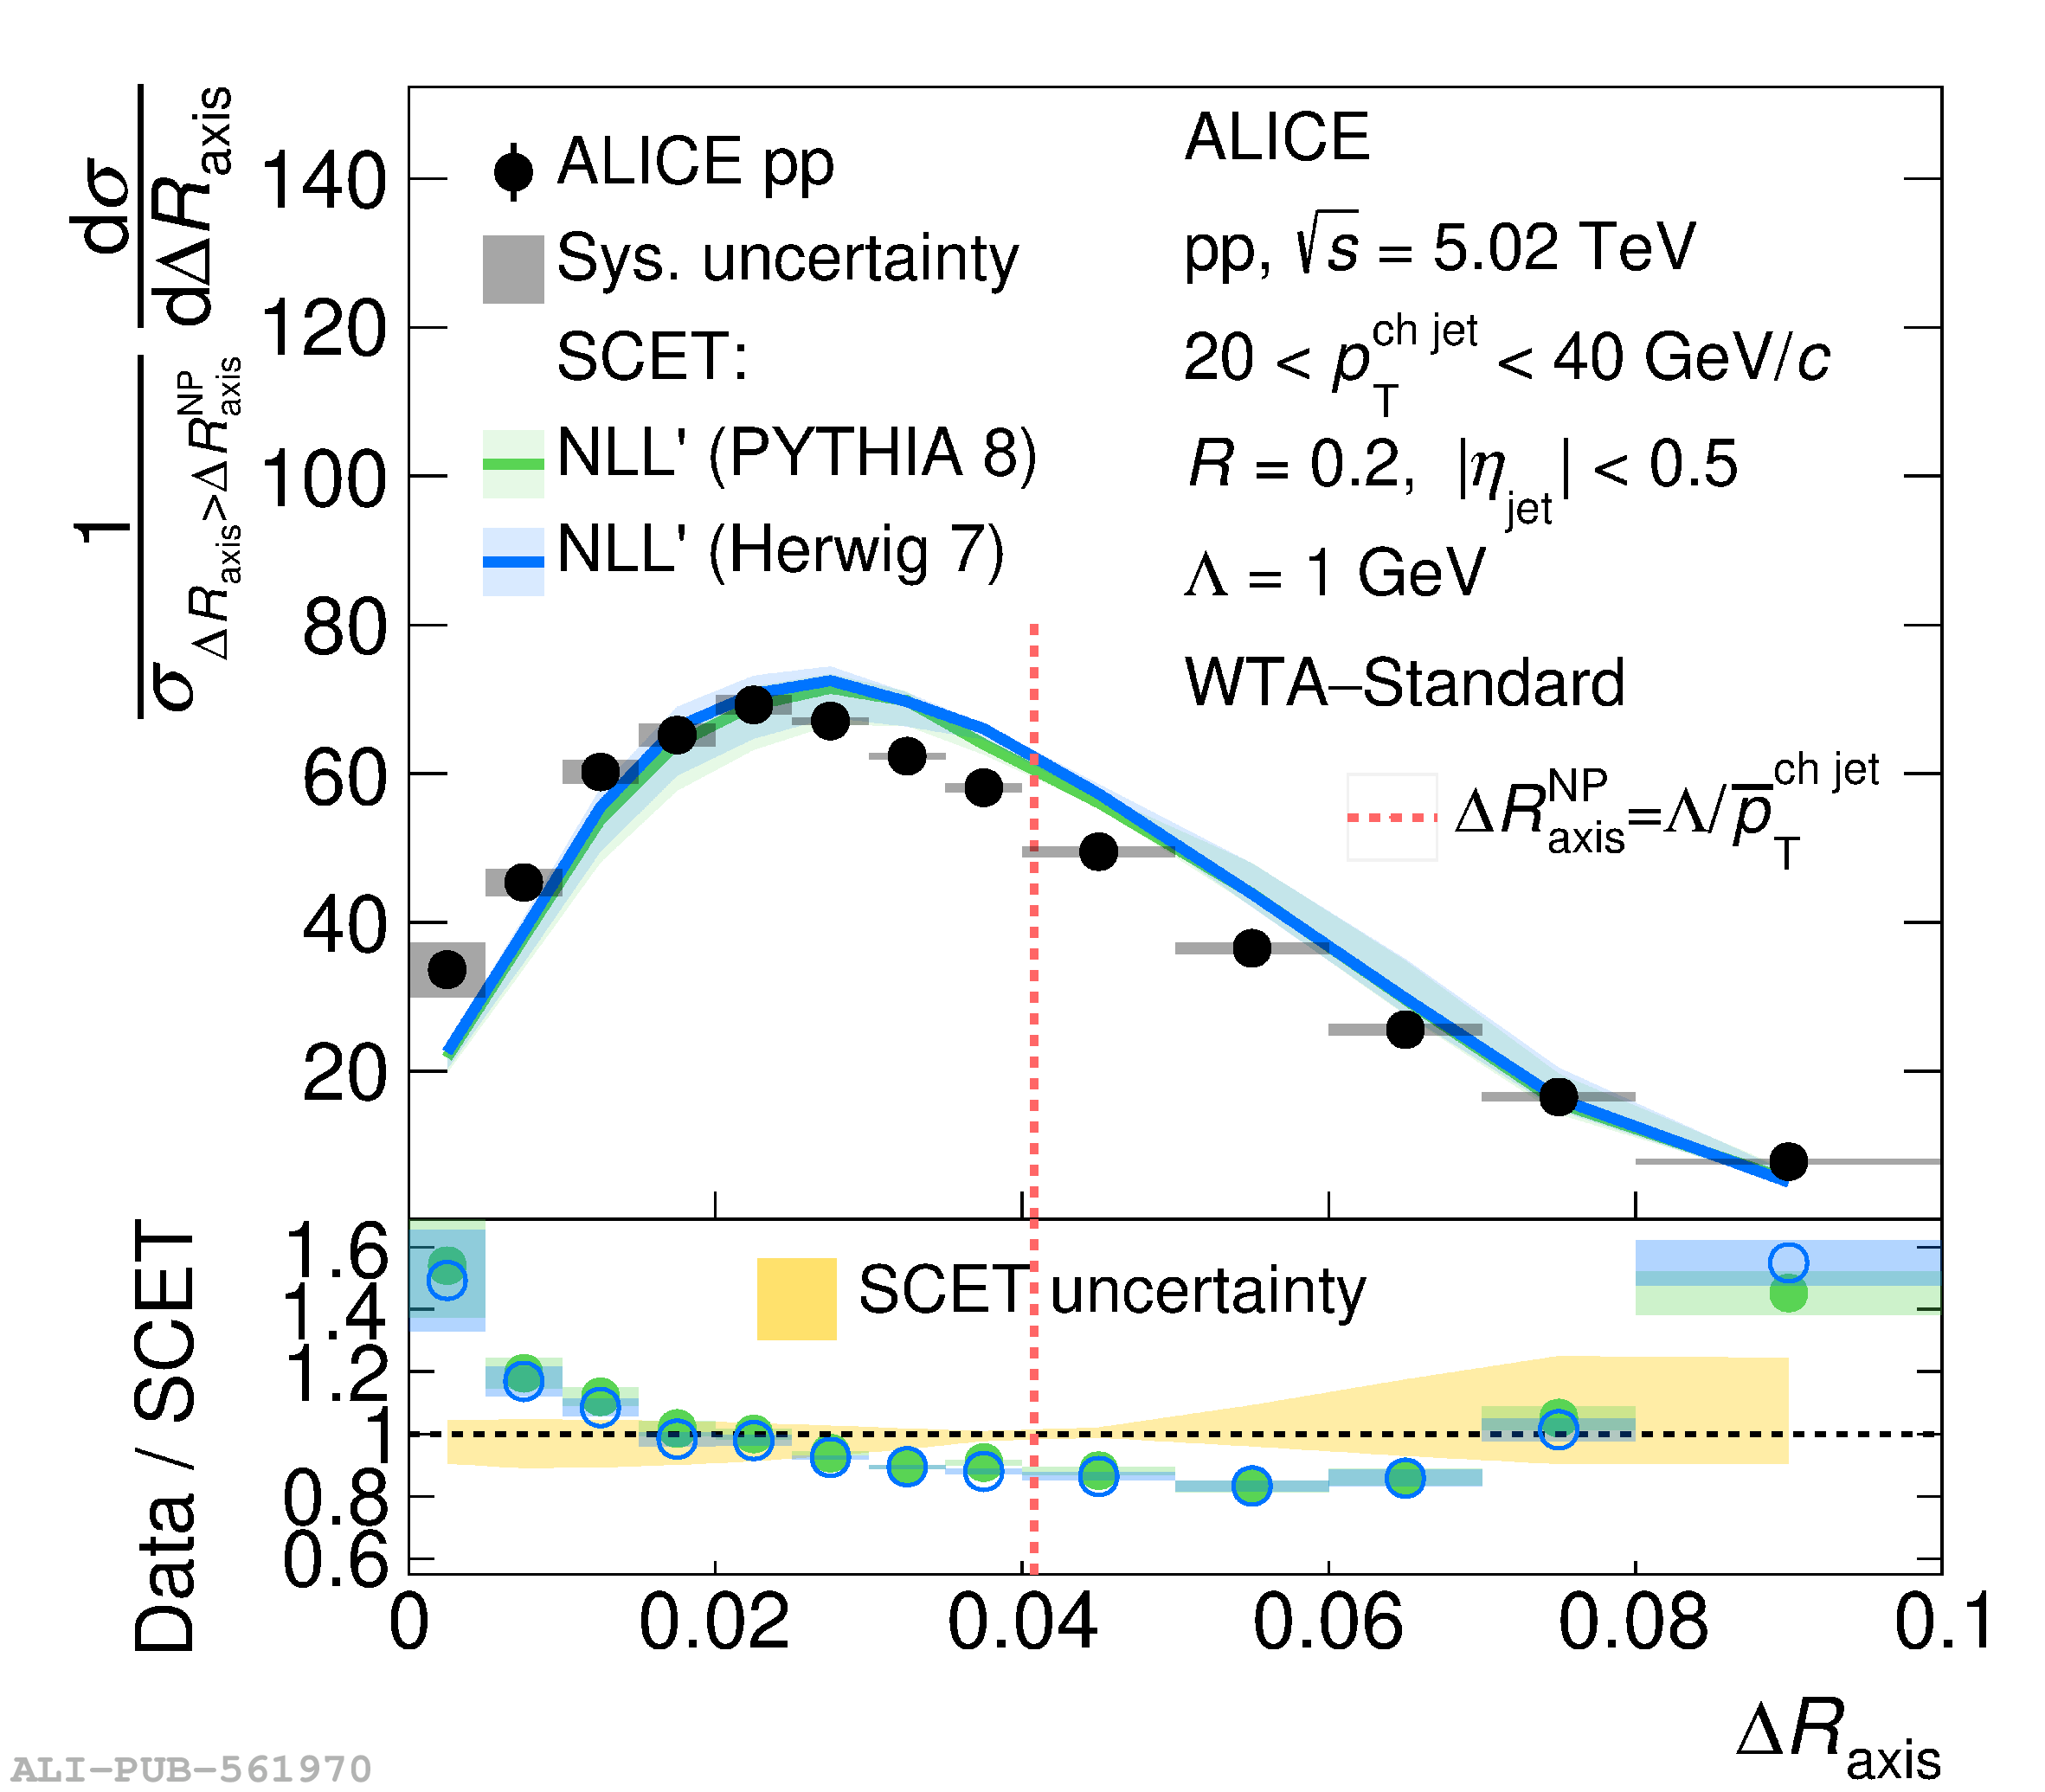
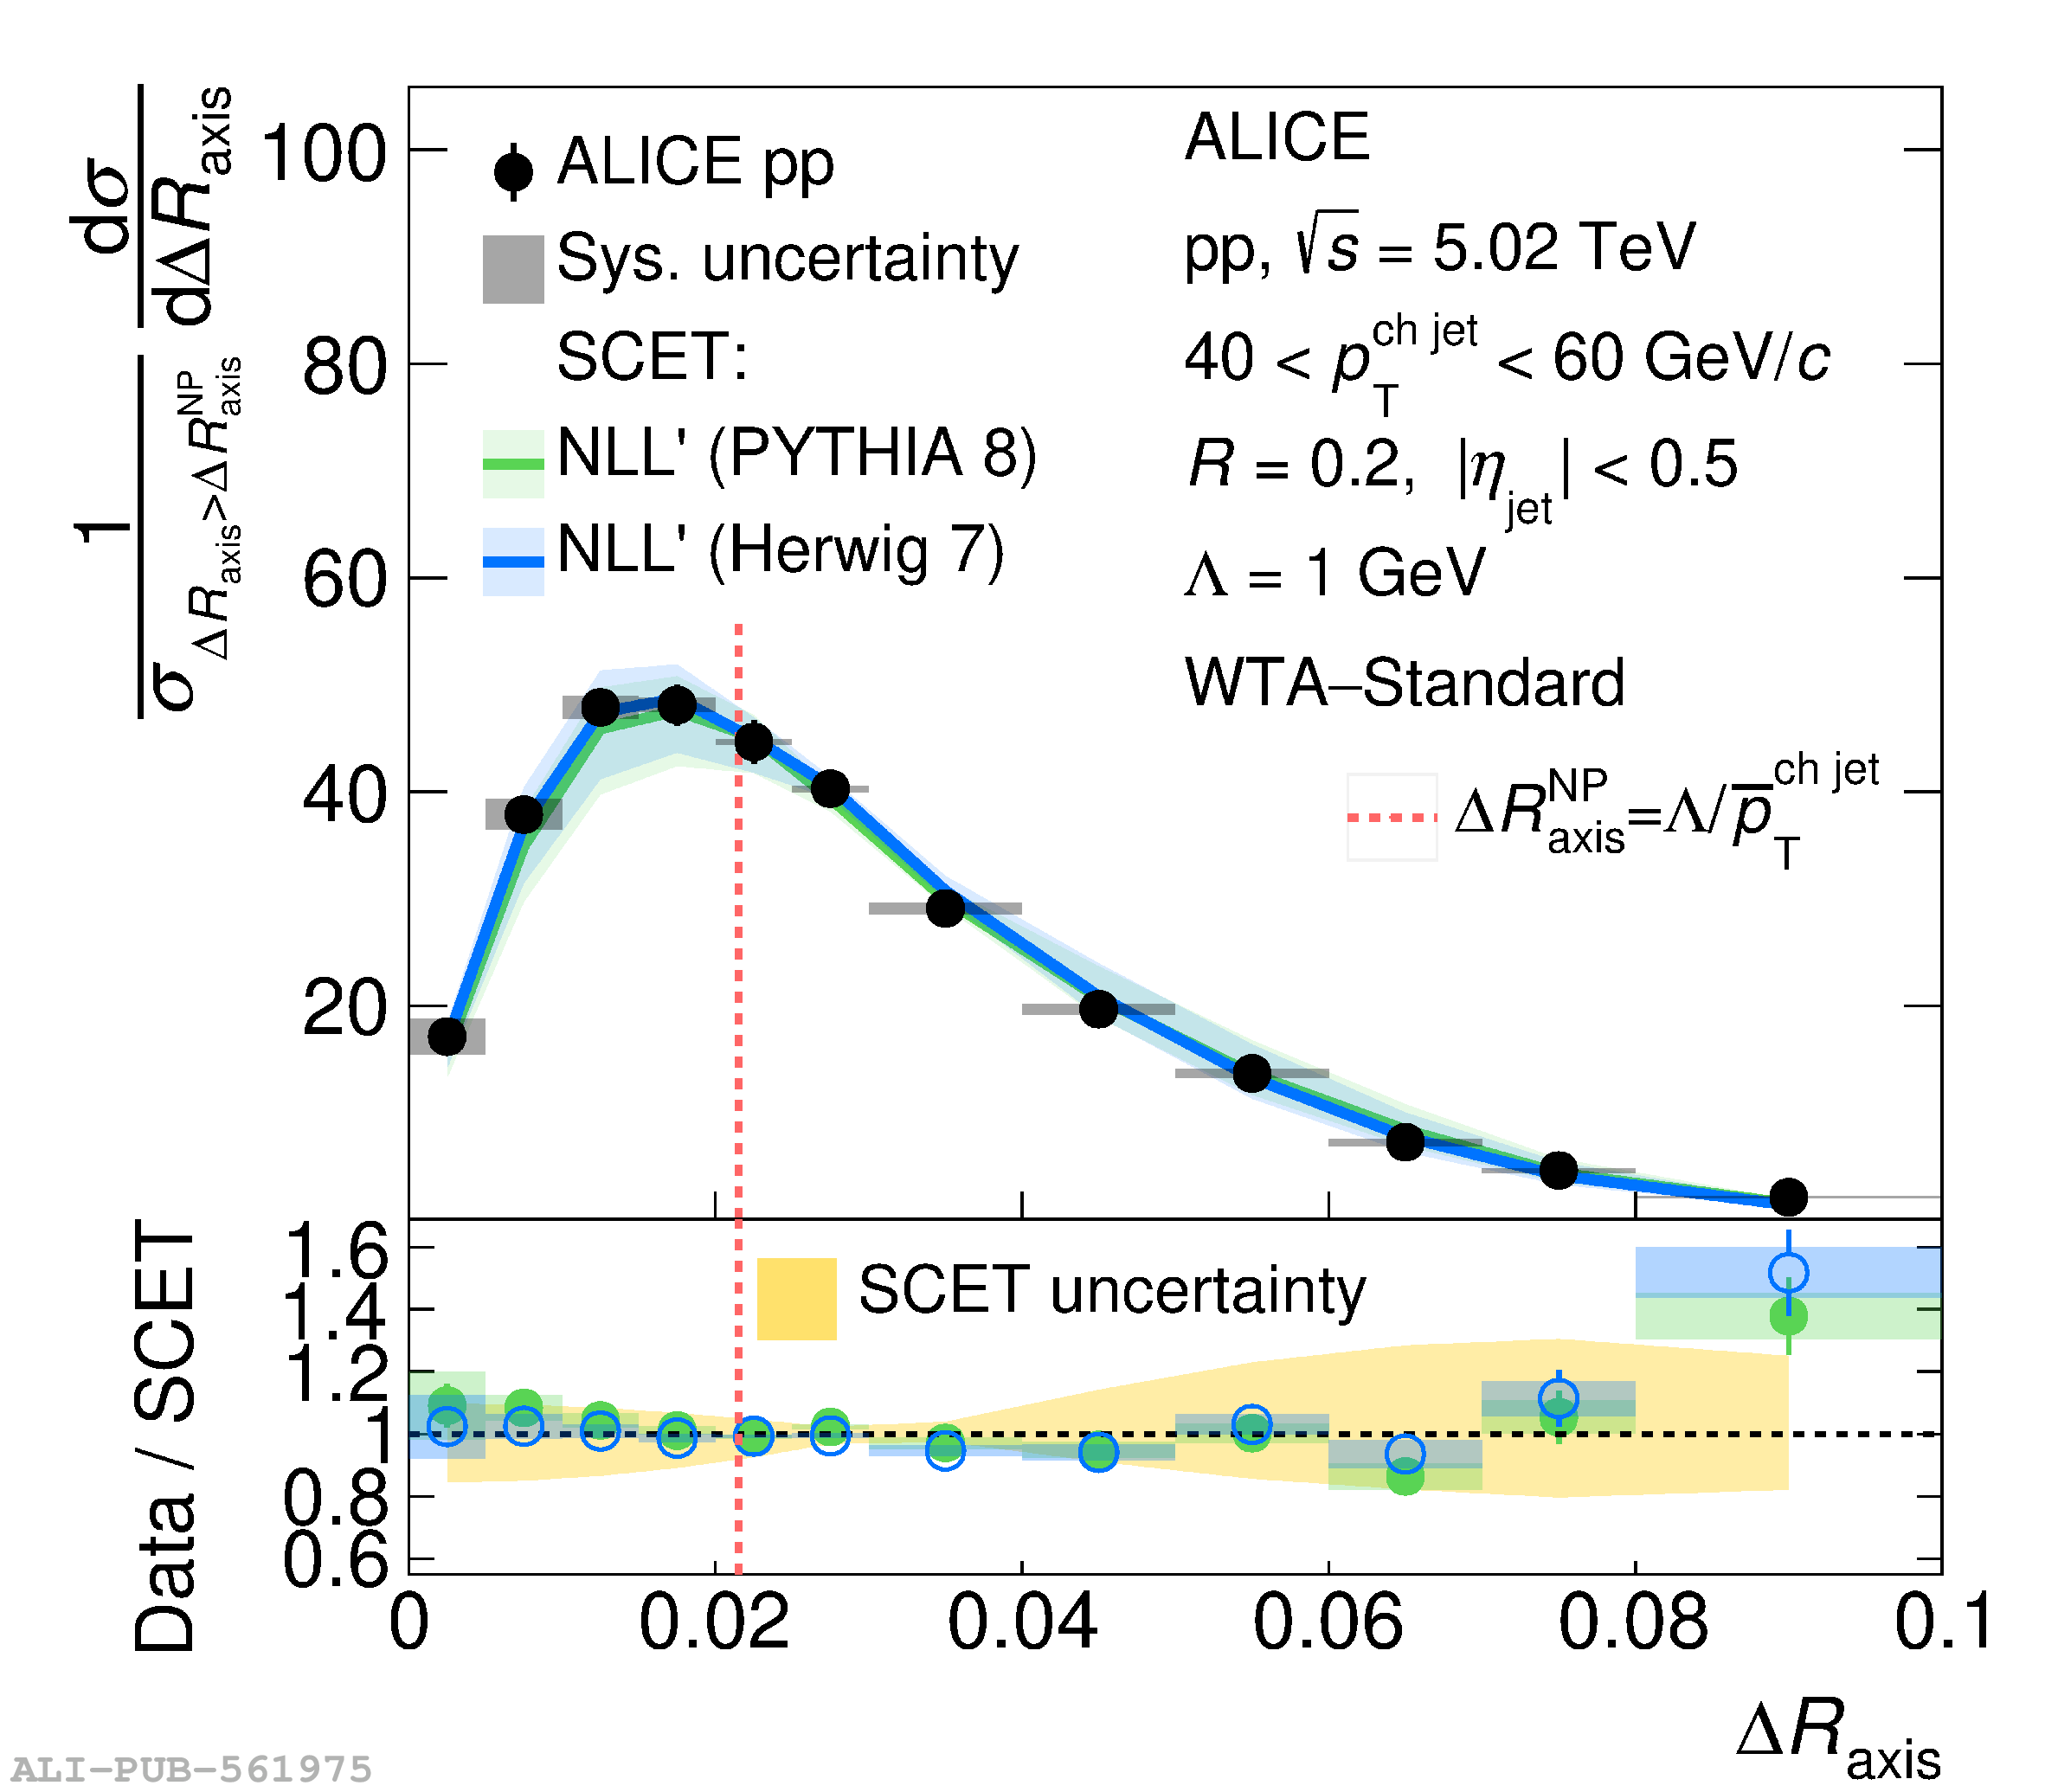
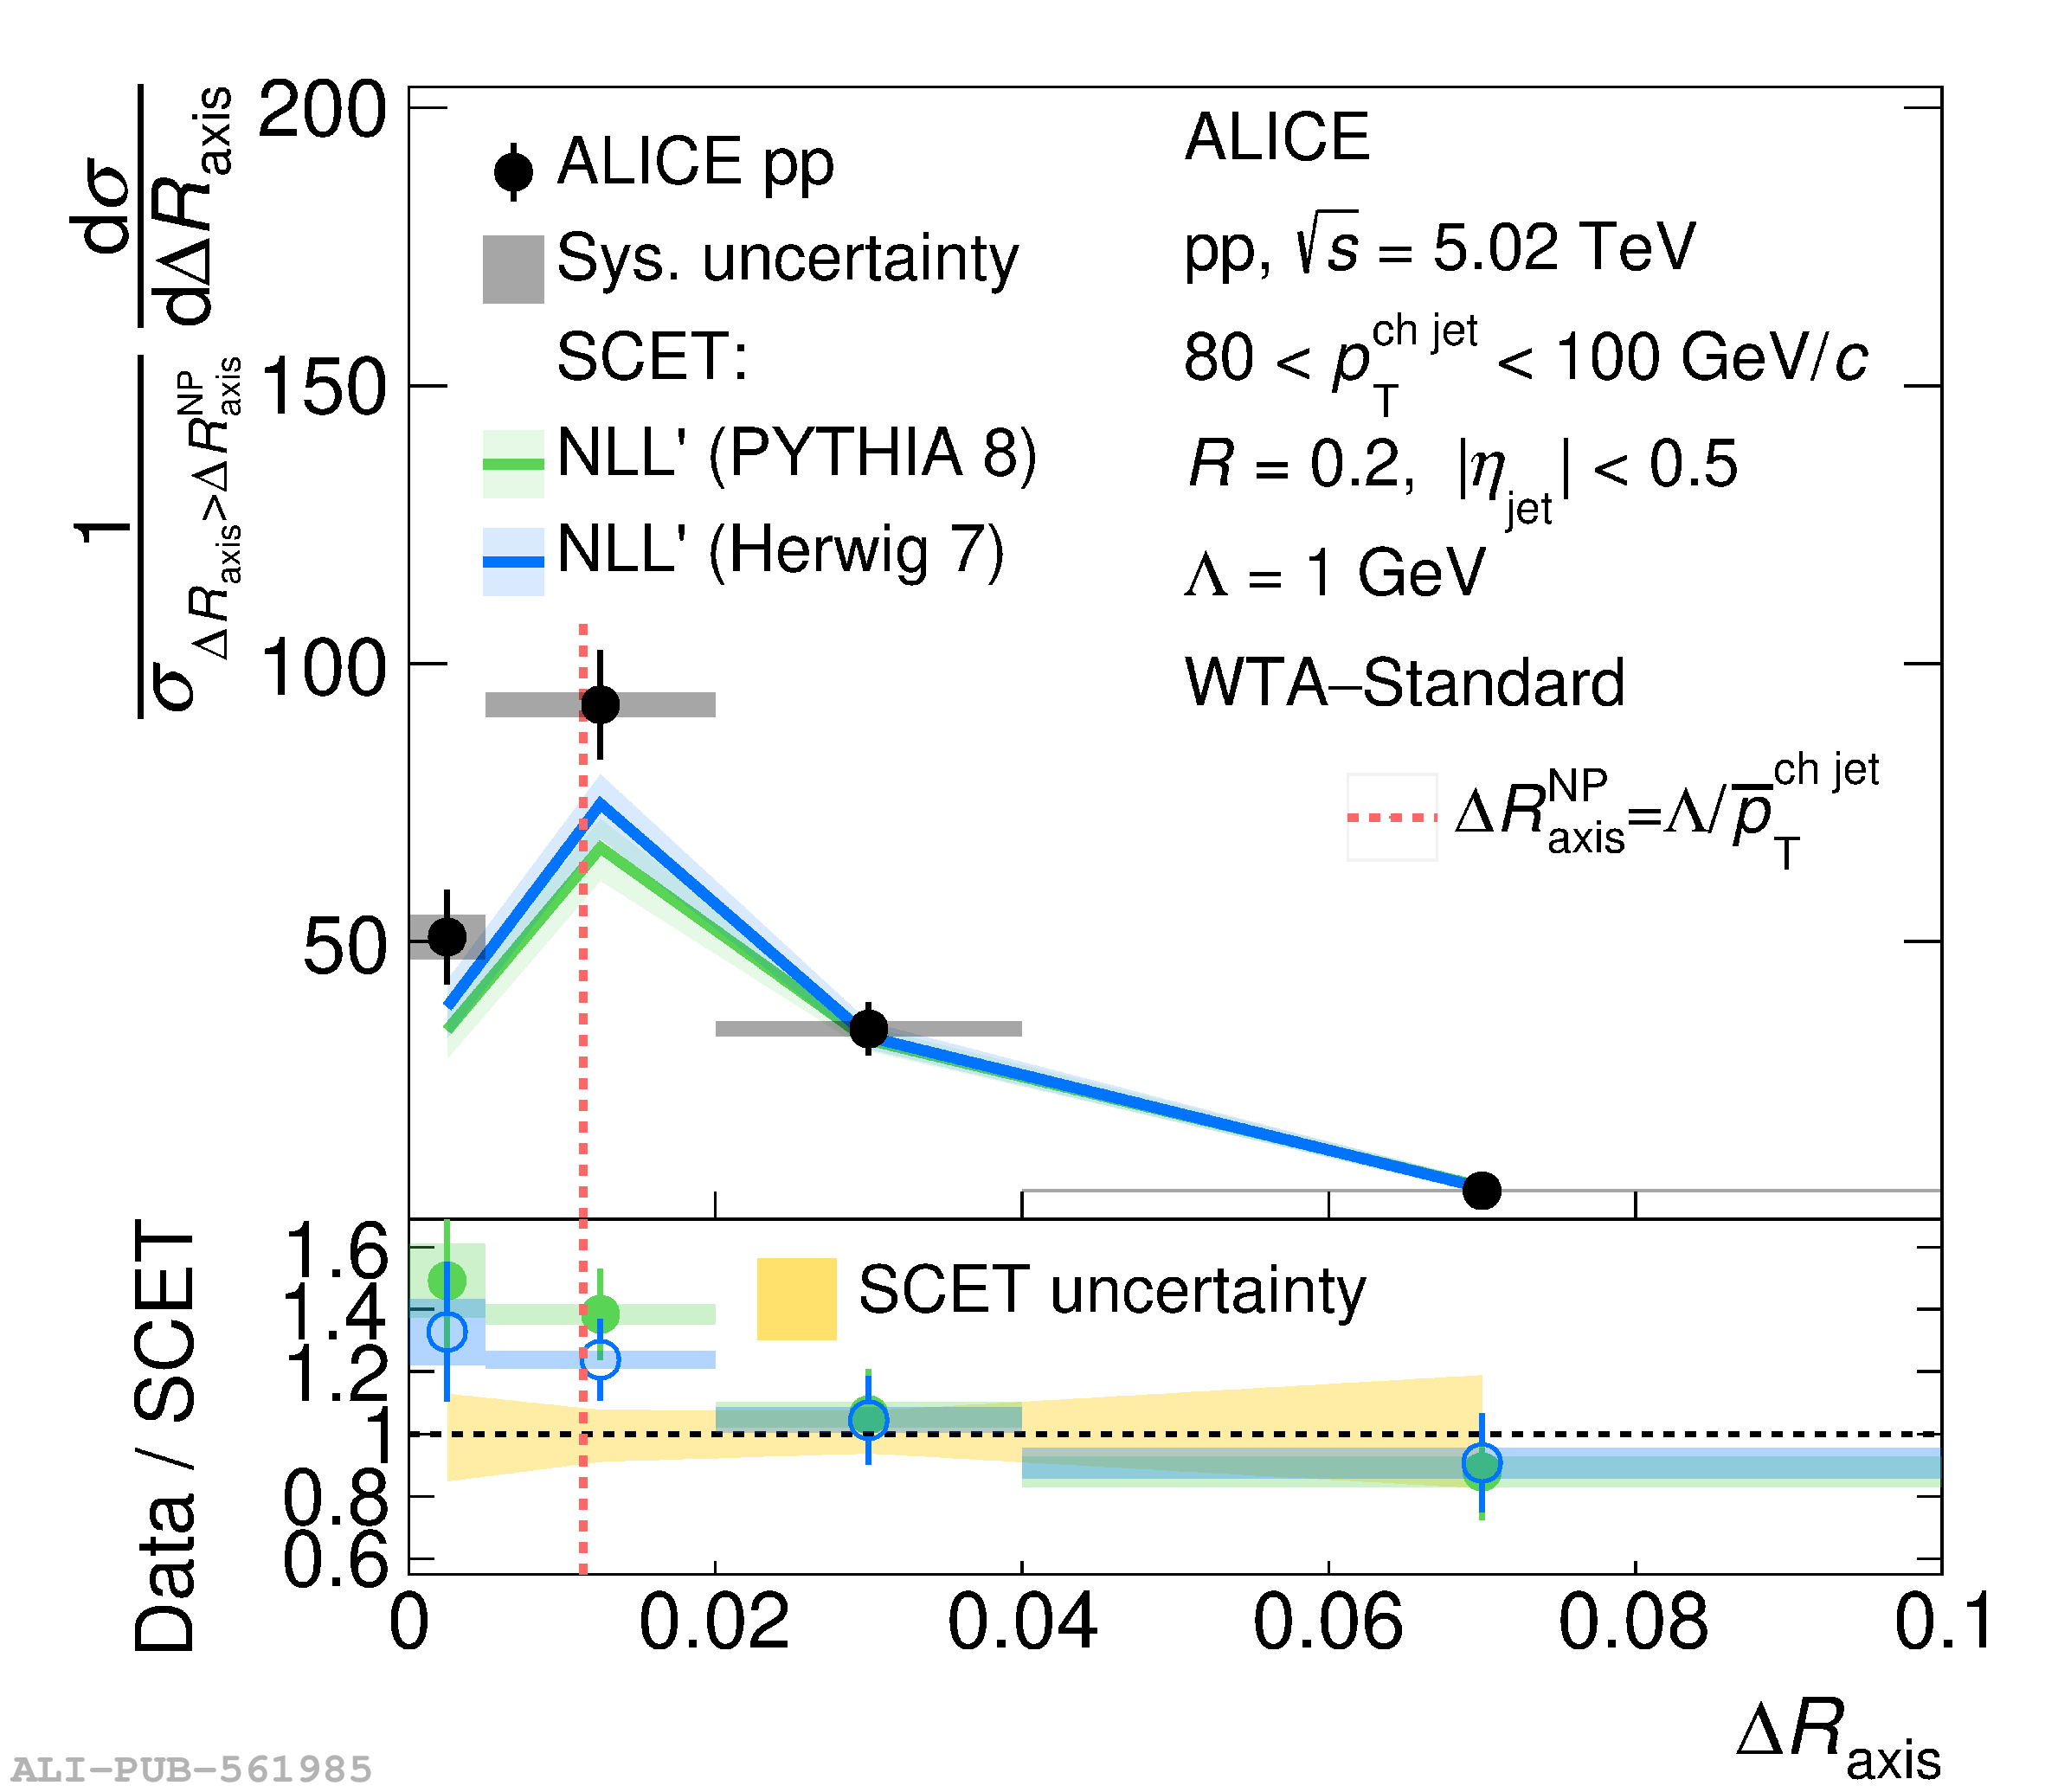
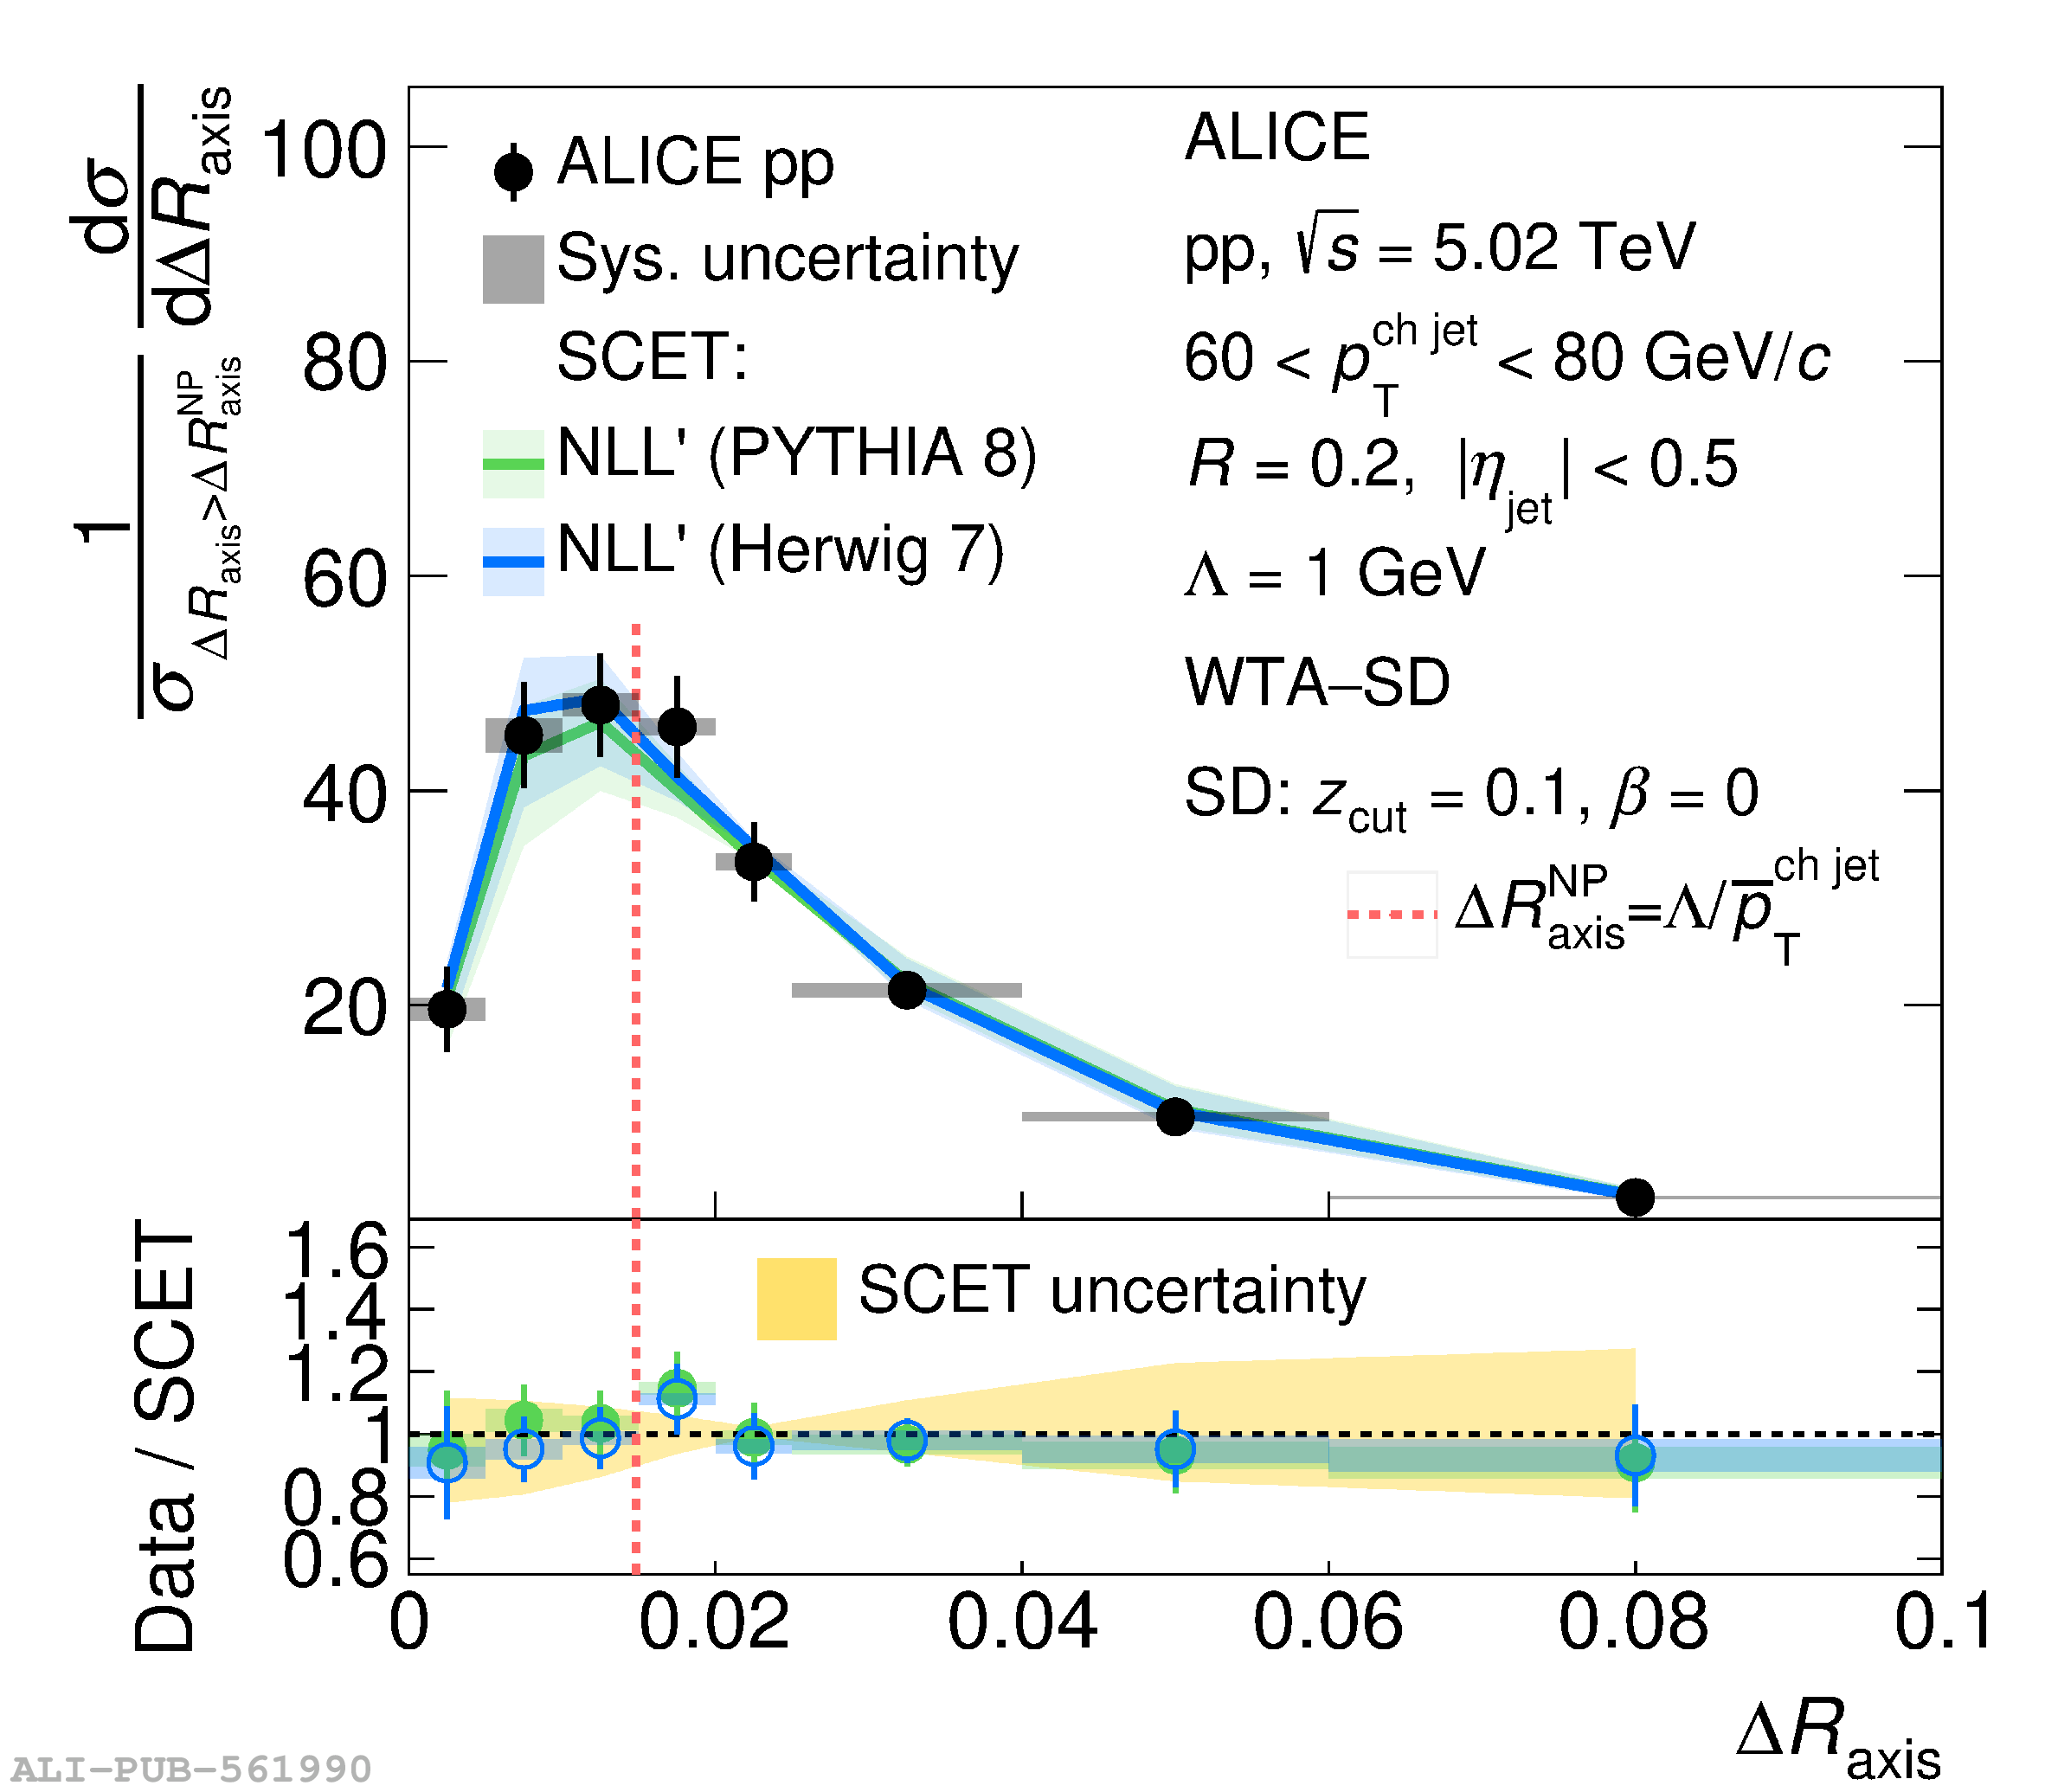
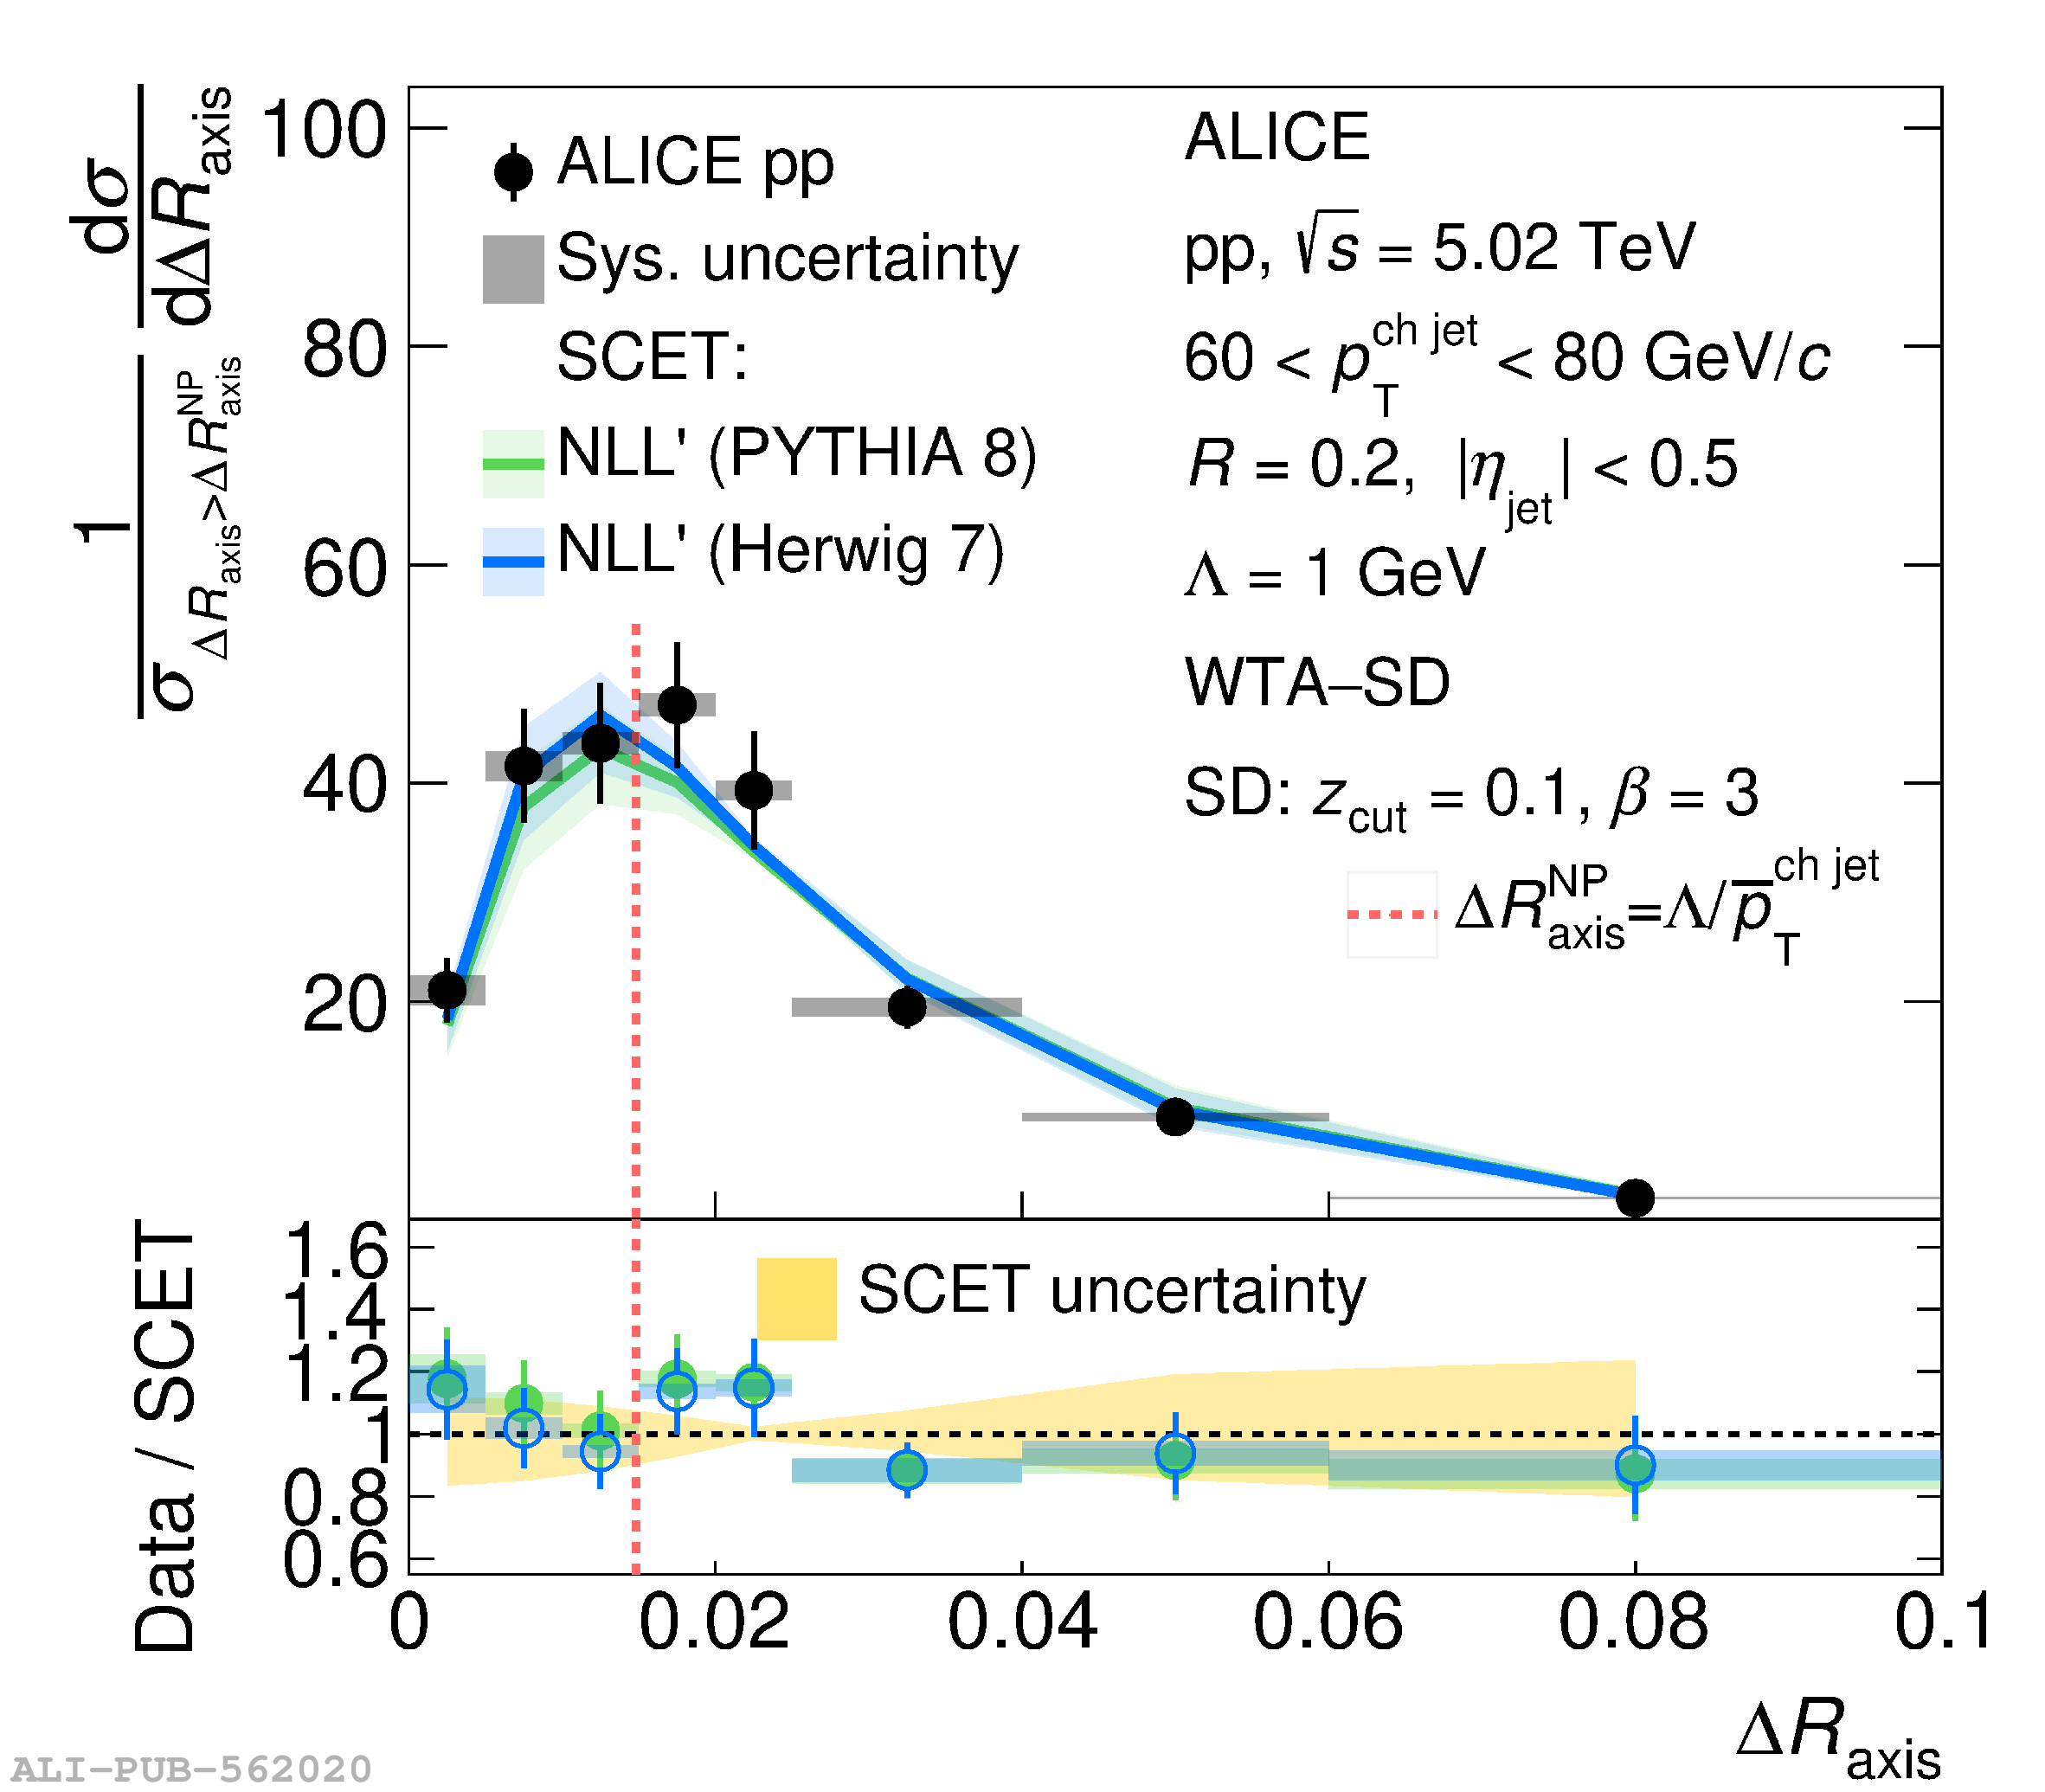
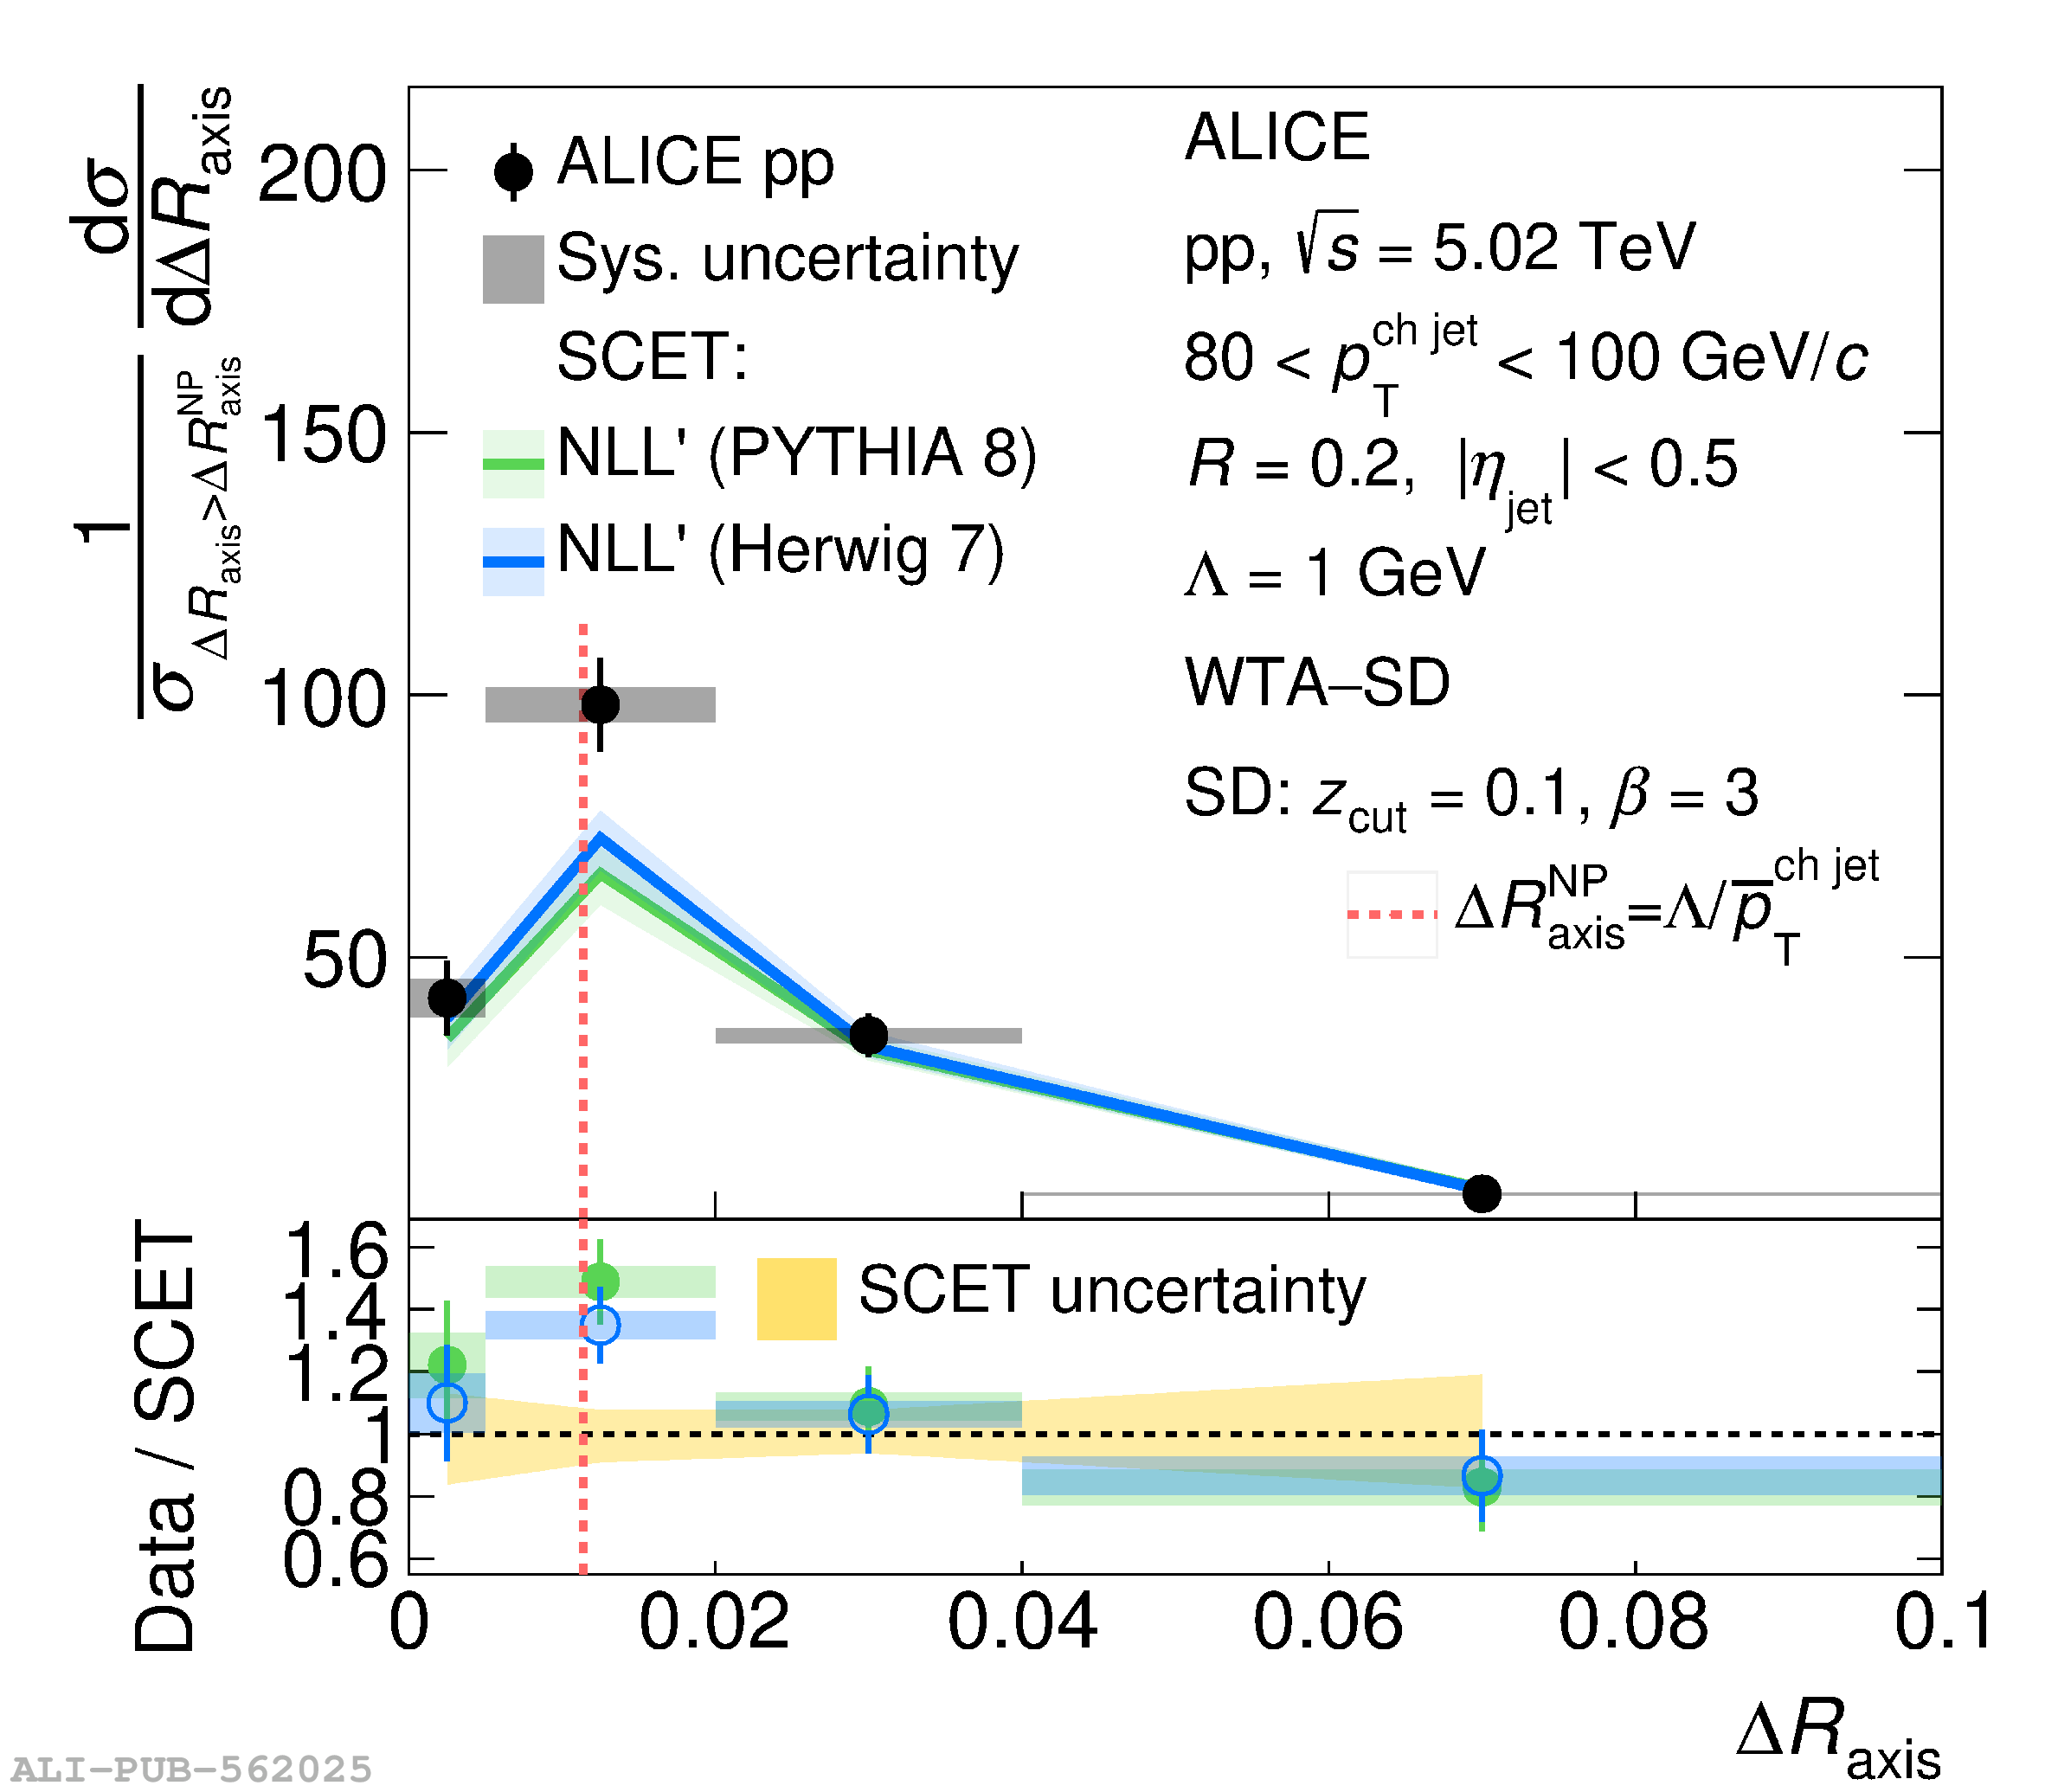
Comparison between measured distributions and analytic predictions for the difference between the WTA axis and the Standard (left), SD ($z_{\rm cut}=0.2,\beta=1$) (center), and SD ($z_{\rm cut}=0.3,\beta=1$) (right) axes for jets of $R=0.4$ (top) and 0.2 (bottom) in the transverse momentum range $40 < p_{\rm T}^{\rm ch\,jet} < 60$ GeV/$c$. The black markers correspond to the distributions determined from measured data. The vertical error bars correspond to the statistical uncertainties, and the rectangles correspond to the total systematic uncertainties. The colored curves correspond to the SCET-based analytic predictions corrected for charge and MPI effects using two event generators (PYTHIA 8 and Herwig 7). The vertical dashed line defines the approximate boundary between the non-perturbative and perturbative regions. Both the measured and analytic predictions are normalized so that the integral $\int_{\Delta R_{\rm axis}^{\rm NP}}^{R/2}{\rm d}\Delta R_{\rm axis} ({\rm d}\sigma/{\rm d}\Delta R_{\rm axis})=1$. The bottom panels show the data/SCET ratios. The colored rectangles correspond to the systematic uncertainty of the measured distribution. The size of the theoretical uncertainty in the analytic predictions is shown as a yellow band. | 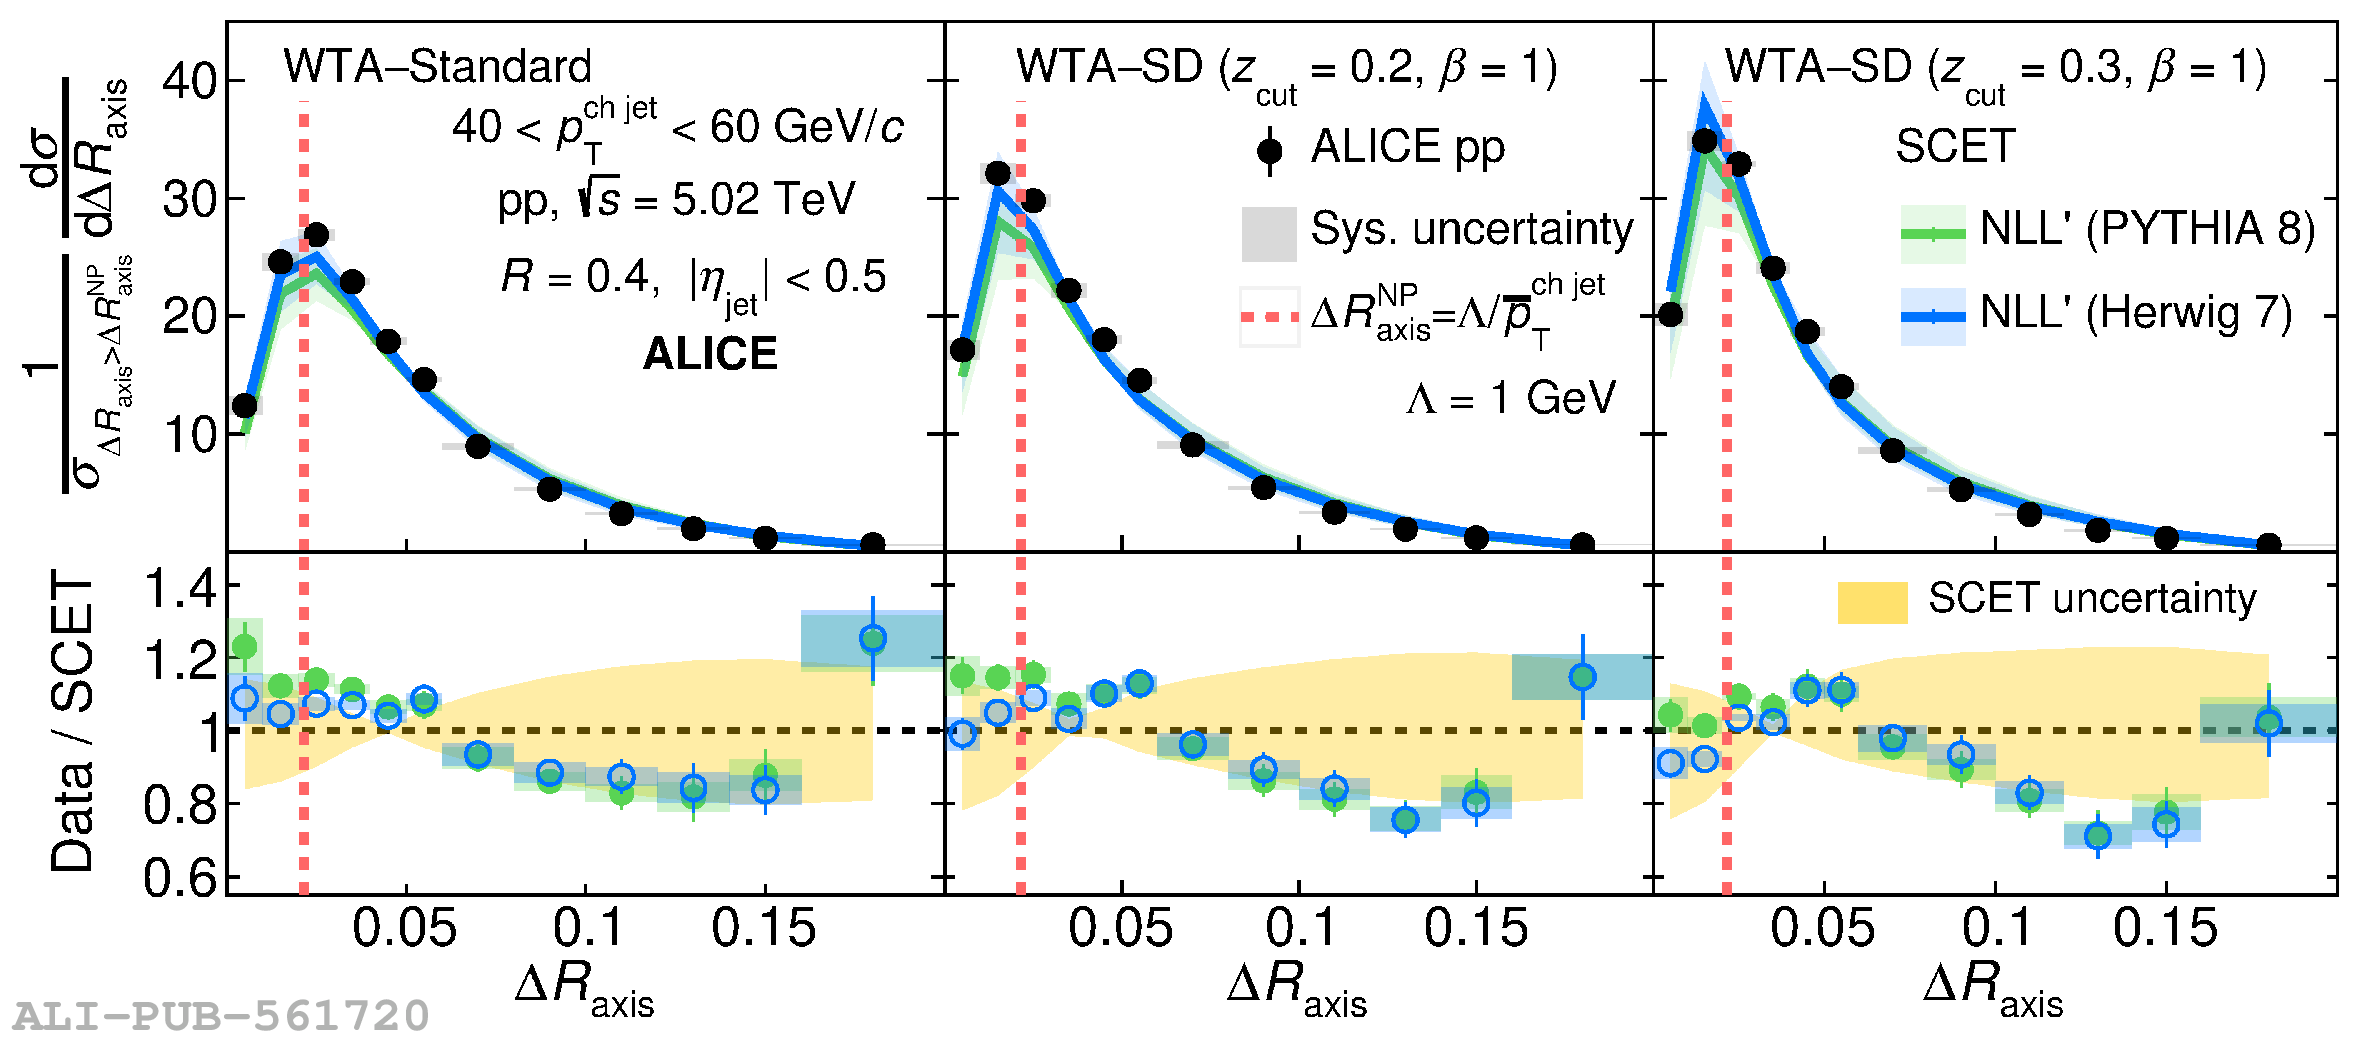 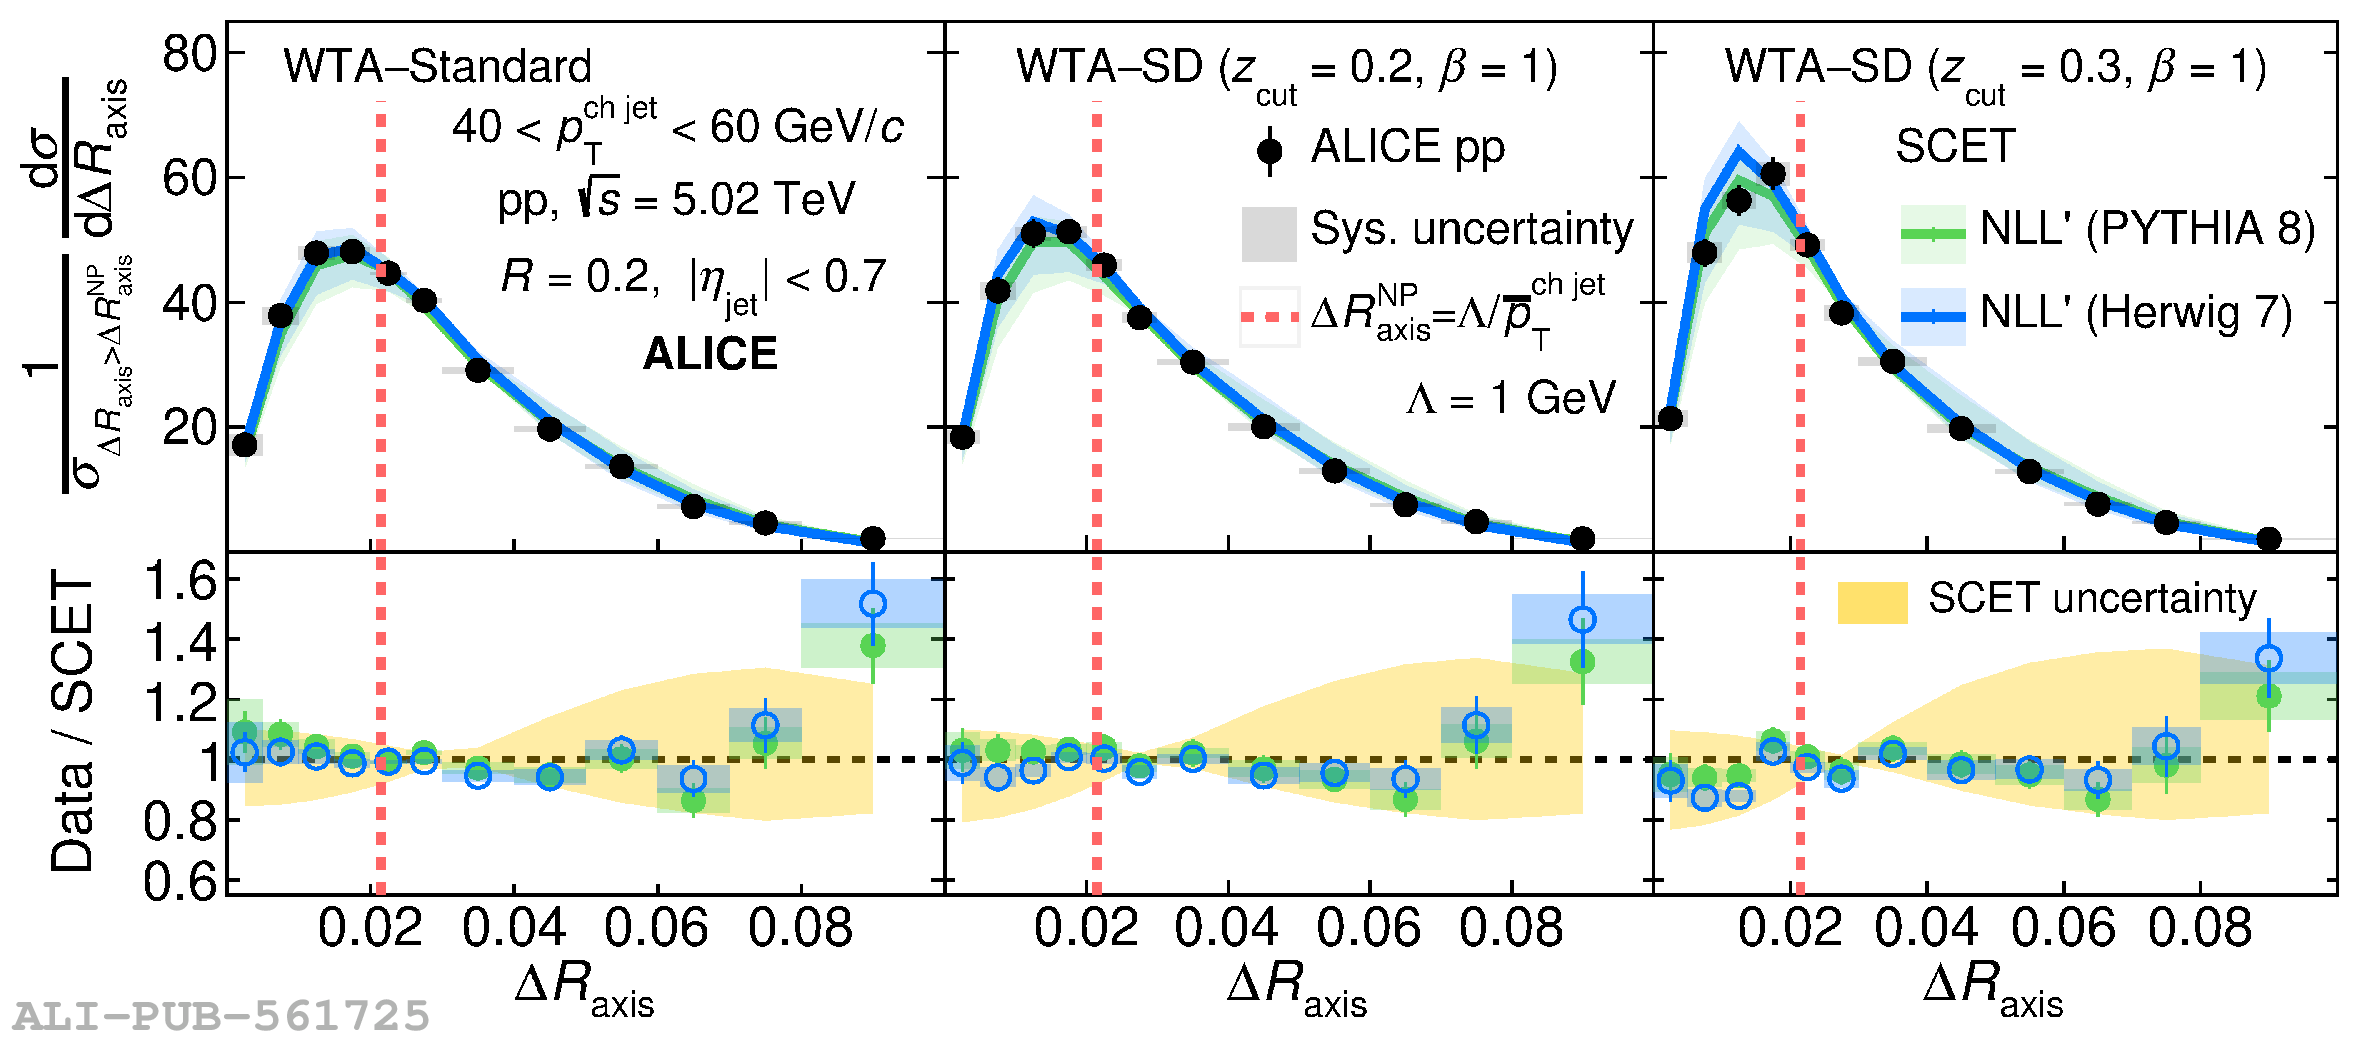 |
Figure A.1
Comparison between $\Delta R_{\rm axis}$ WTA$-$Standard and WTA$-$SD measured distributions and Monte Carlo event generators for jets of $R=0.4$ in $20< p_{\rm T}^{\rm jet} <40$ \GeVc. Left: distributions with $z_{\rm cut}=0.1$ and varying $\beta$. Right: distributions with $\beta=1$ and varying $z_{\rm cut}$. | 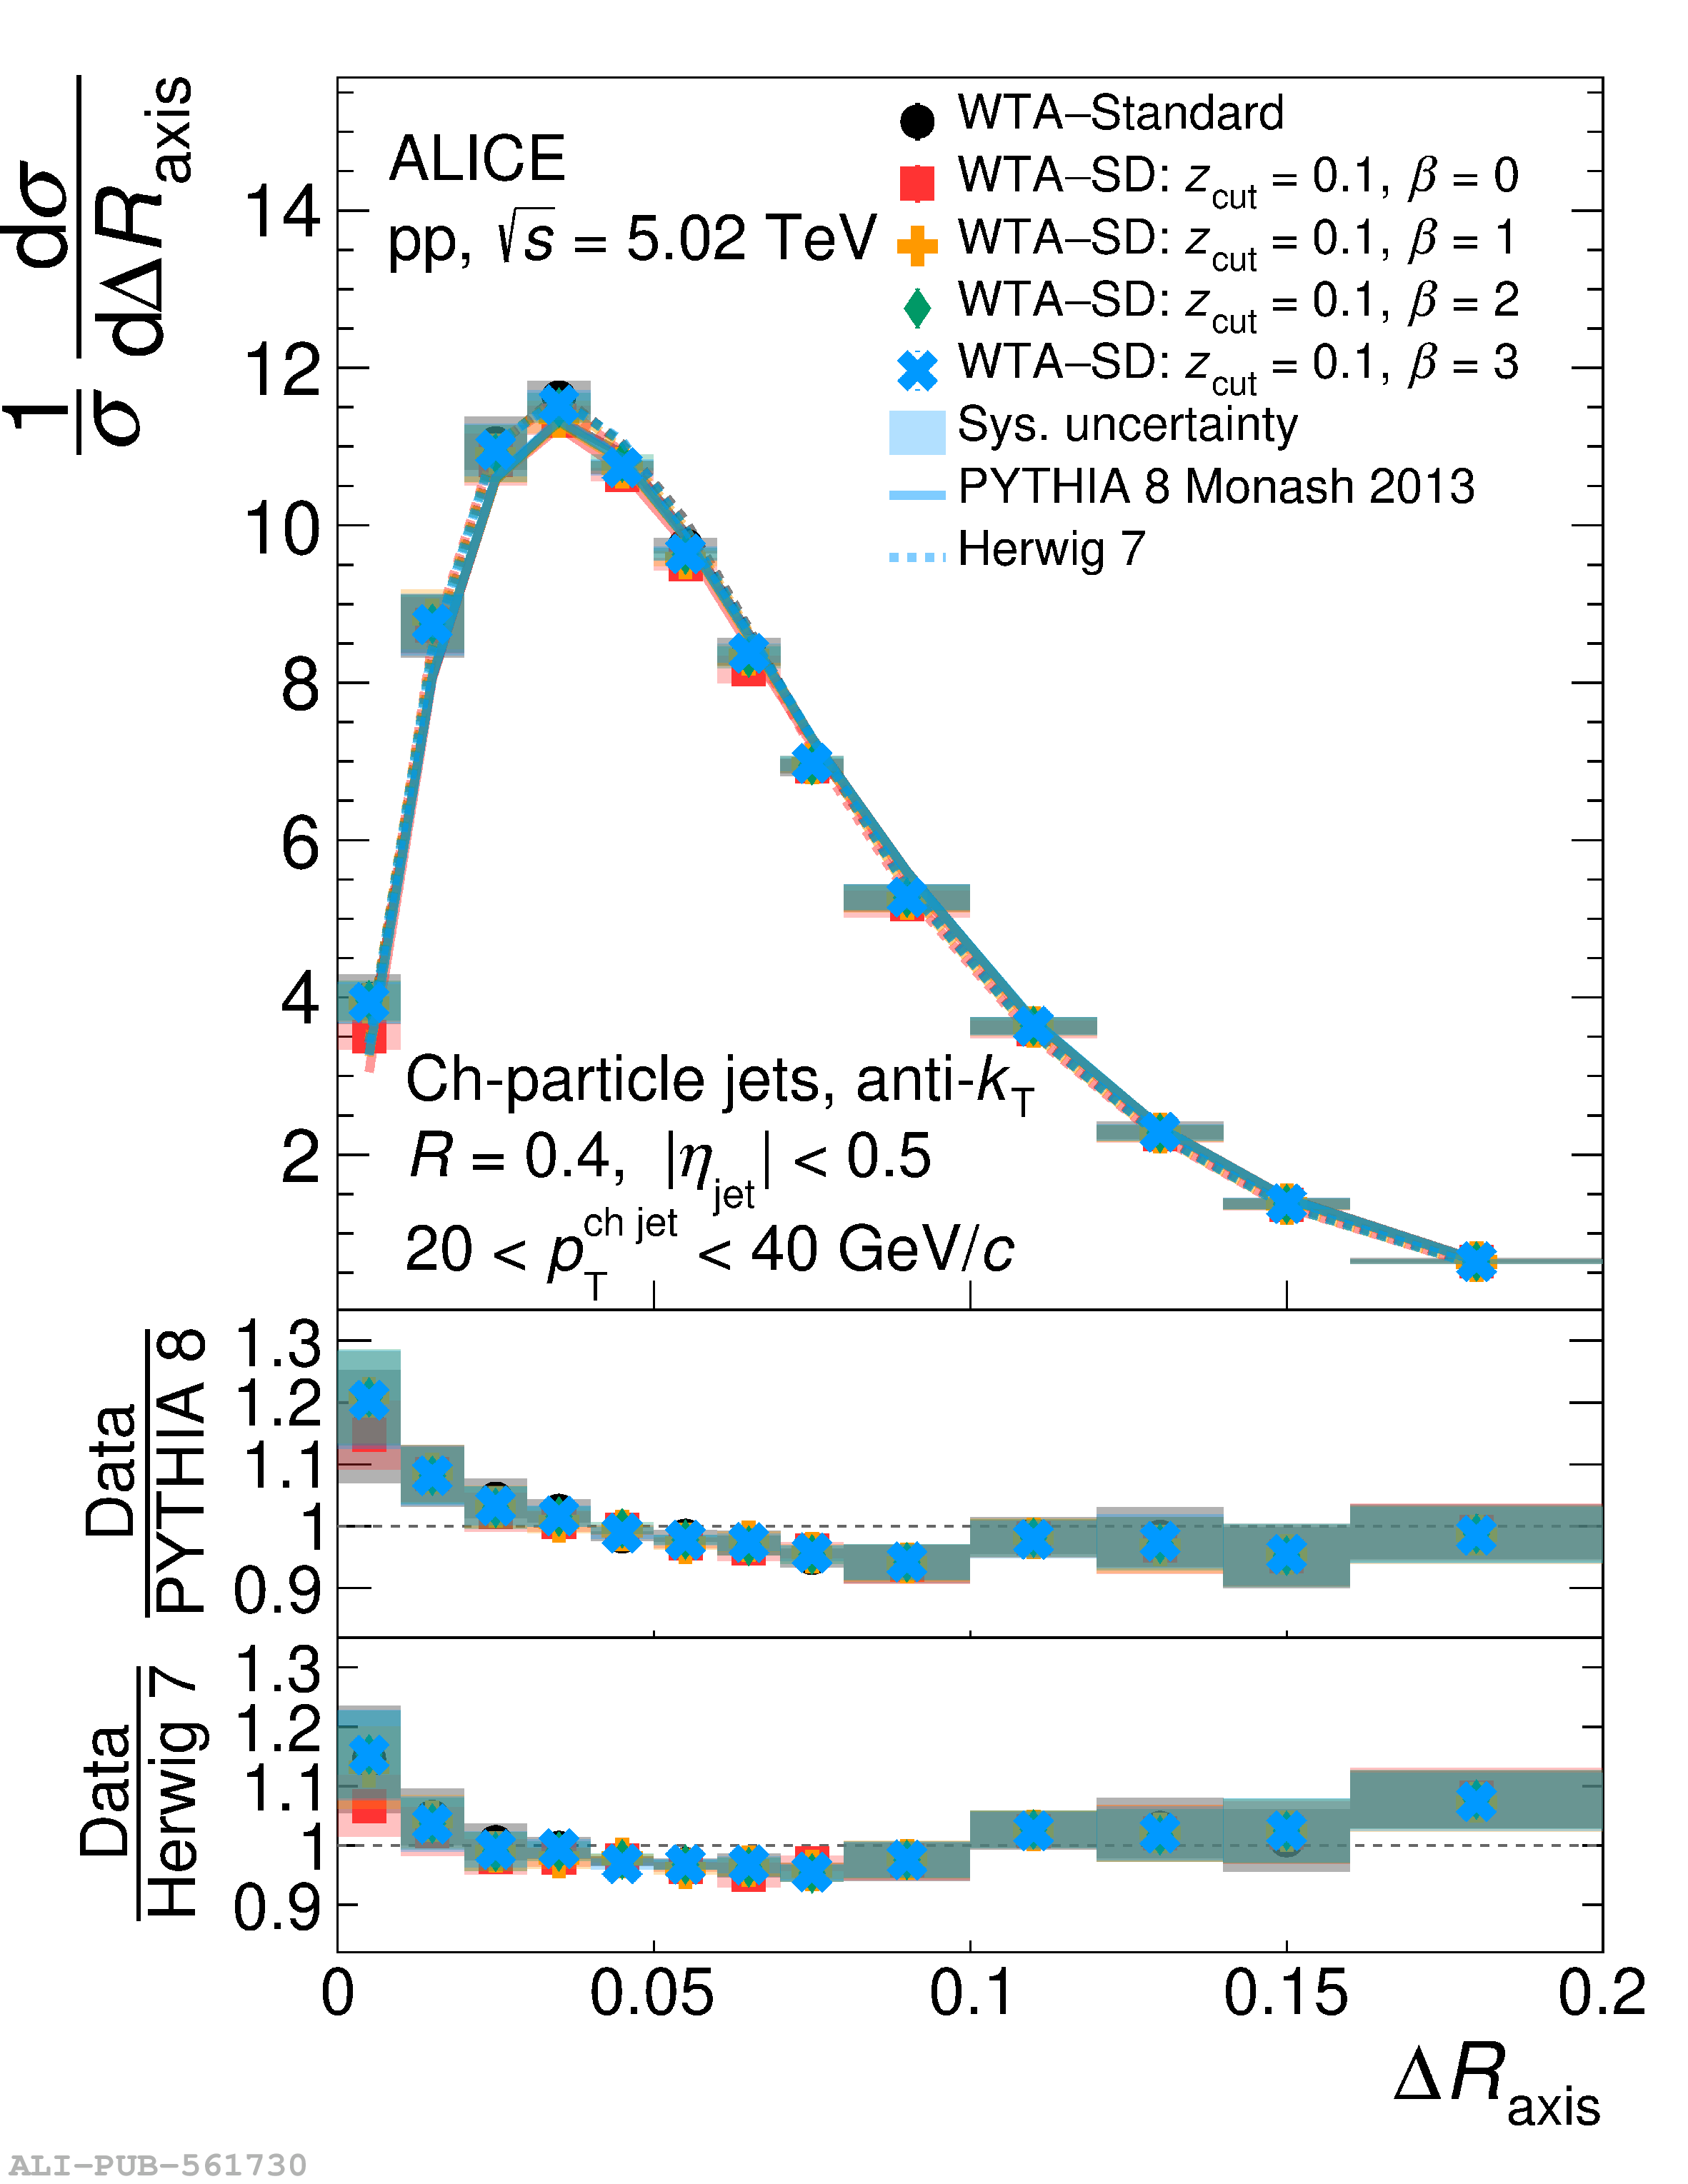 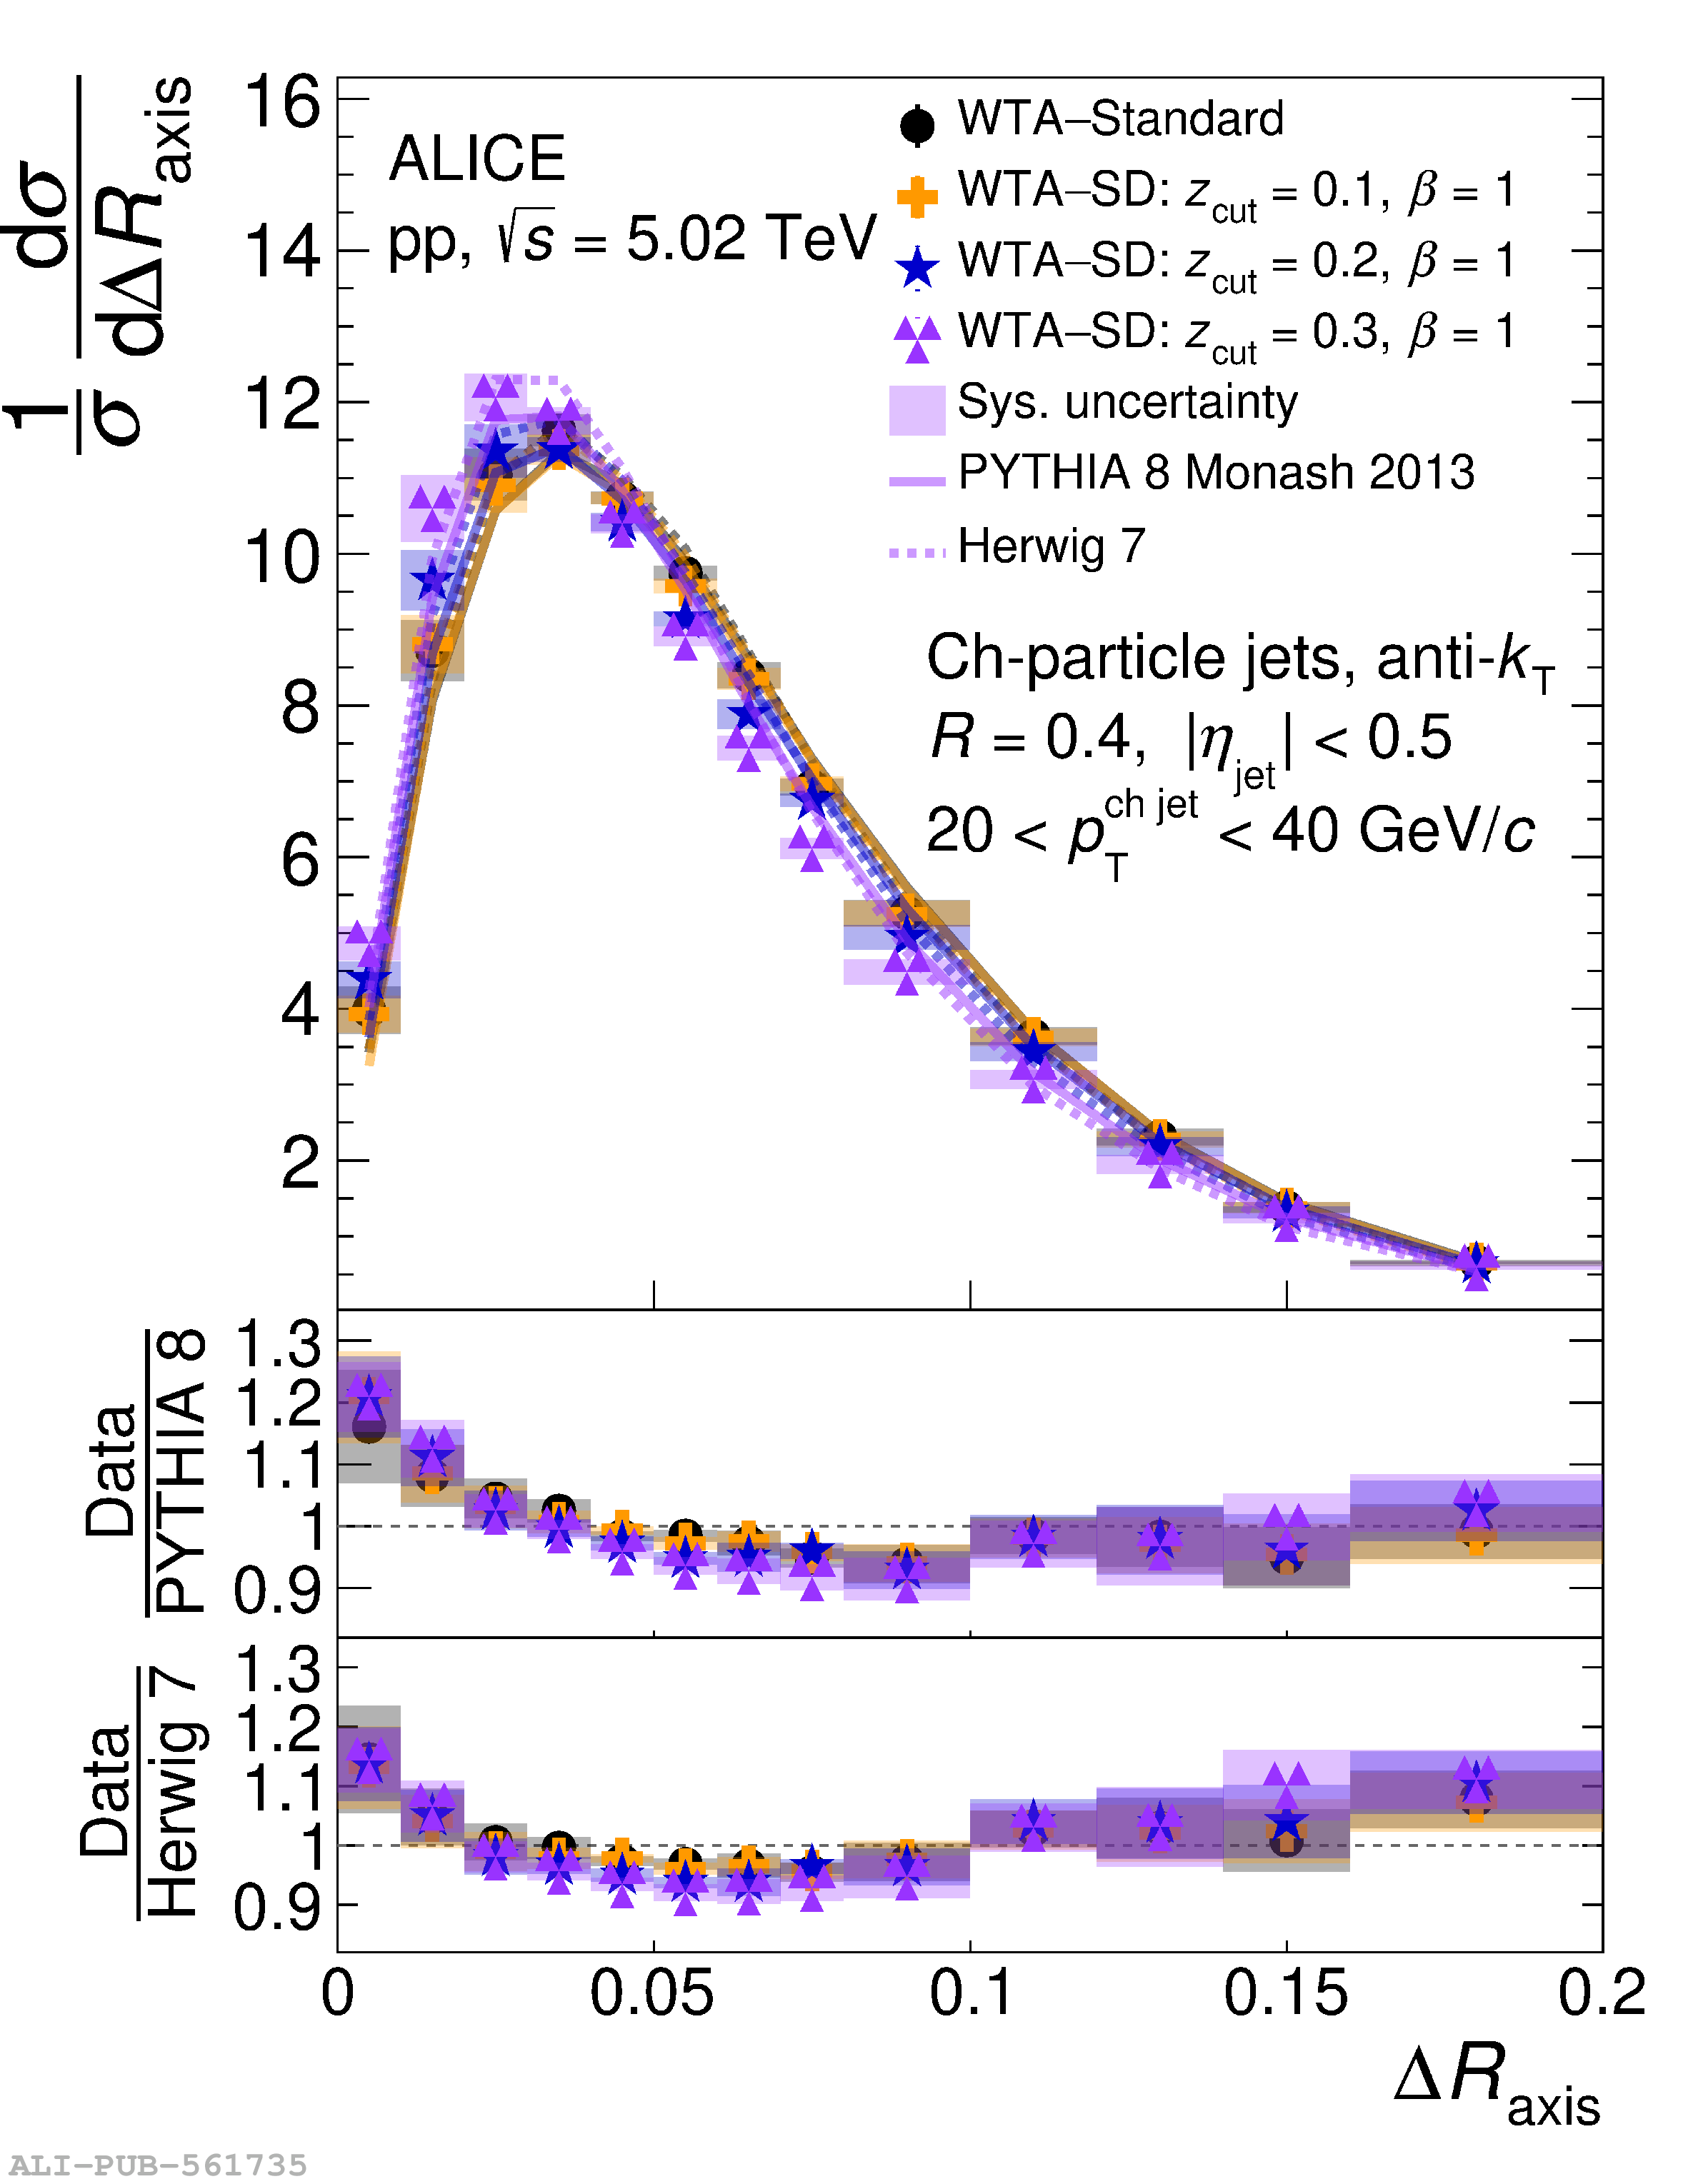 |
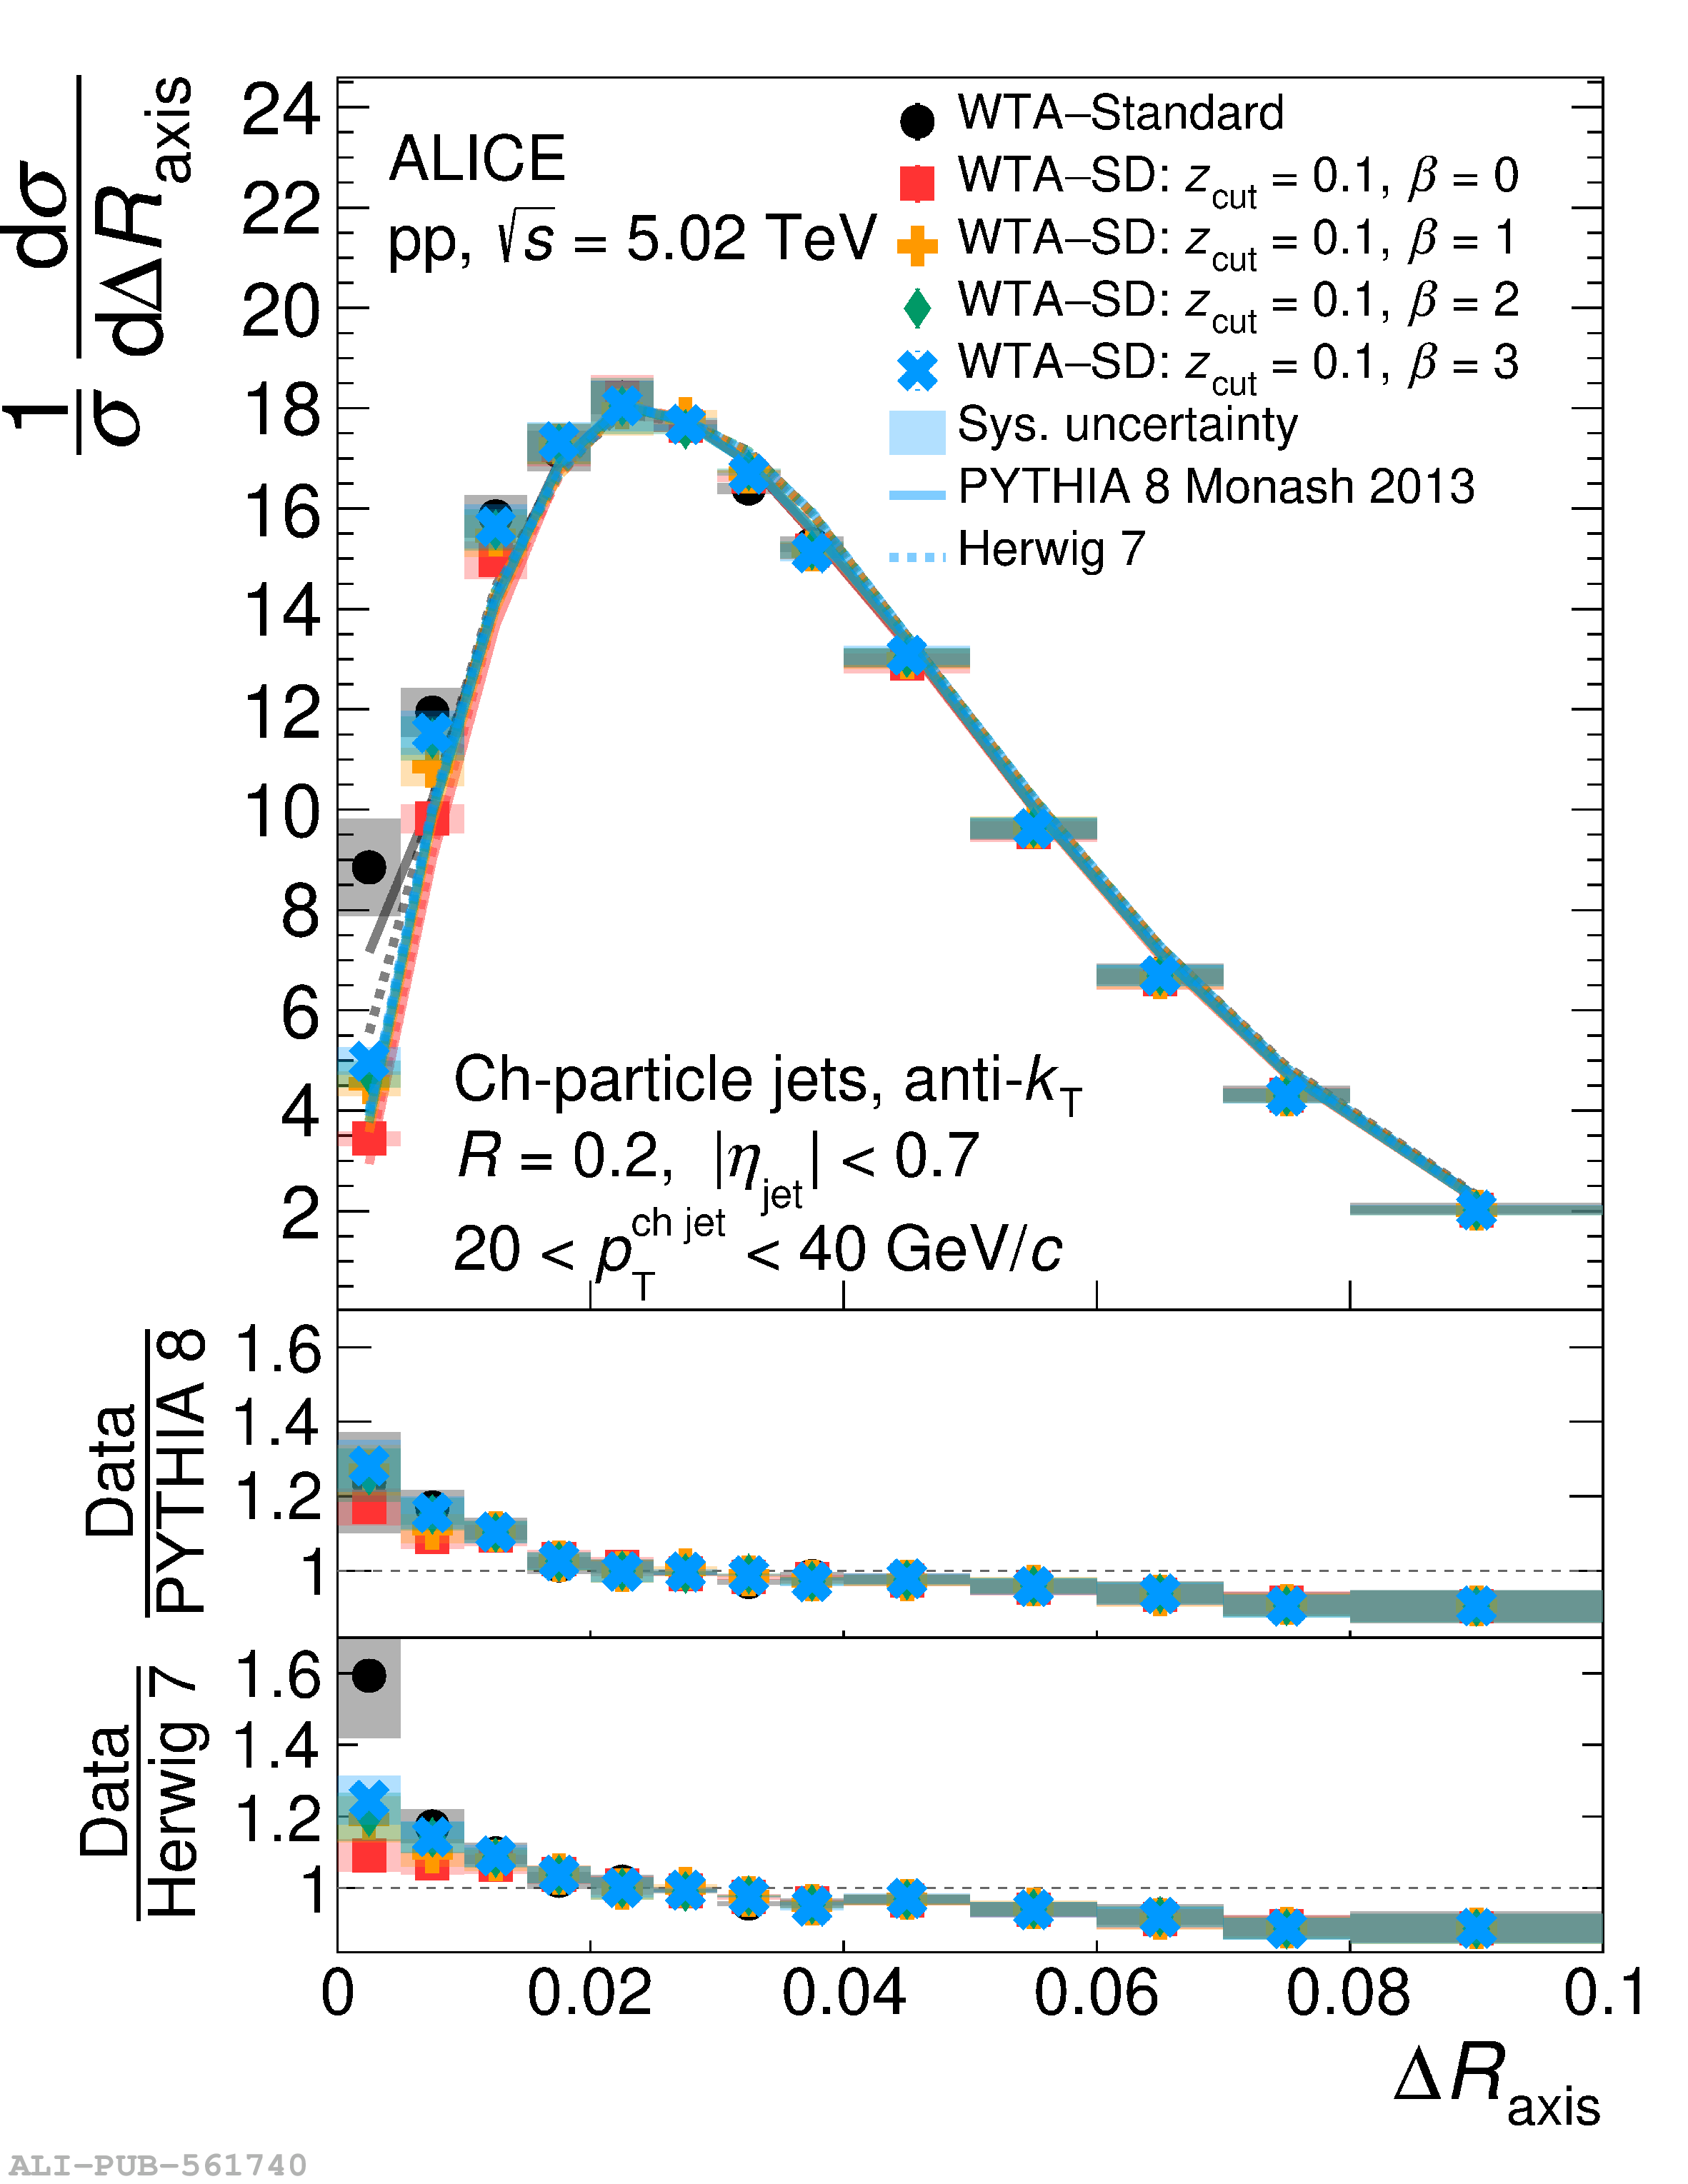
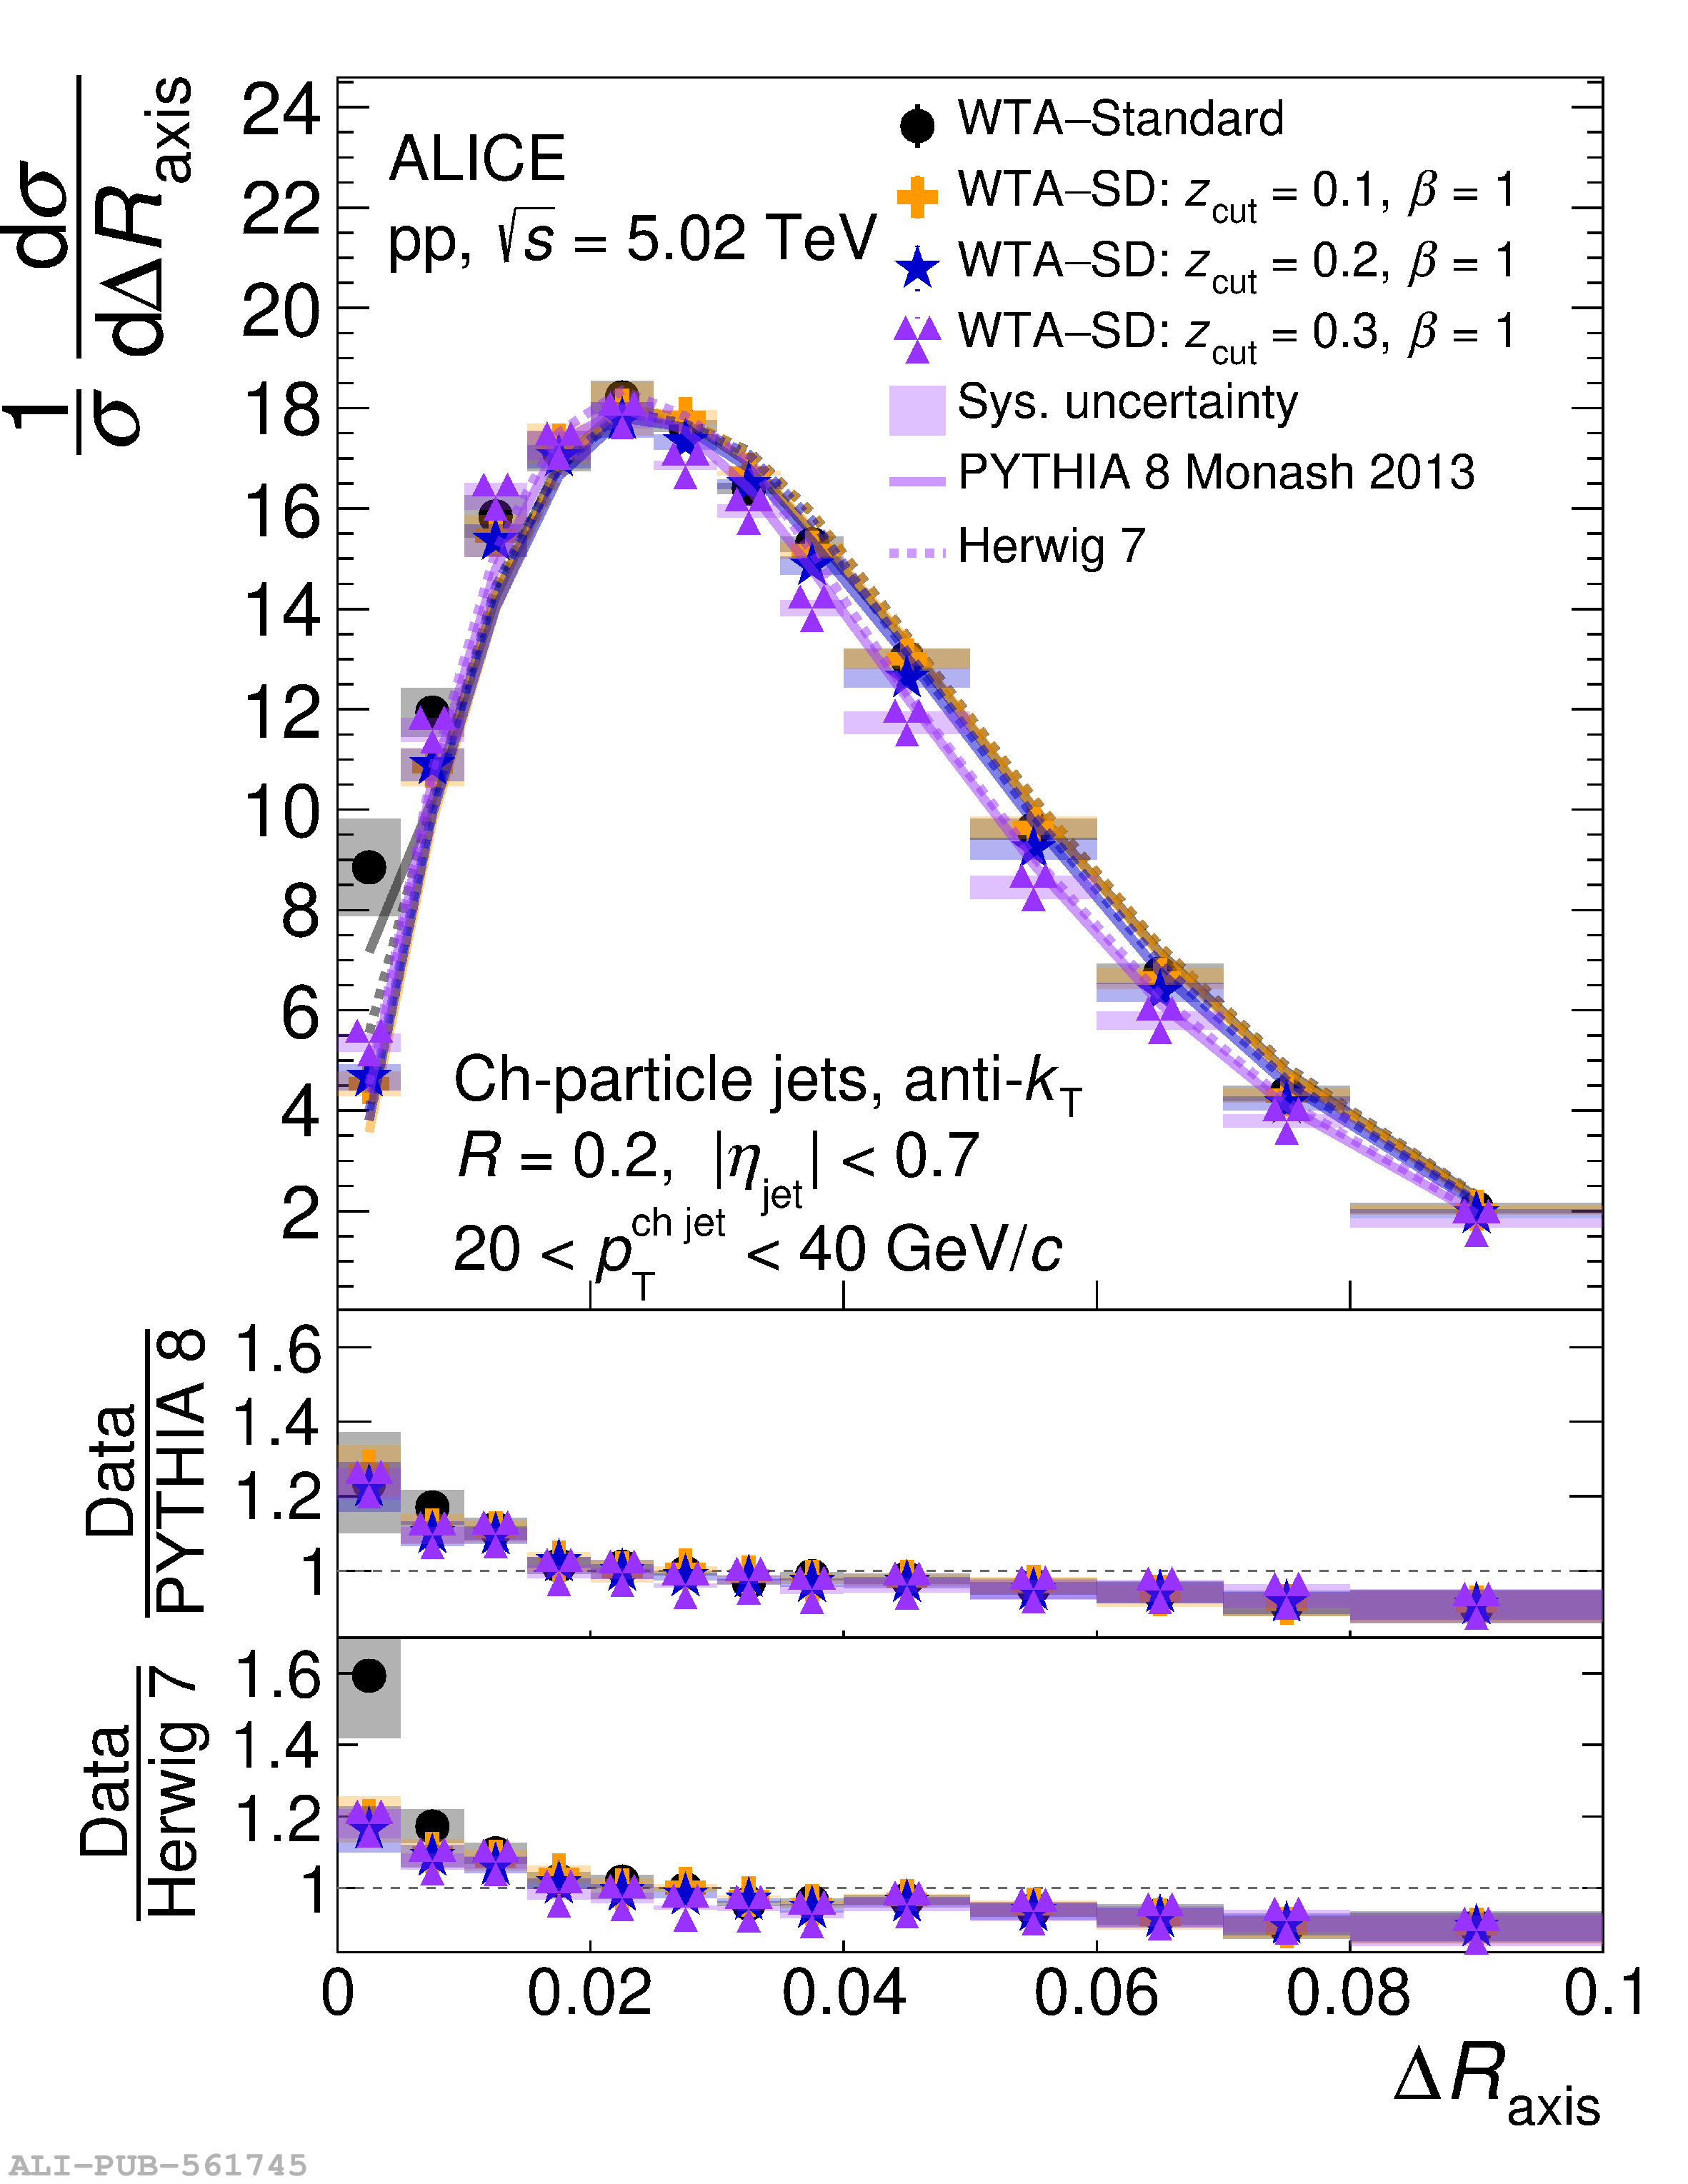
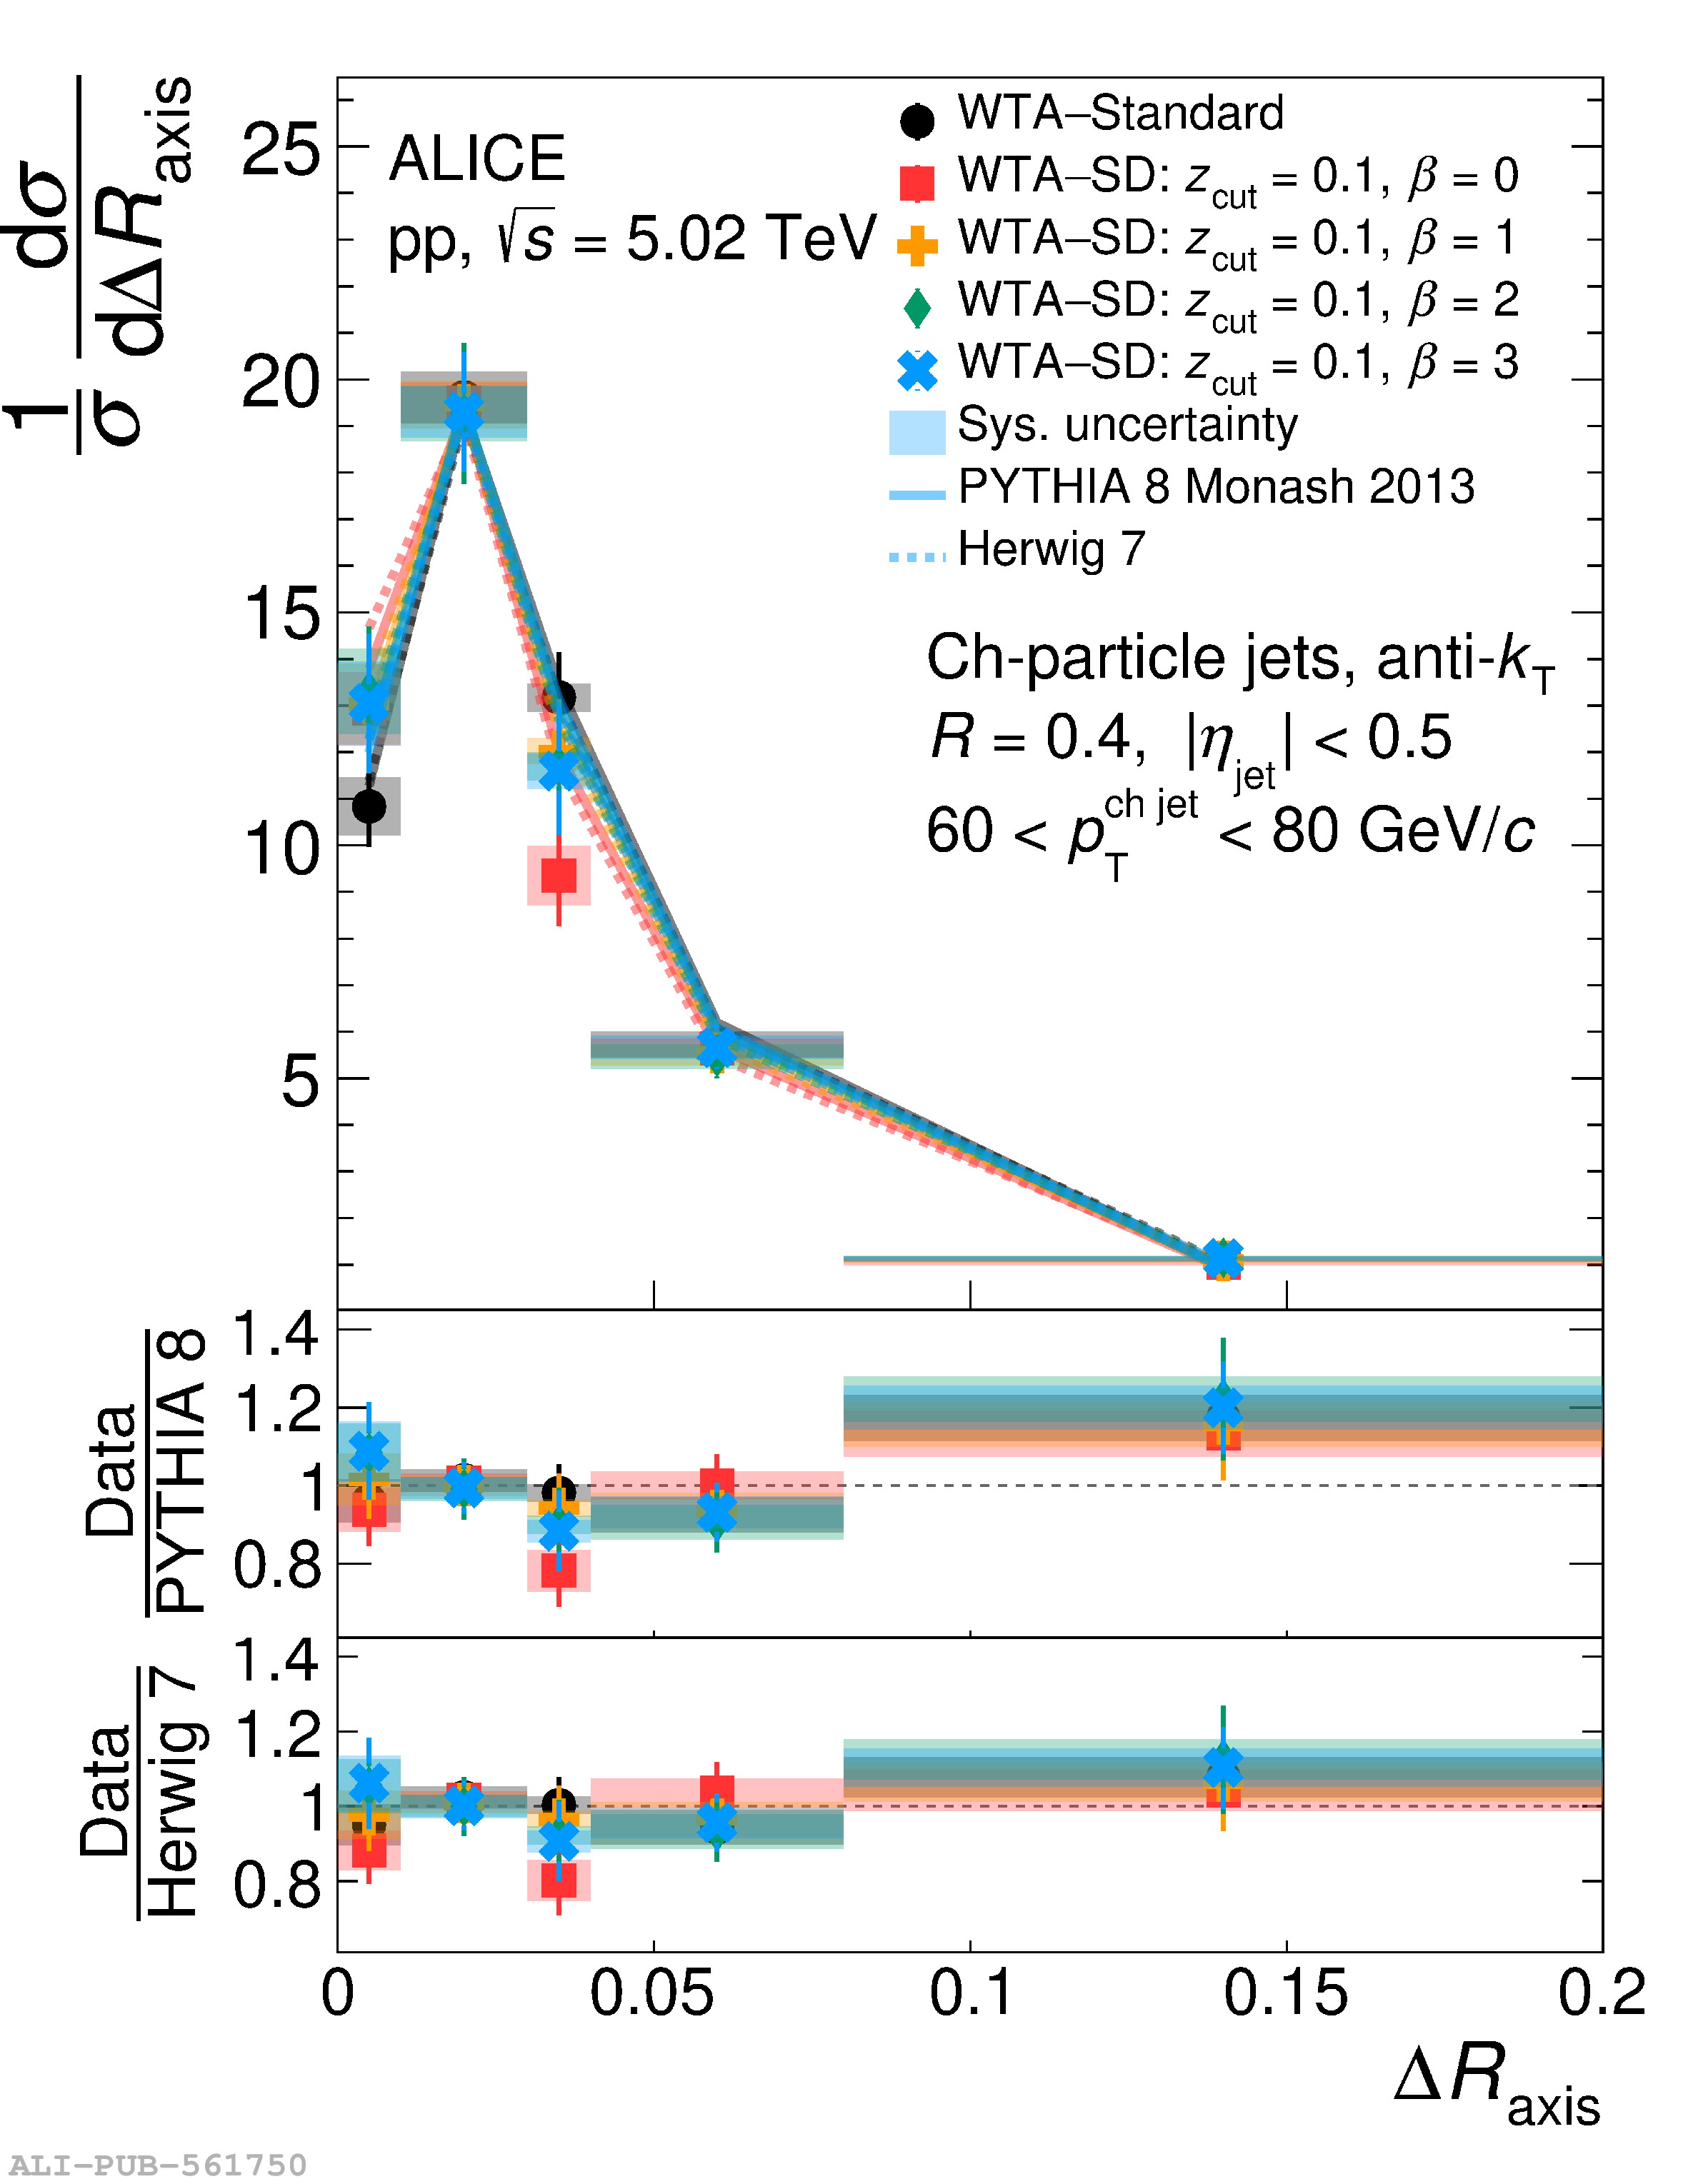
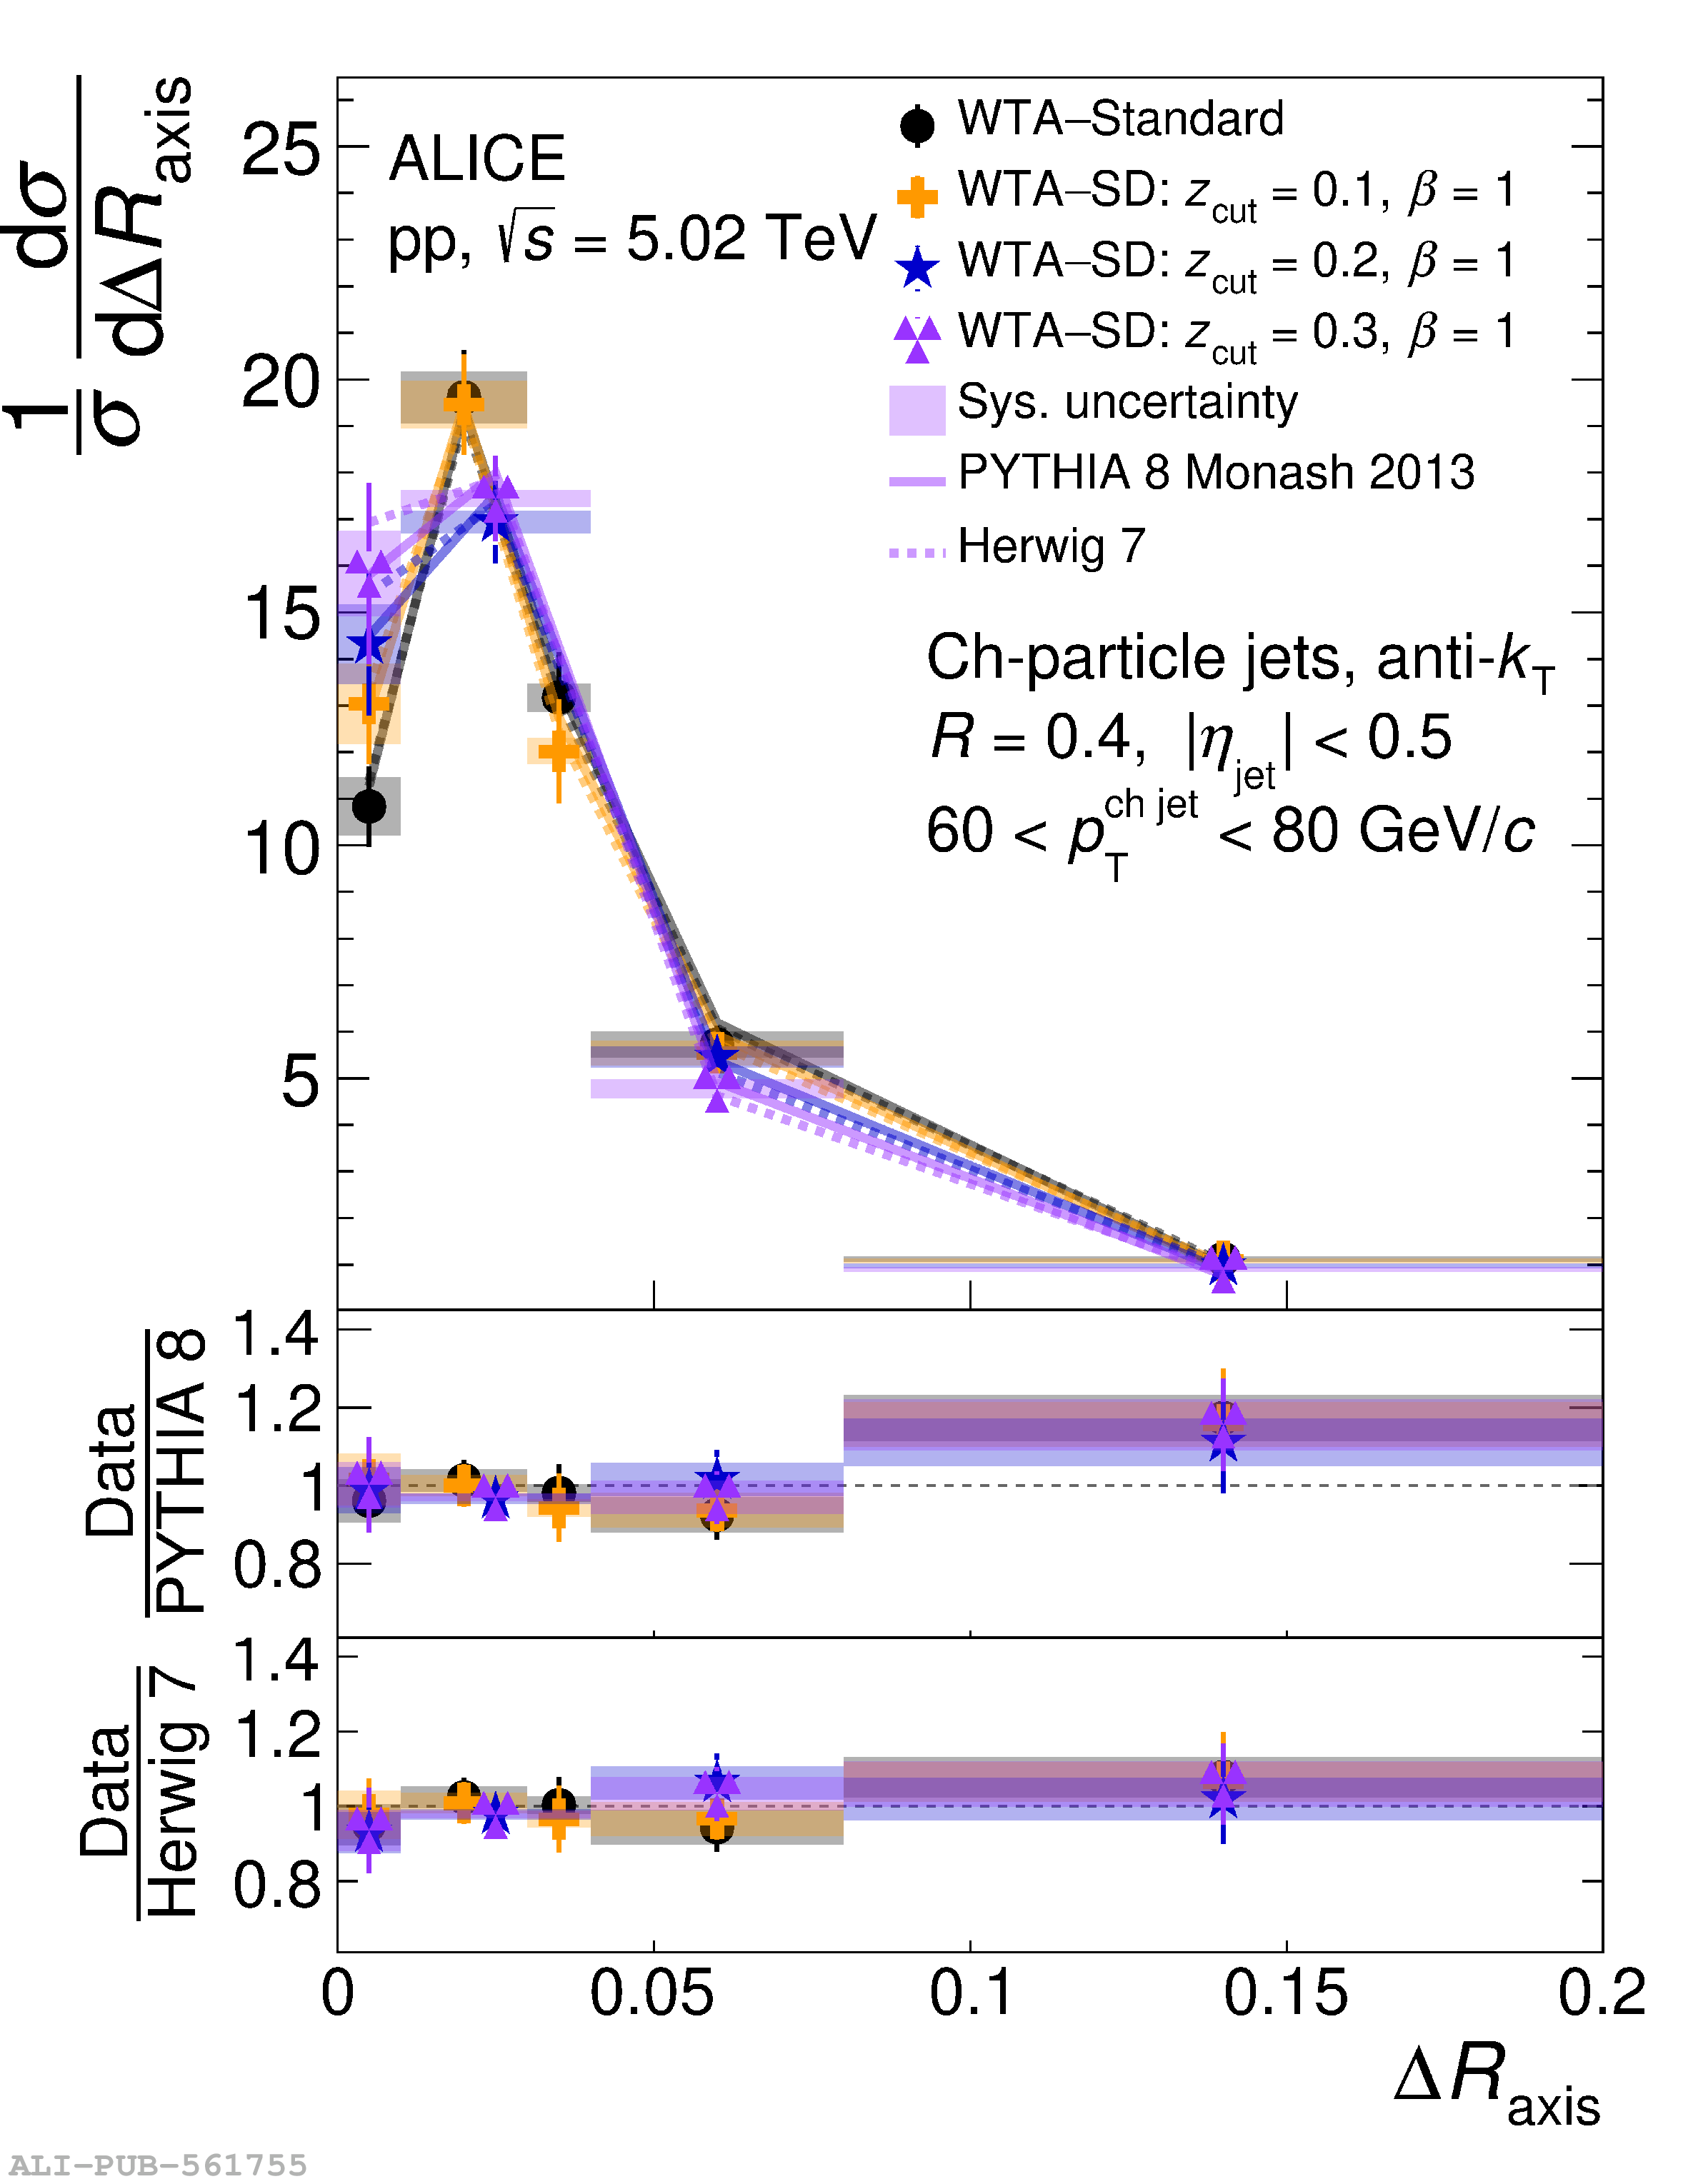
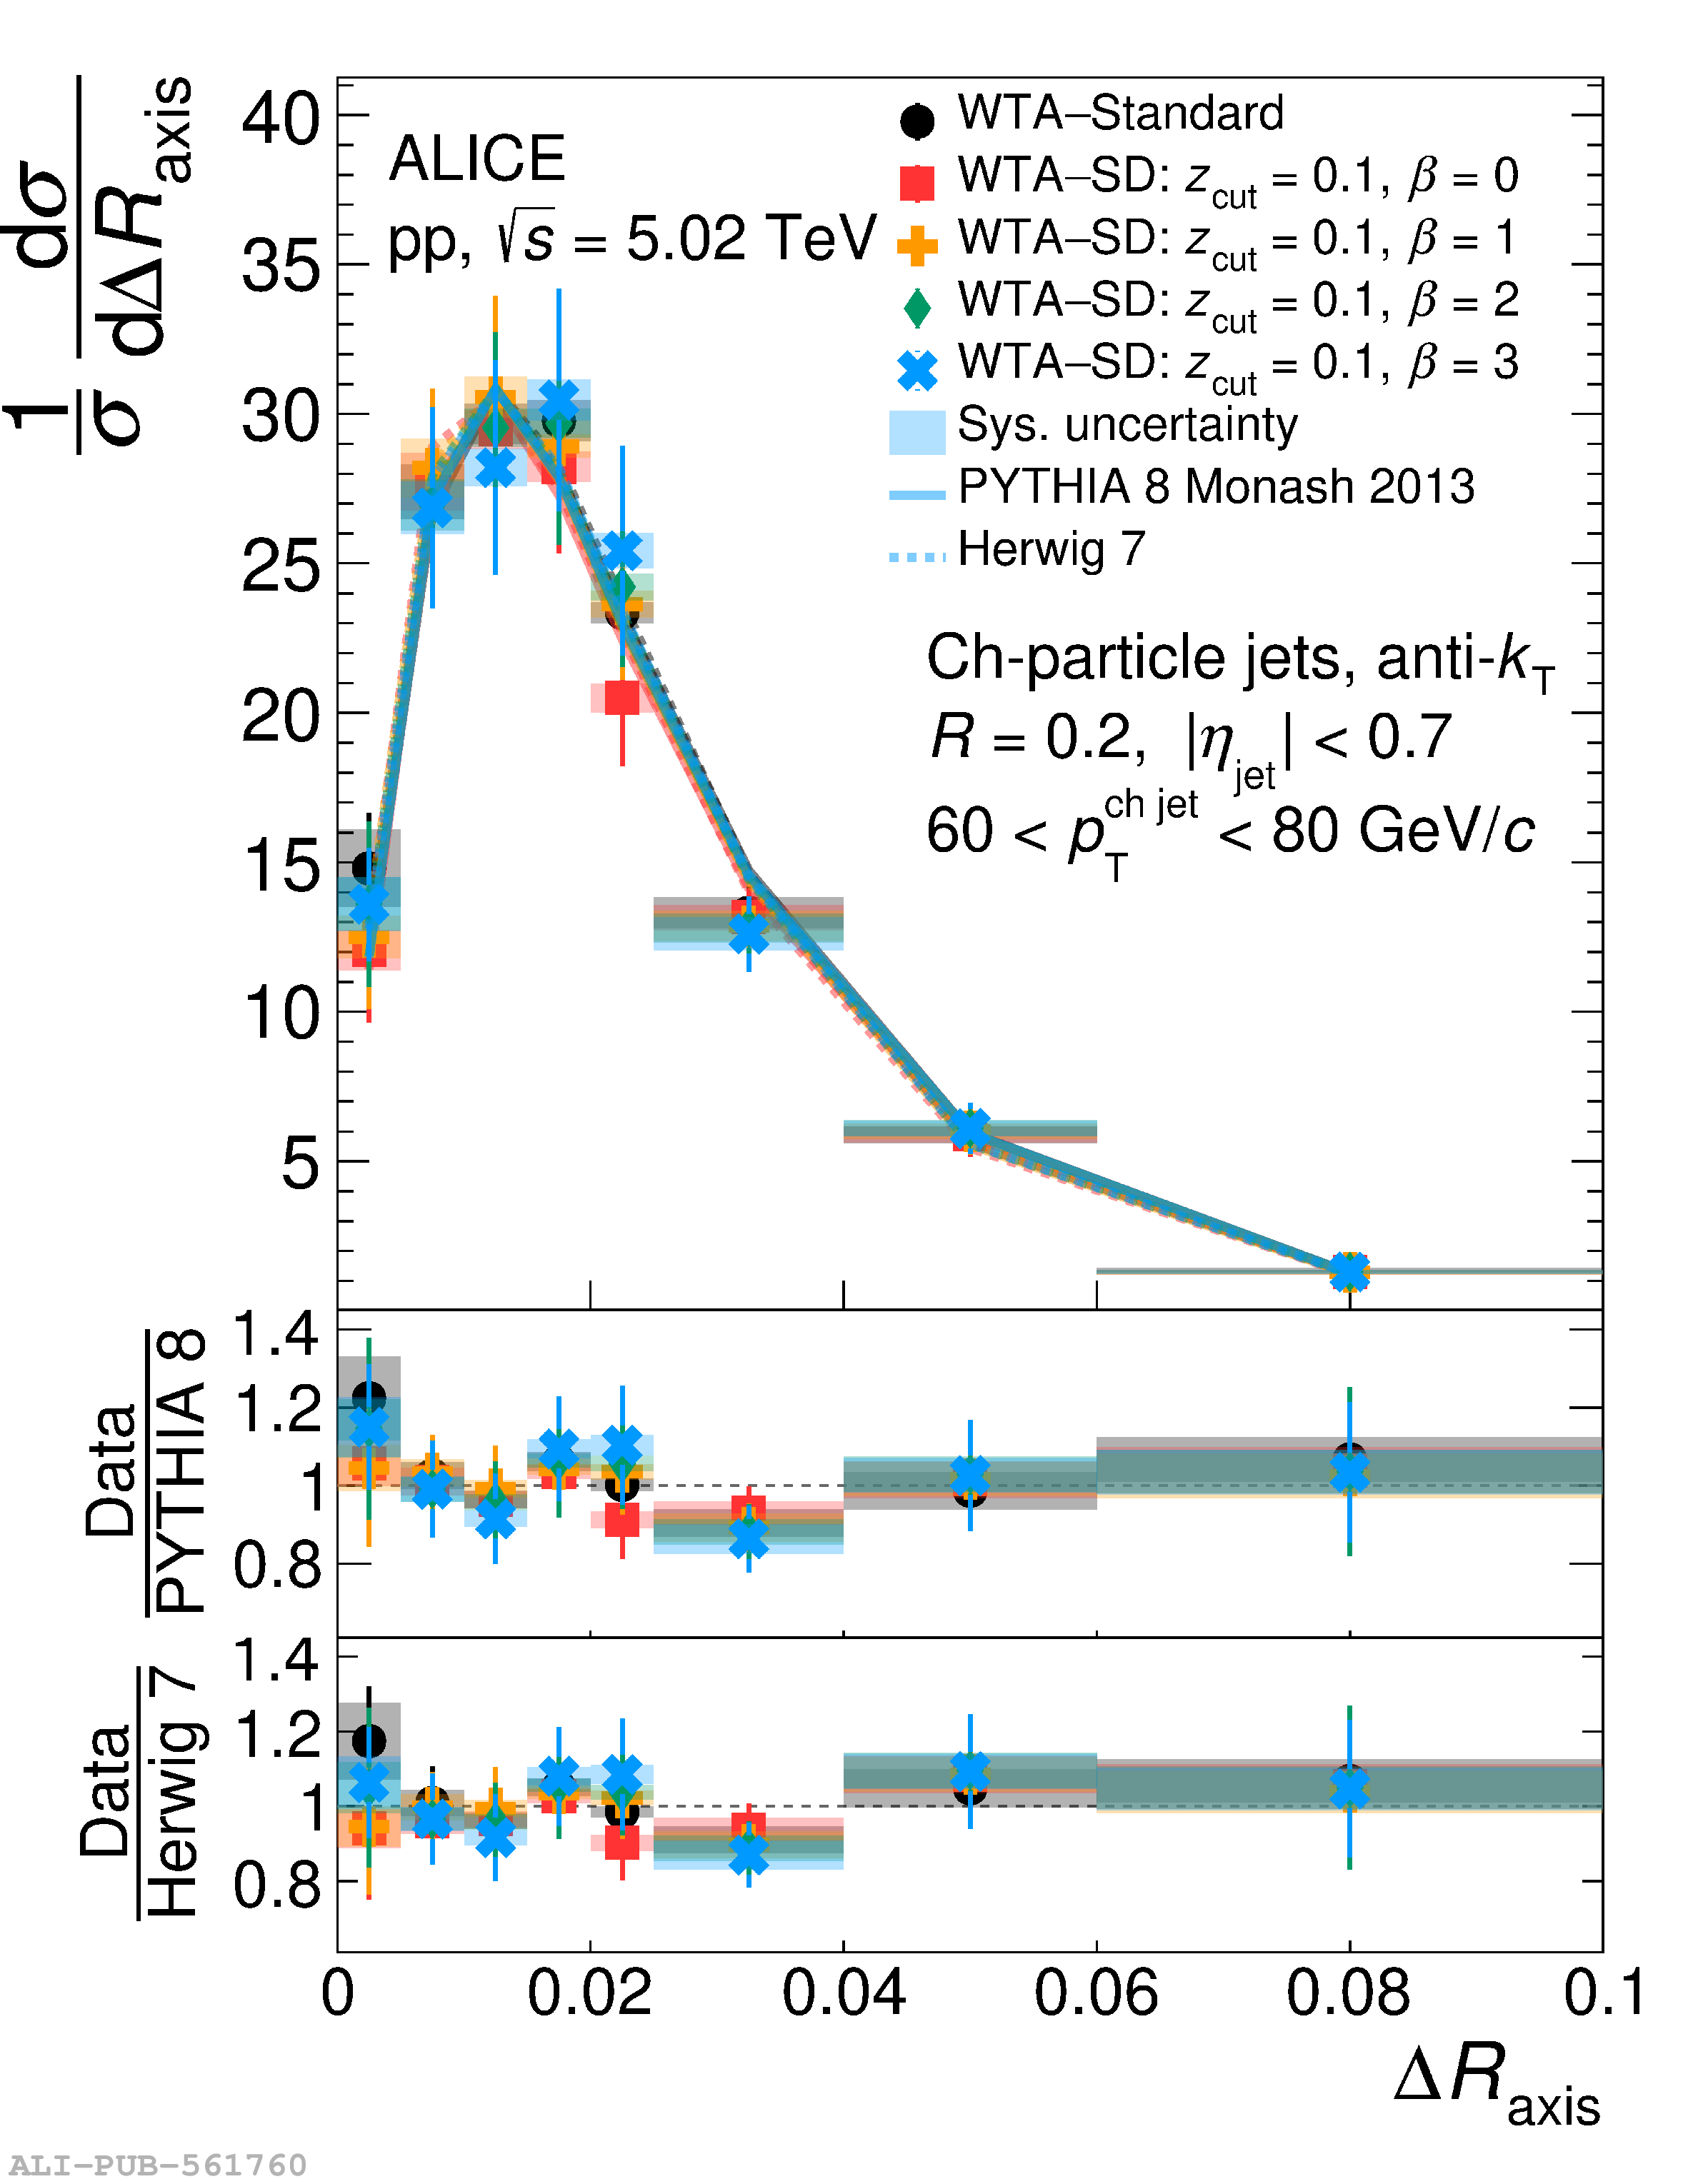
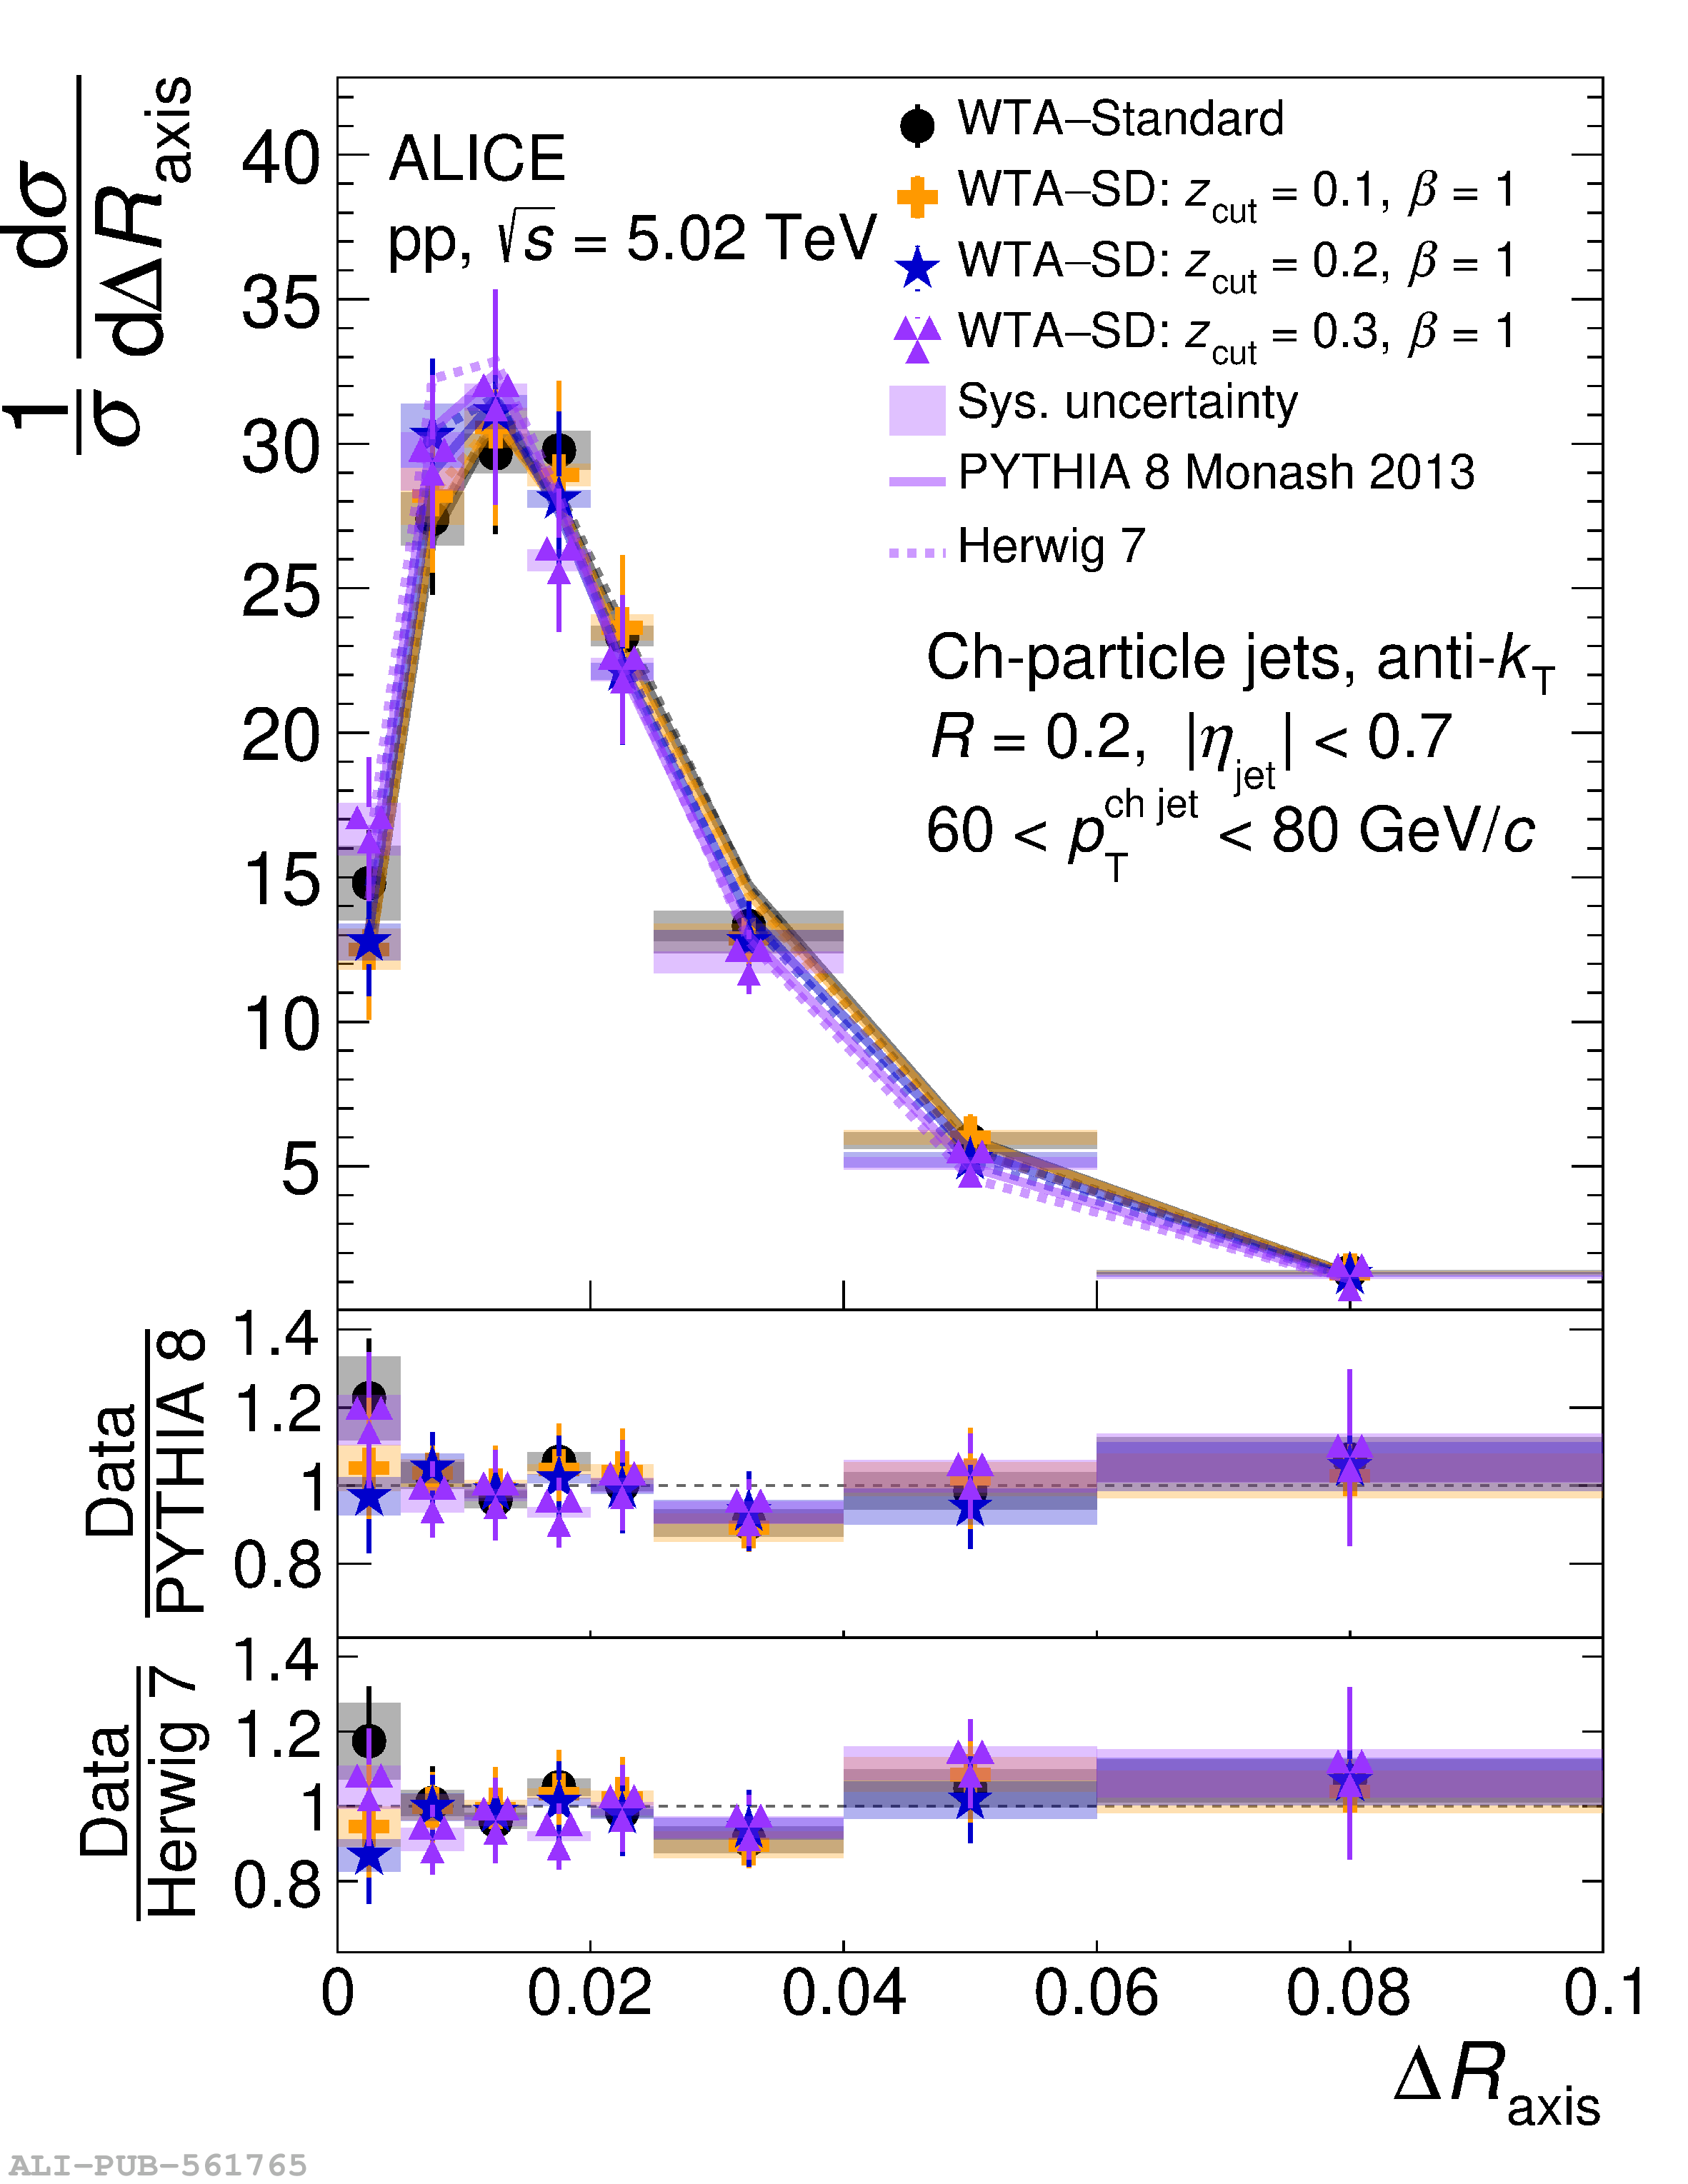
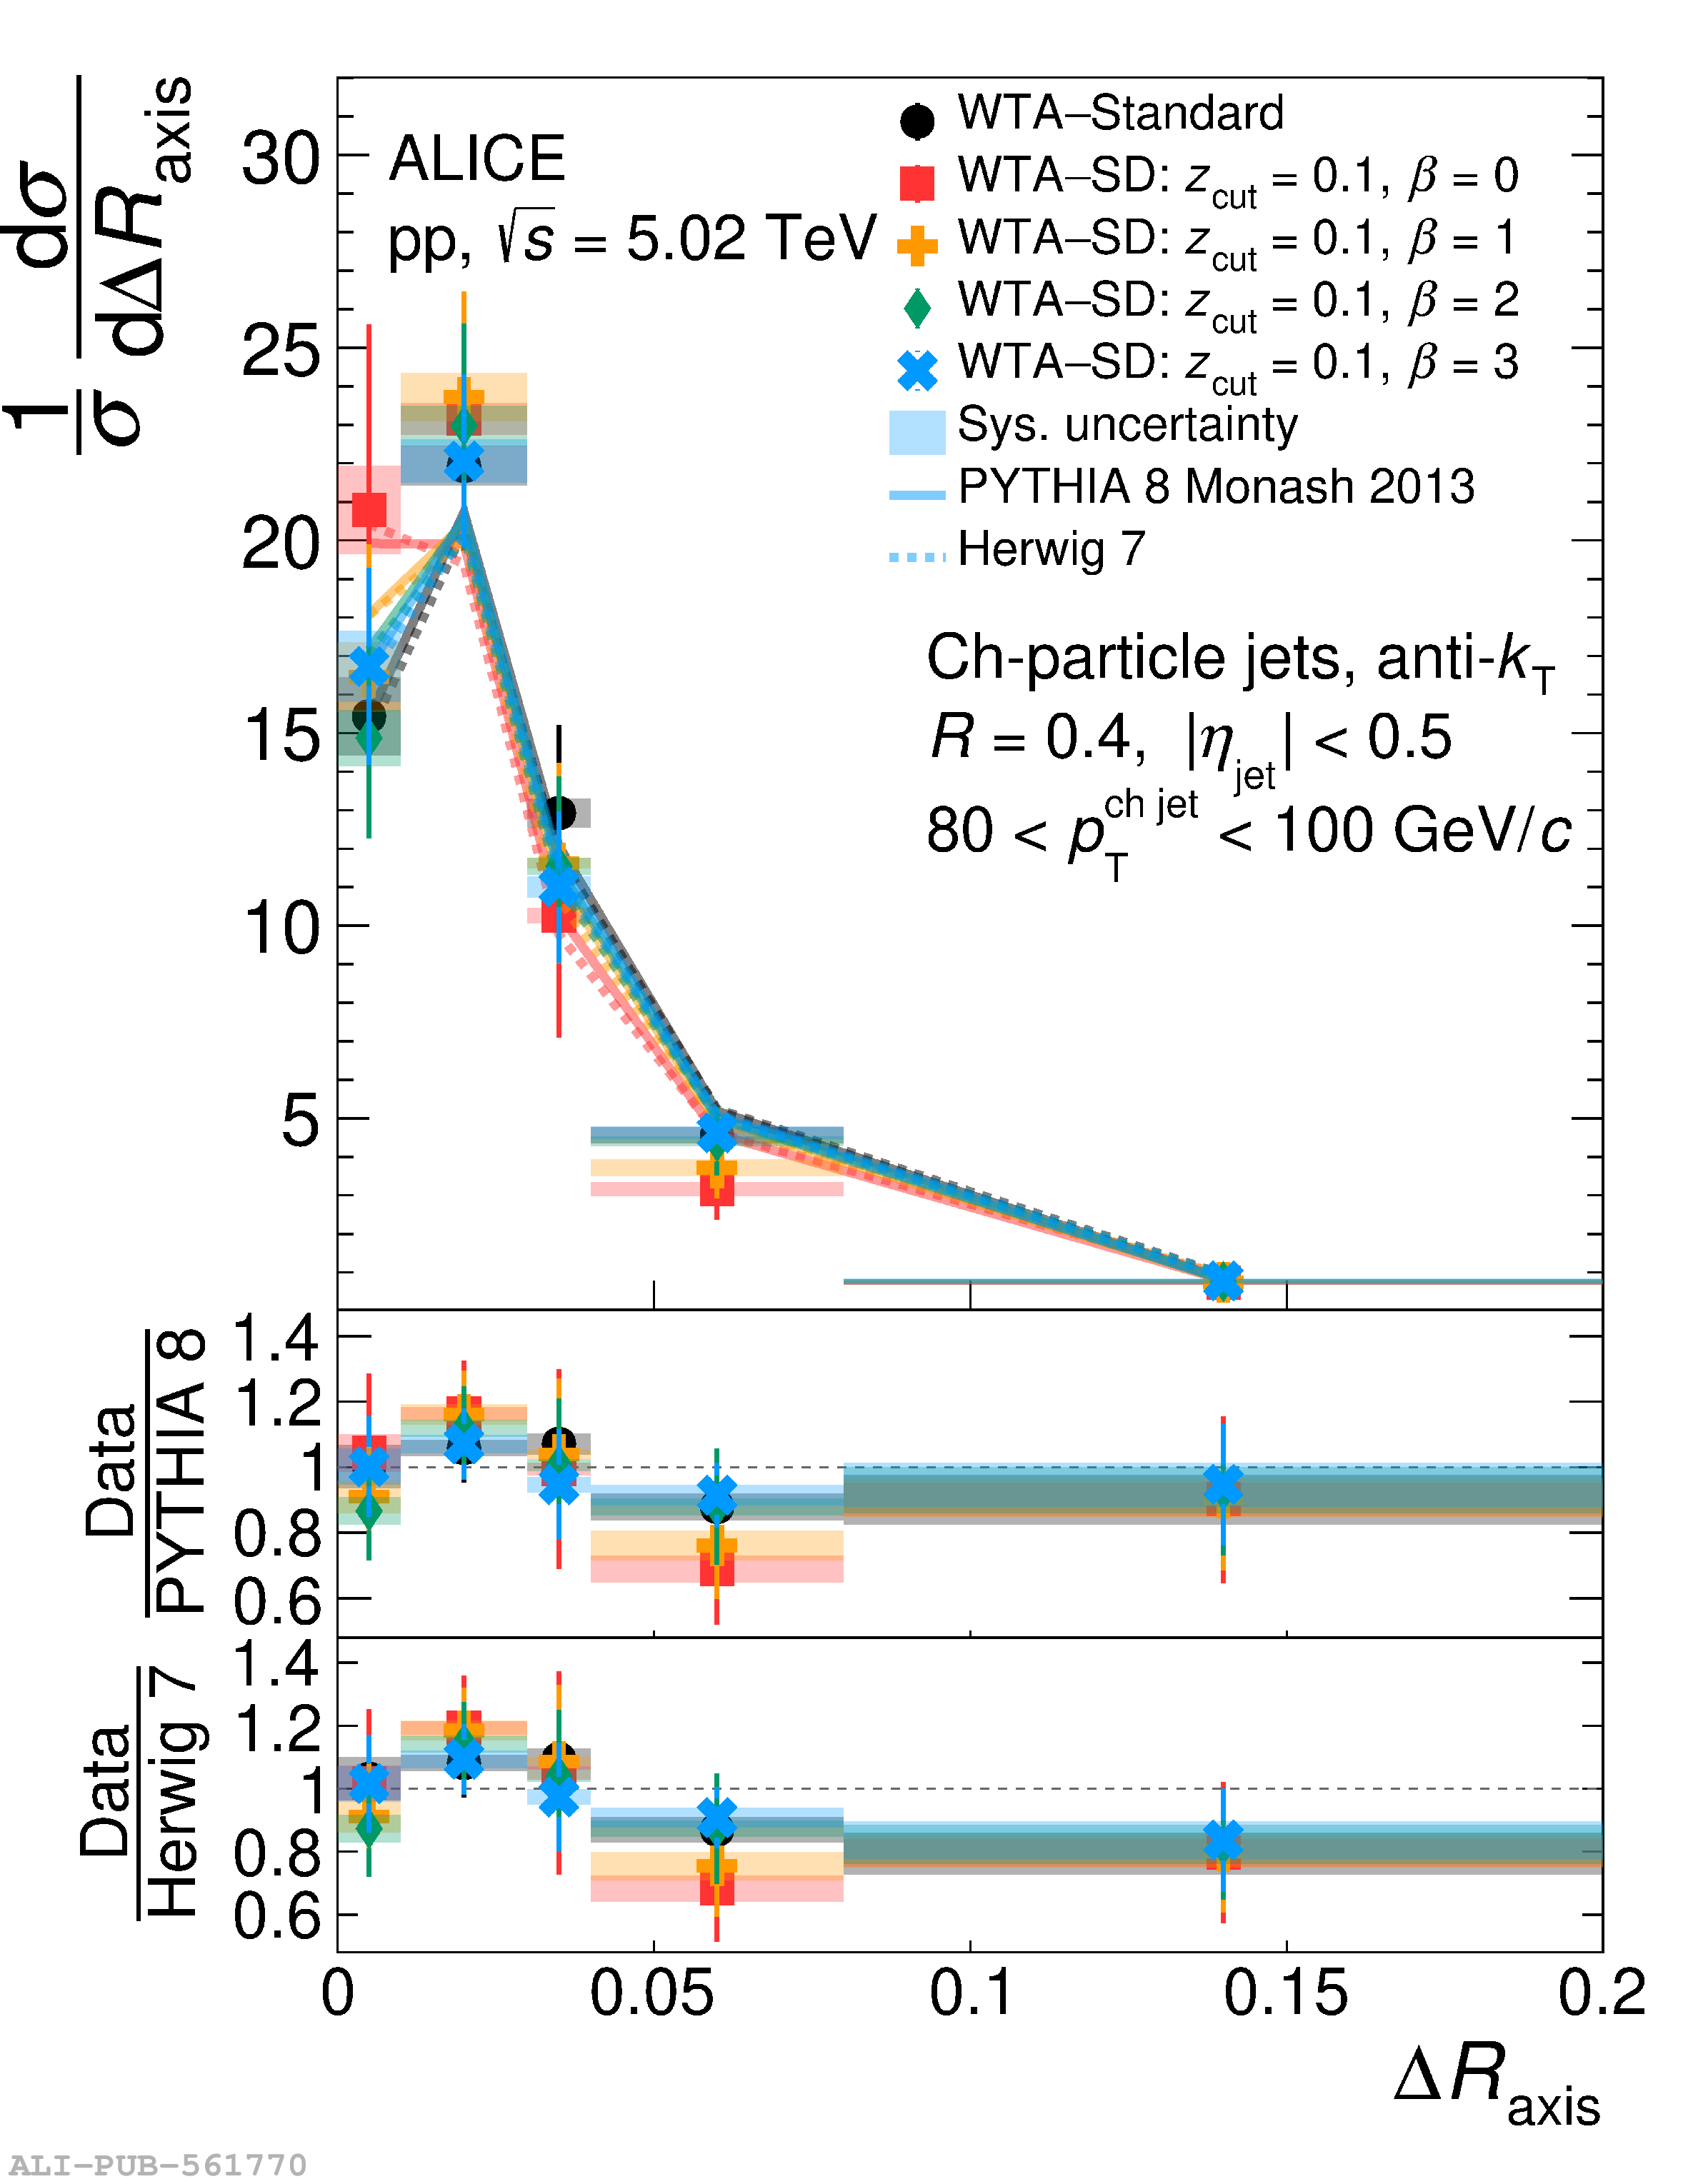
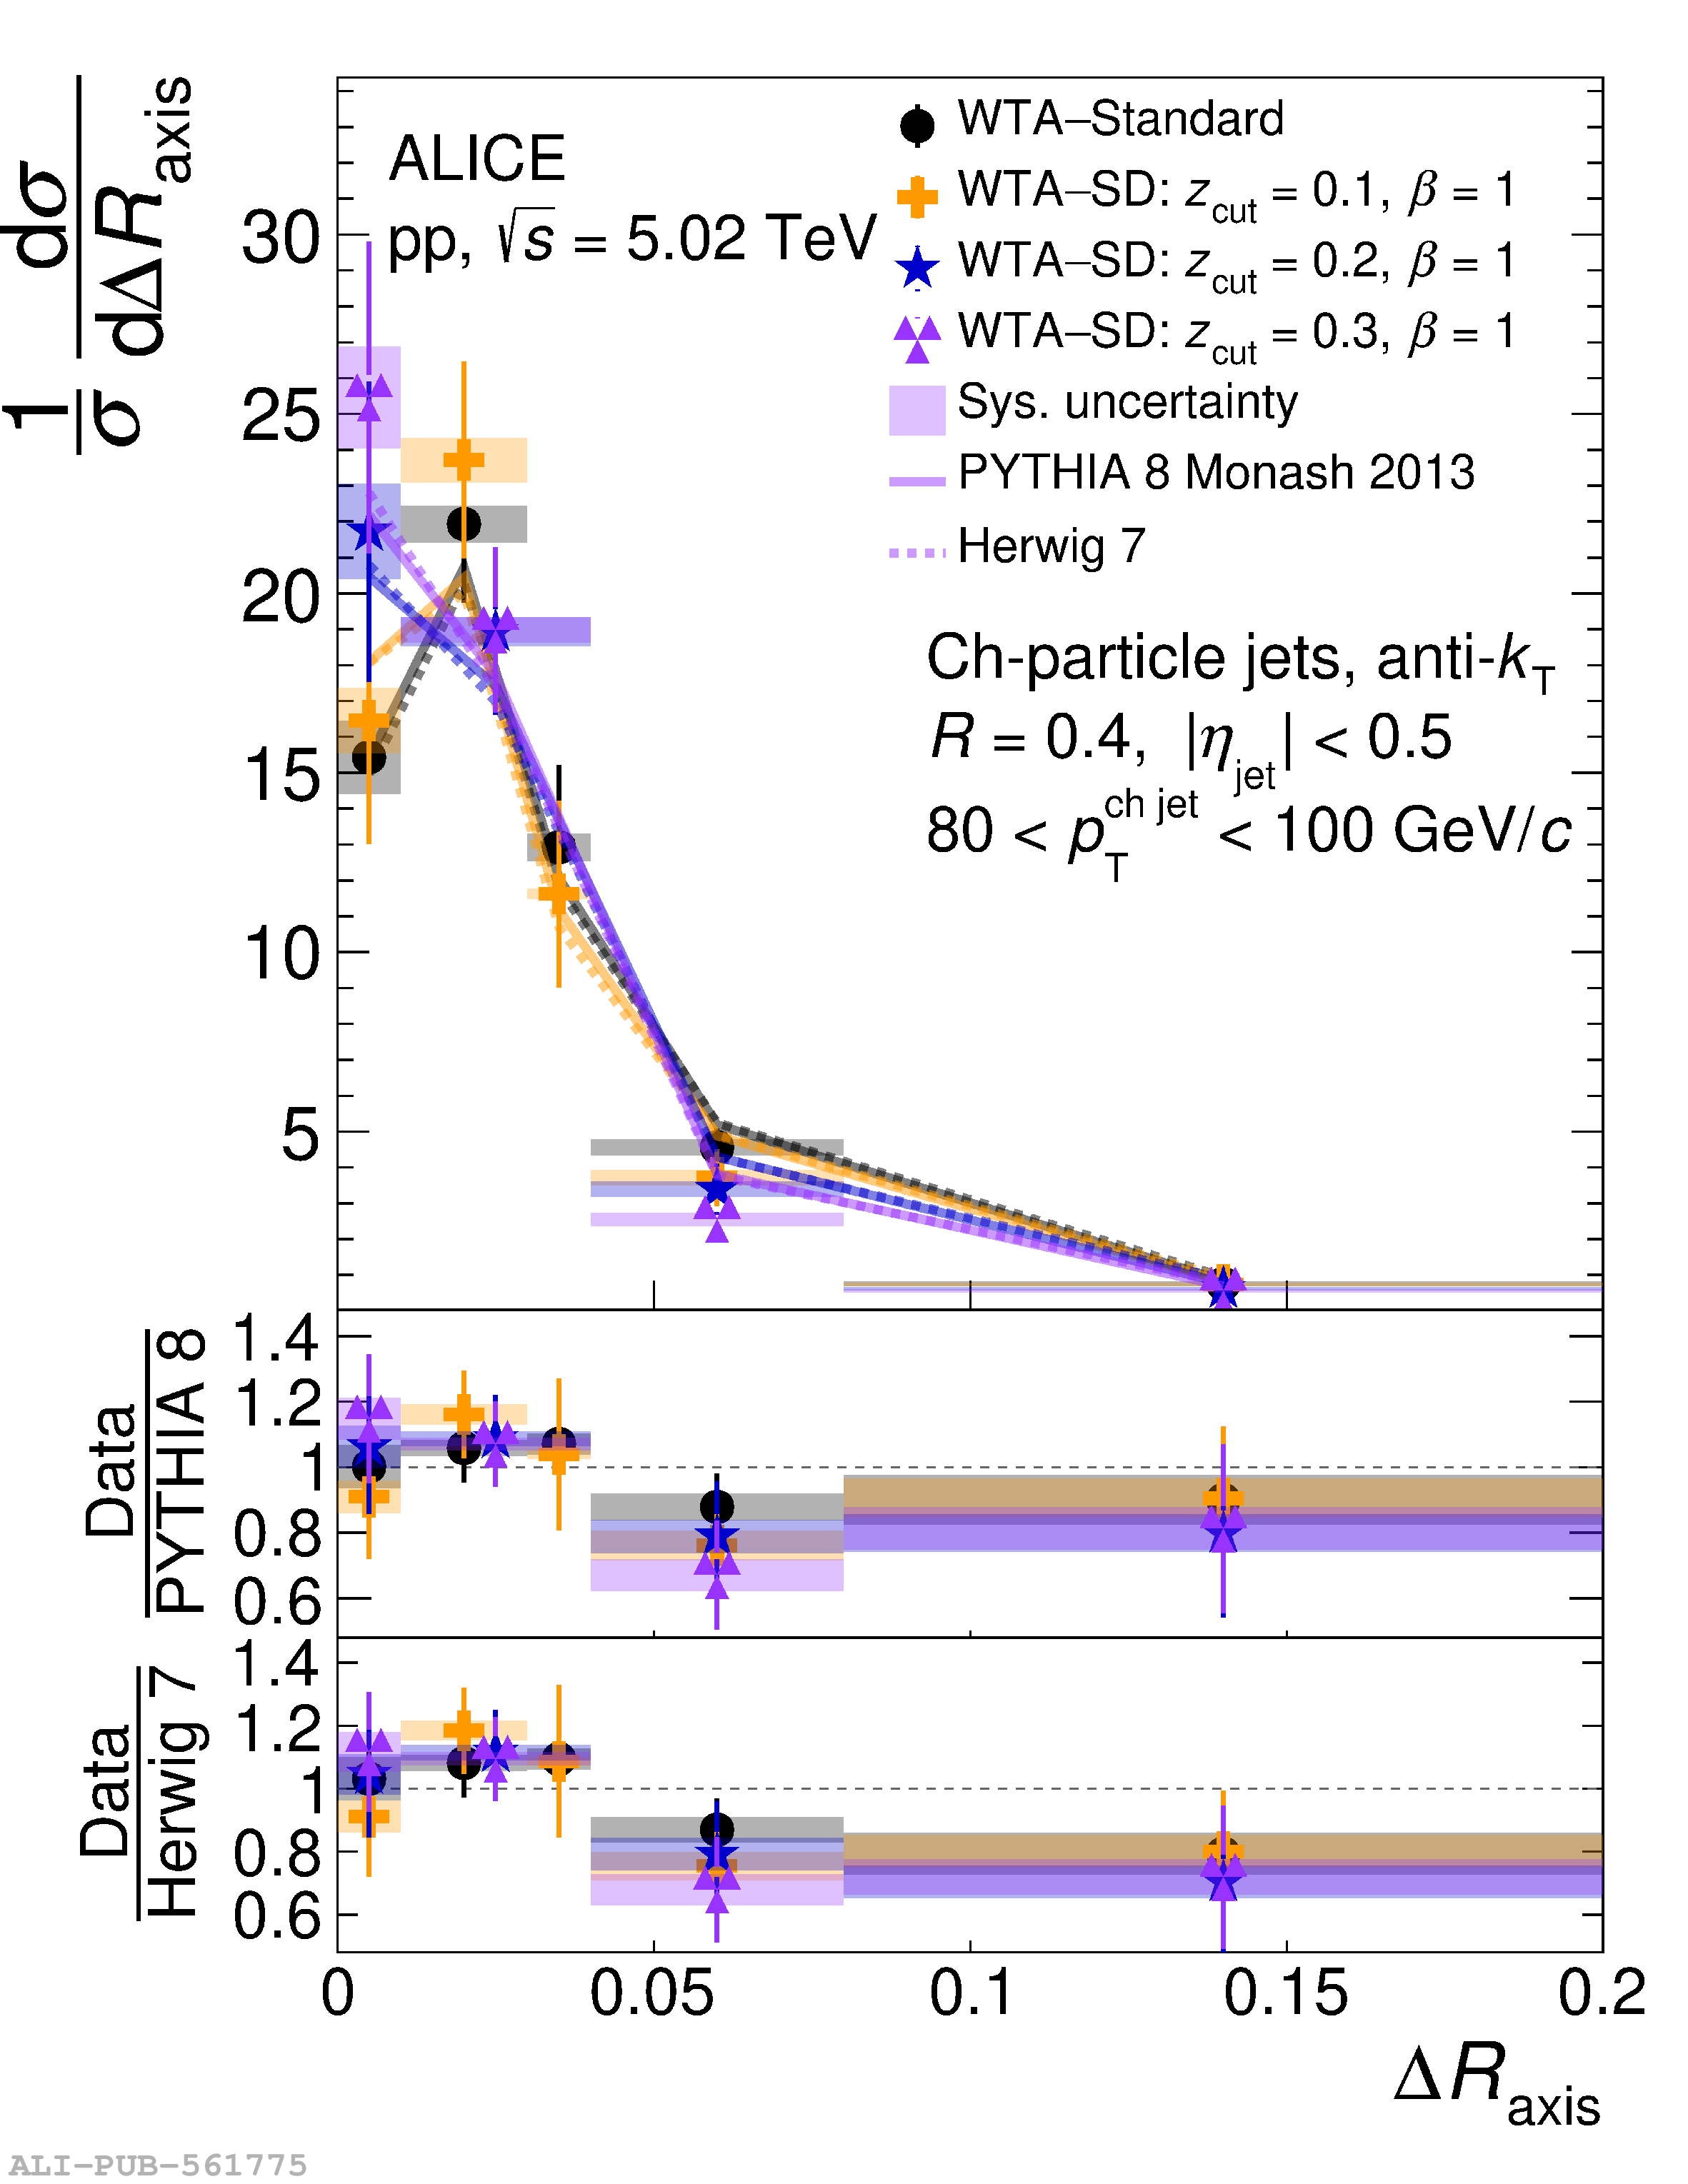


Figure A.7
Comparison between $\Delta R_{\rm axis}$ Standard$-$SD measured distributions and Monte Carlo event generators for jets of $R=0.4$ in $20< p_{\rm T}^{\rm jet} <40$ \GeVc. Left: distributions with $z_{\rm cut}=0.1$ and varying $\beta$. Right: distributions with $\beta=1$ and varying $z_{\rm cut}$. | 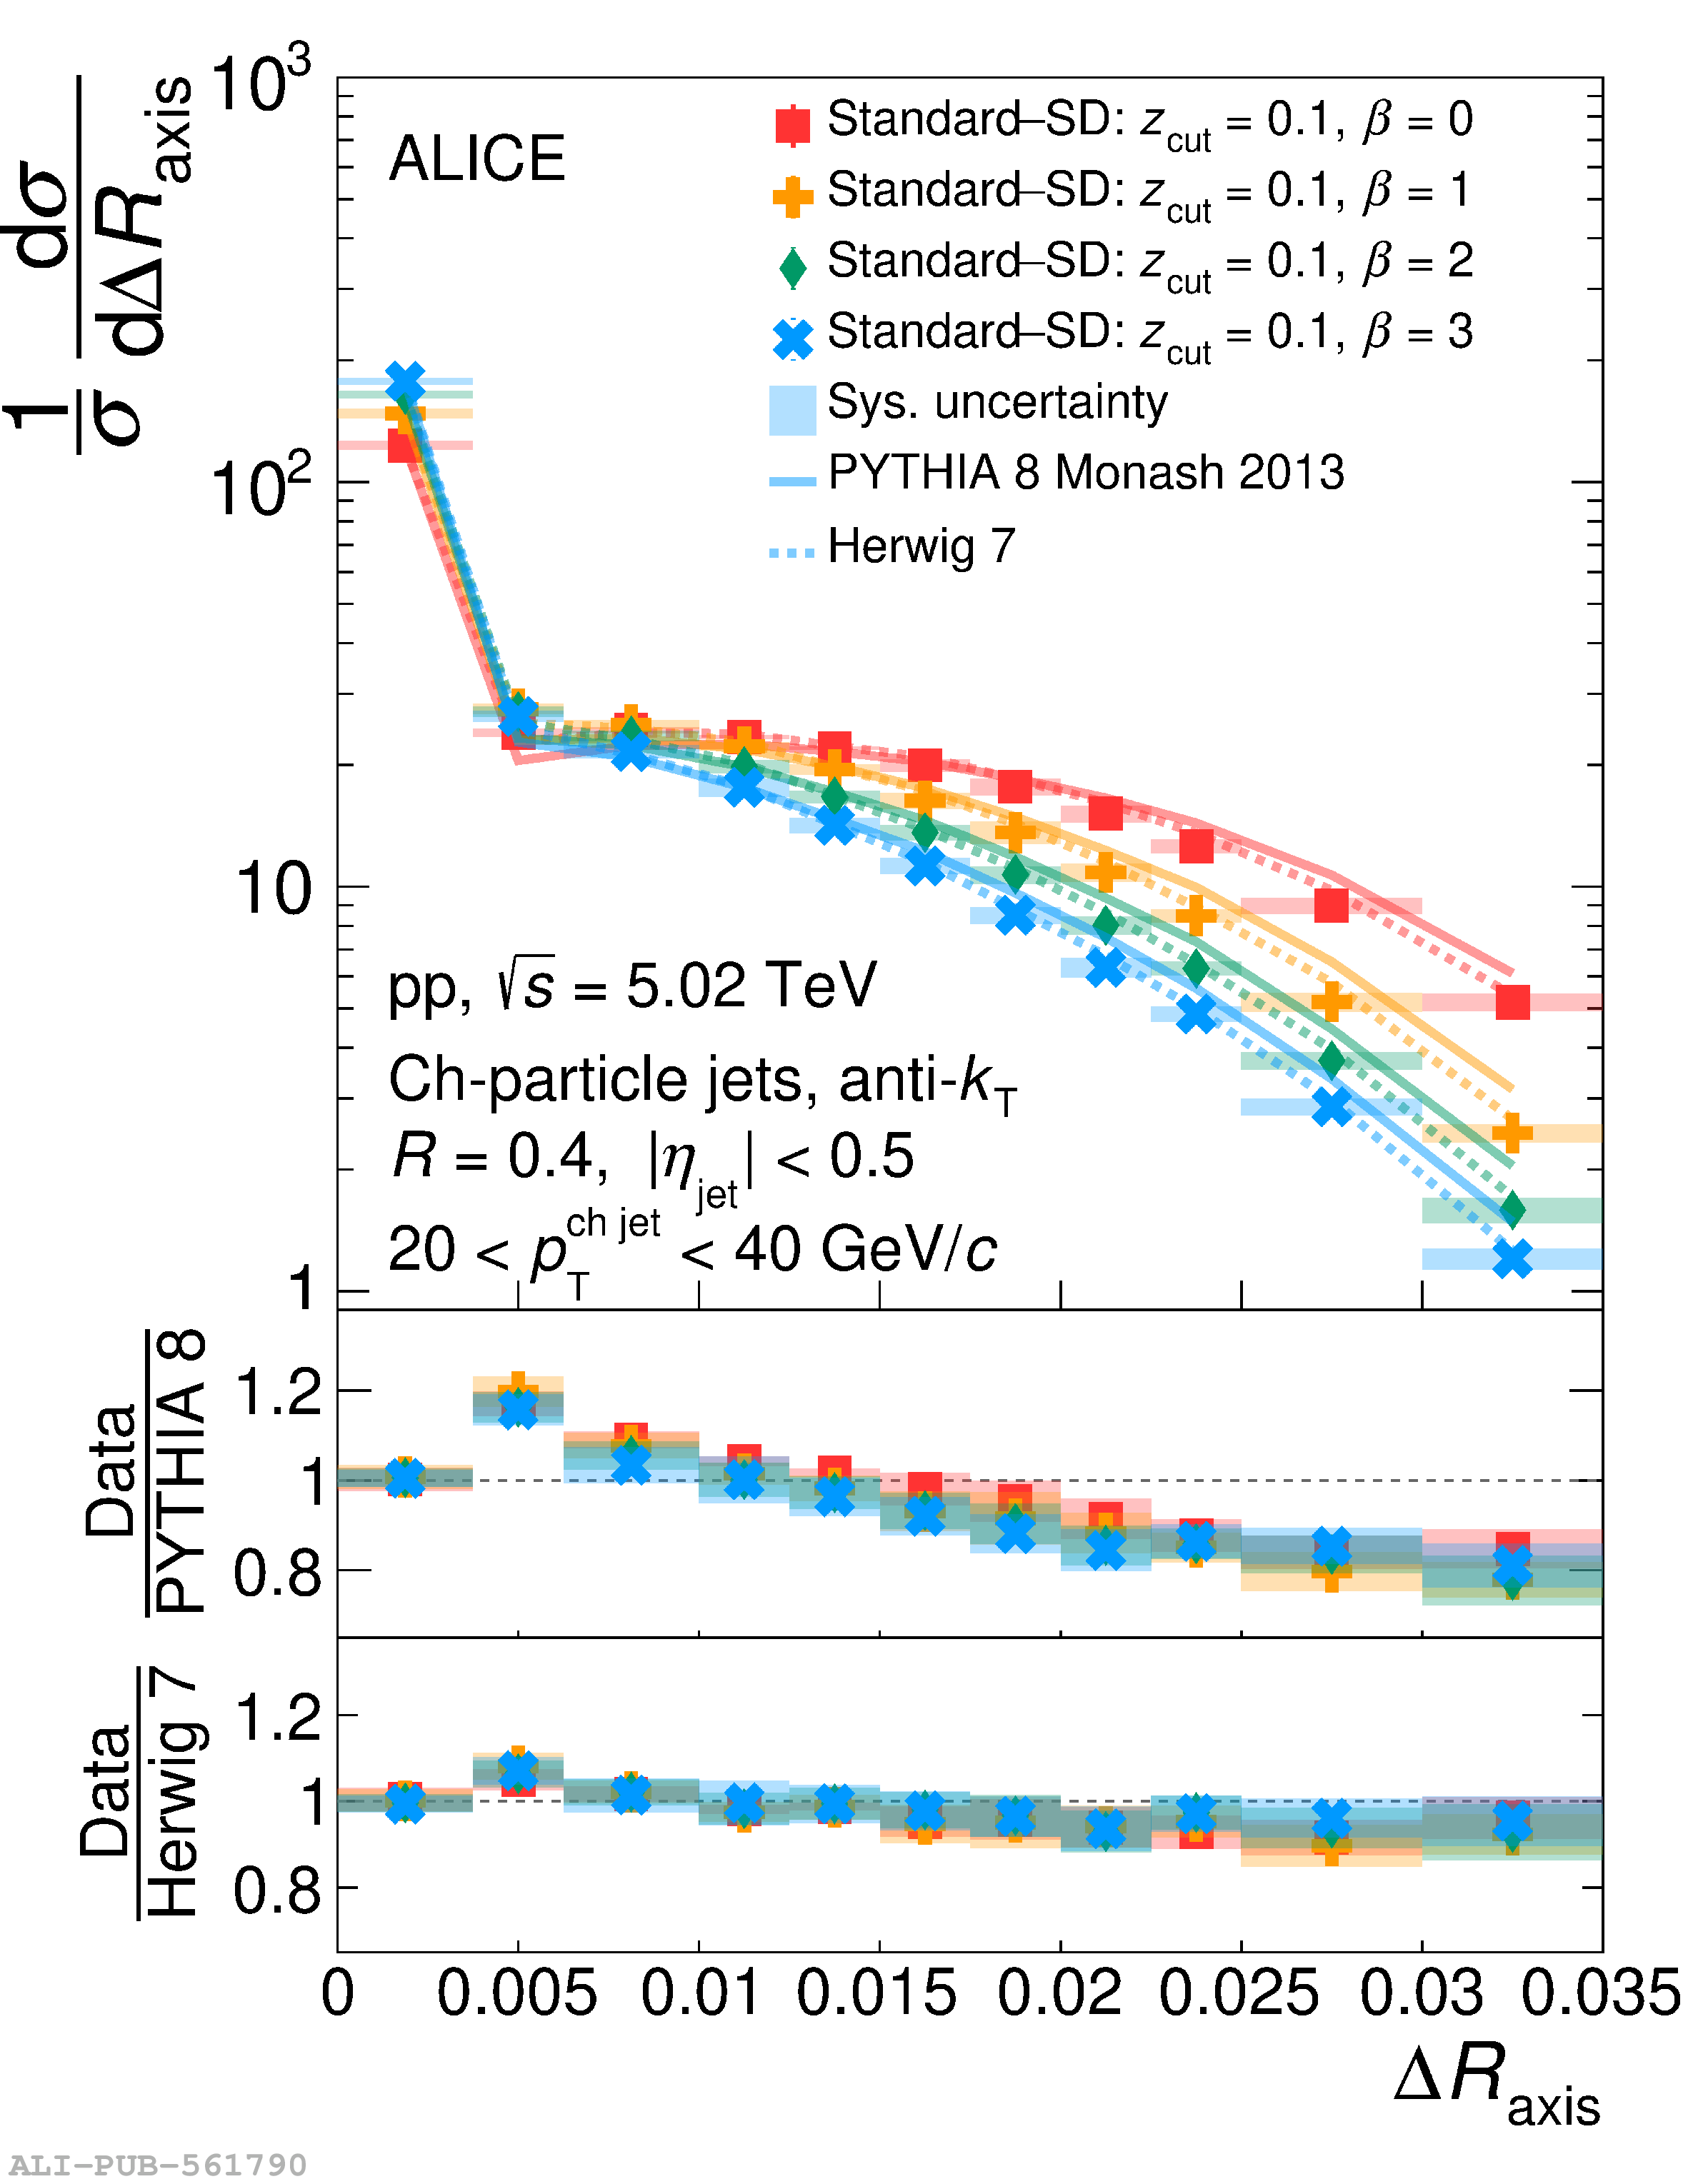 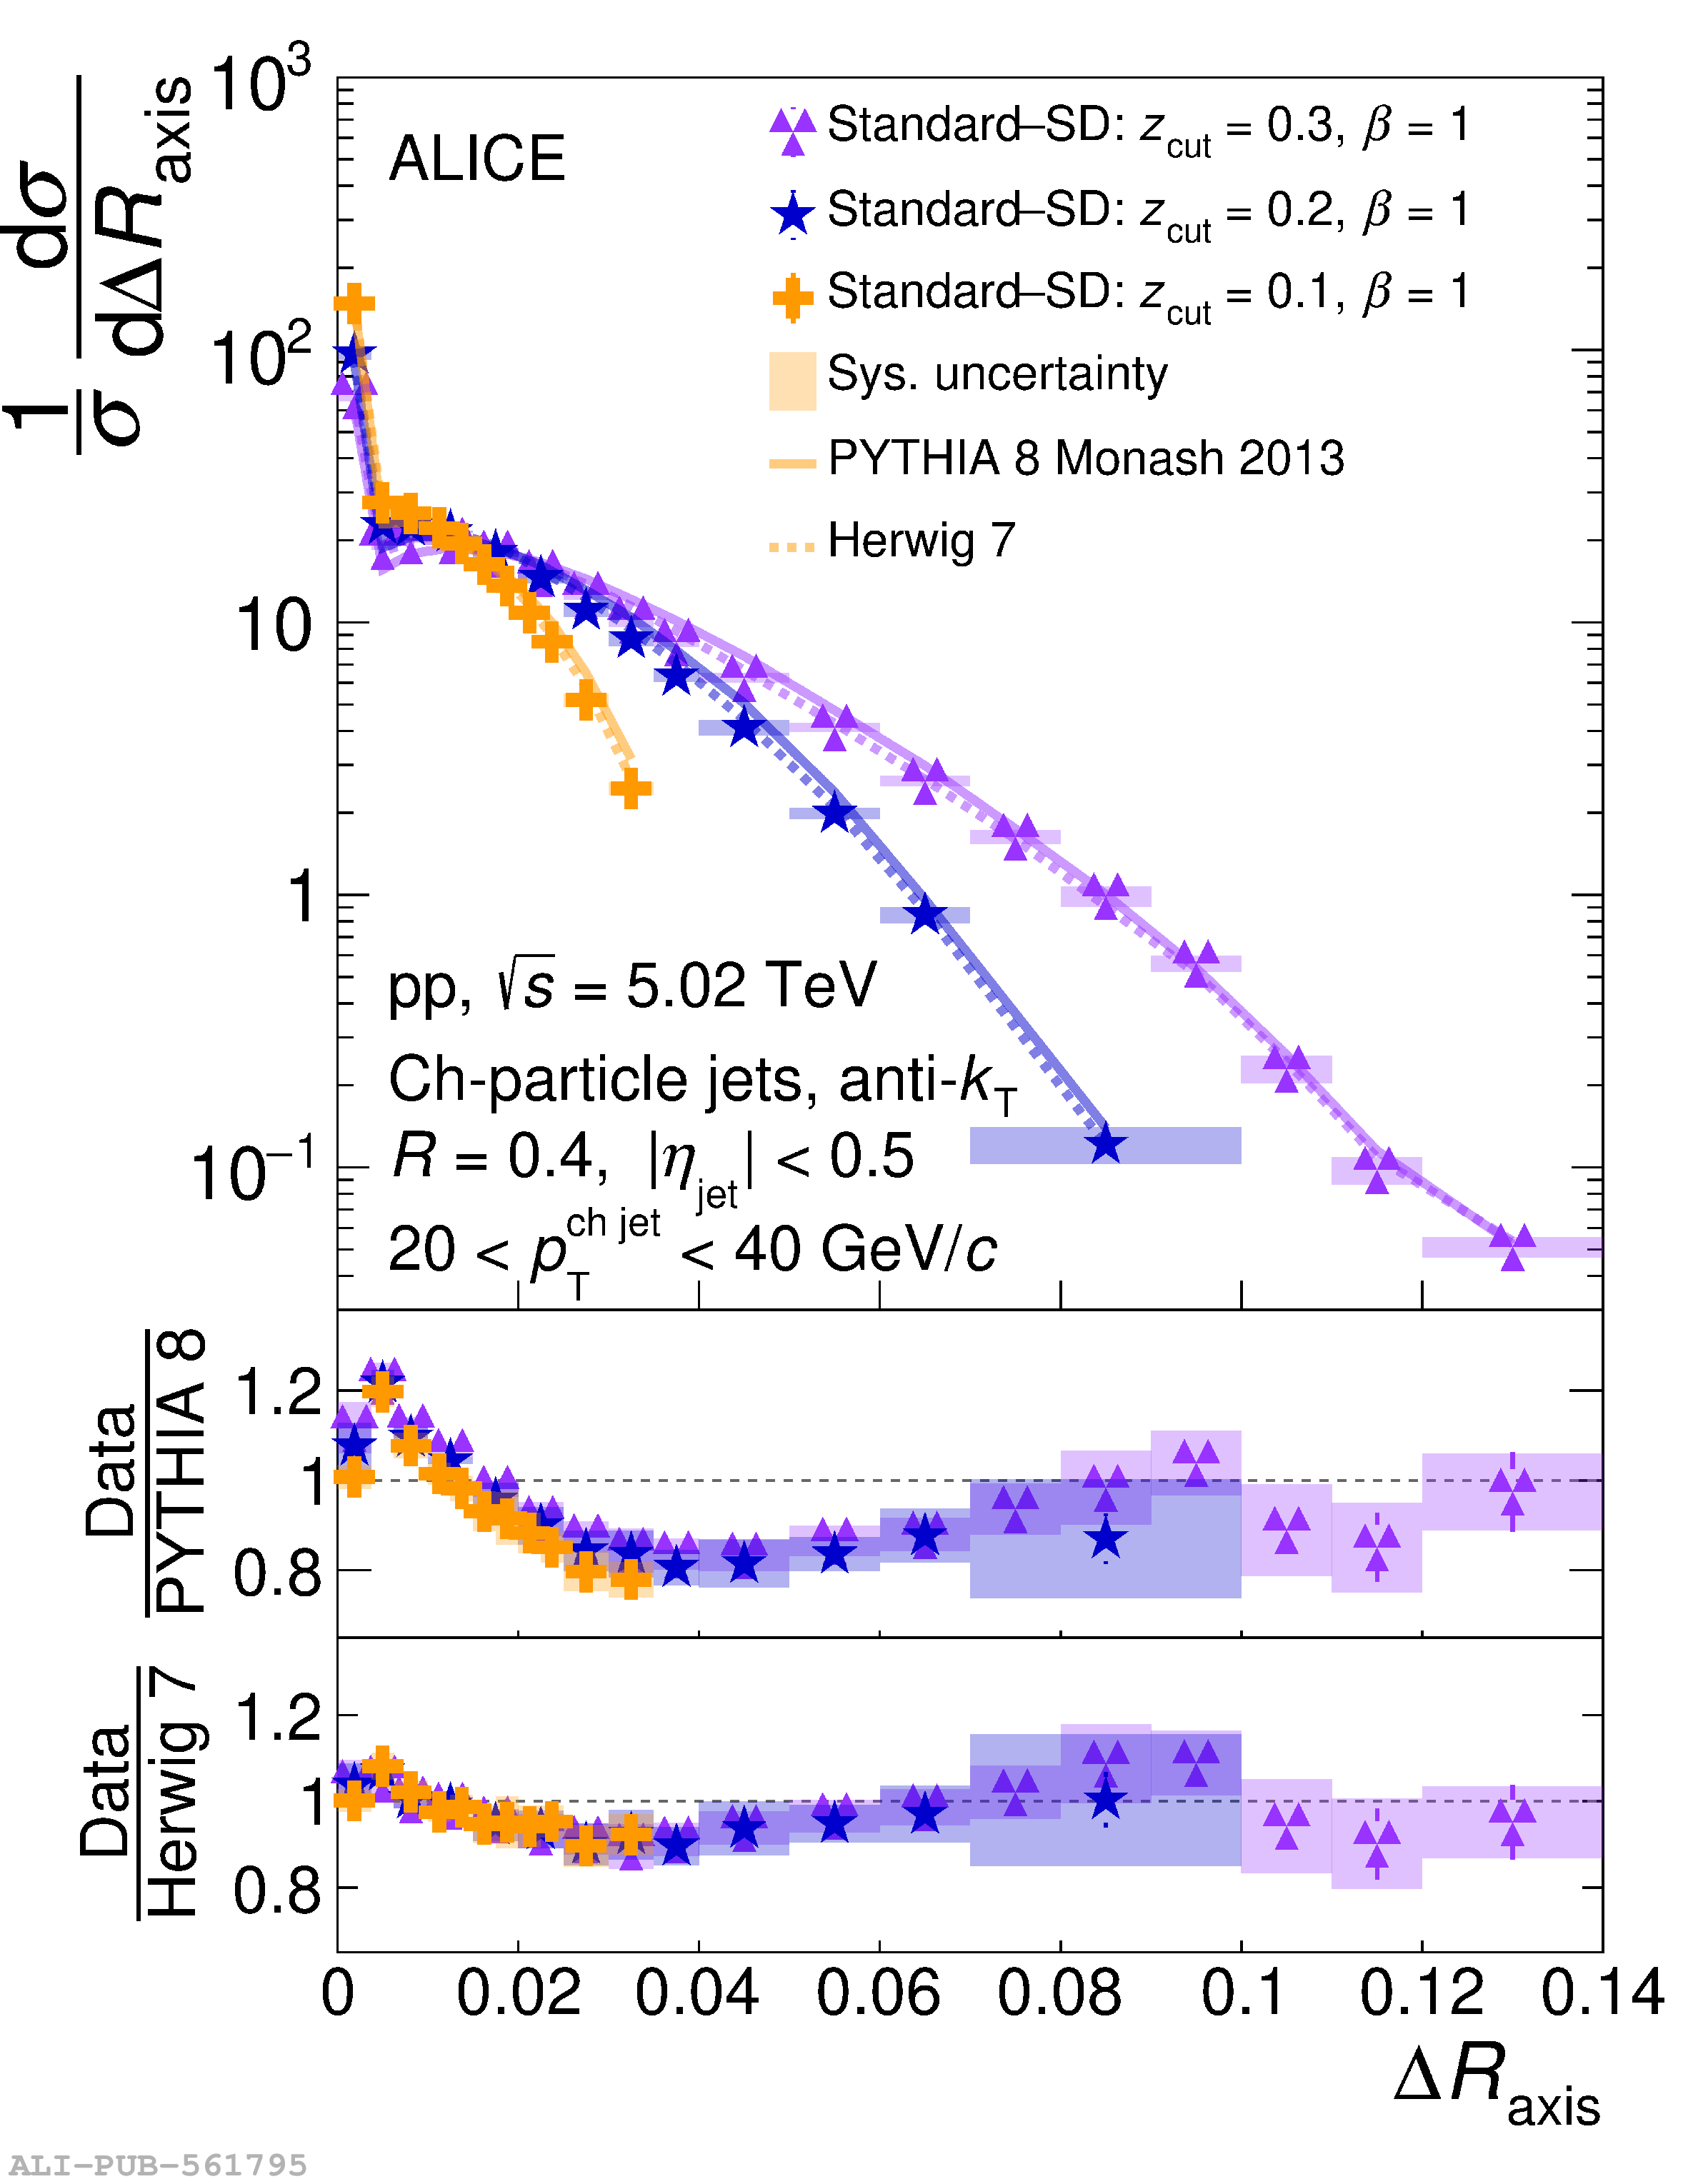 |
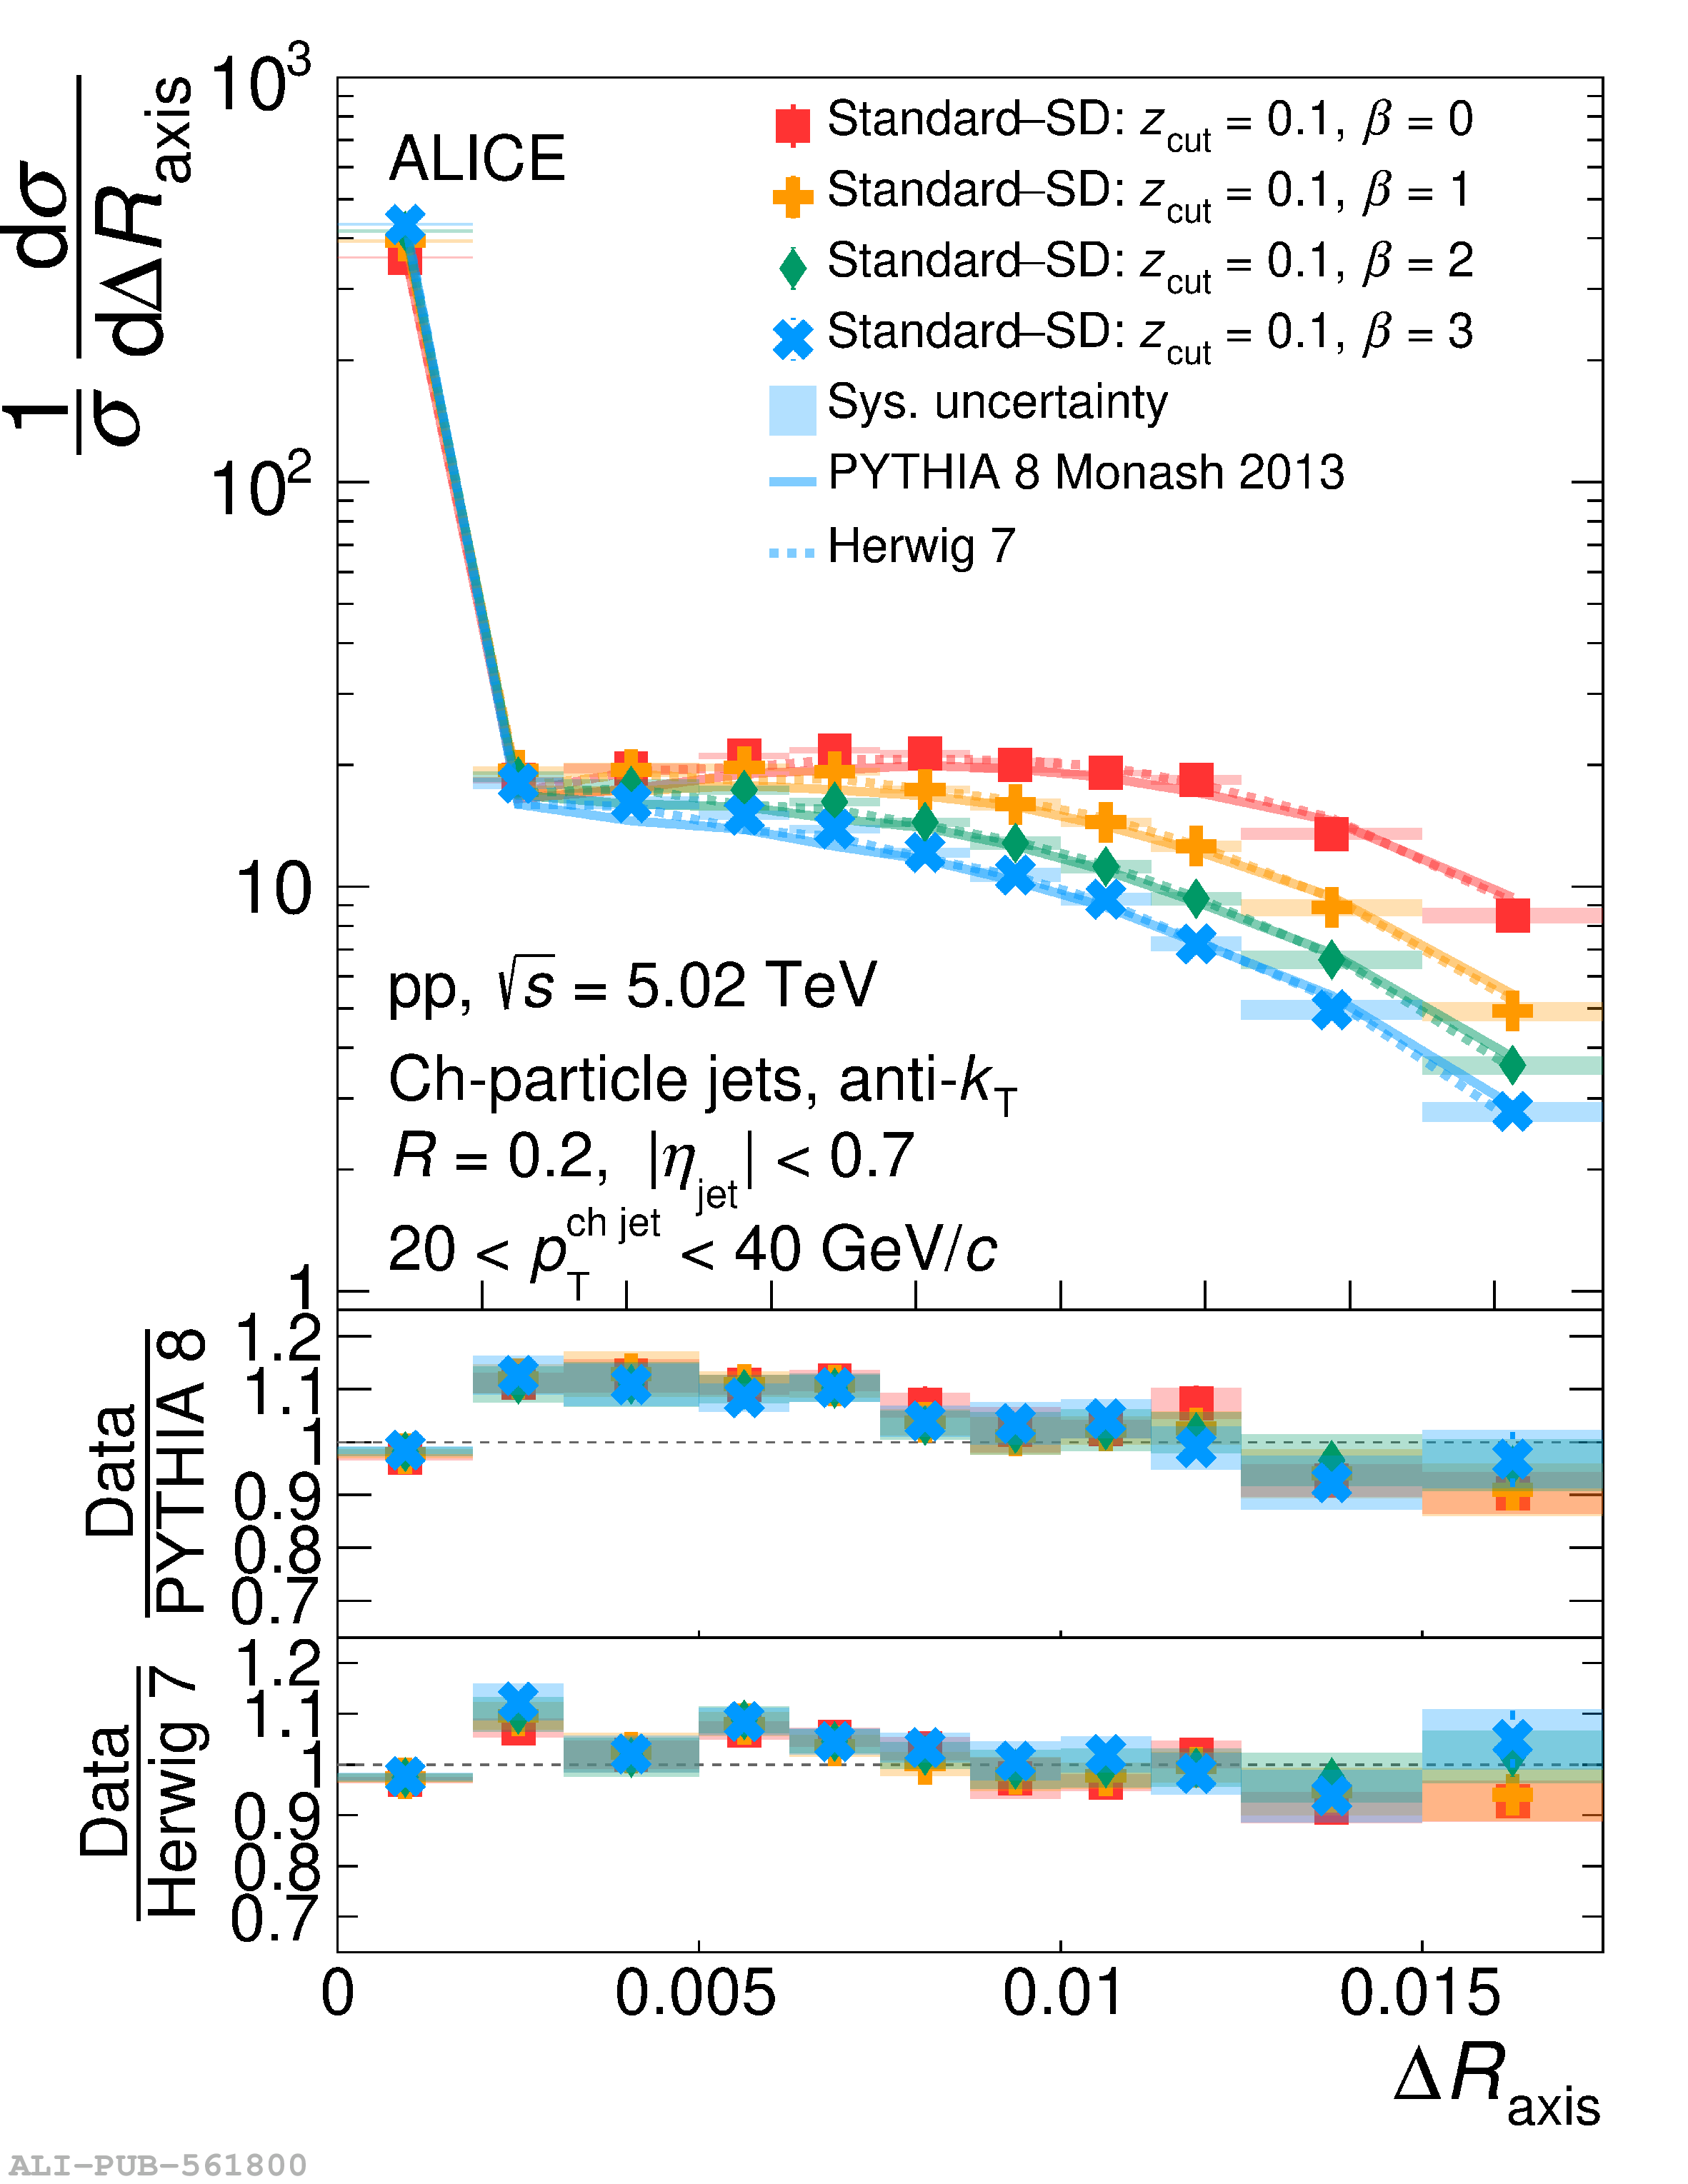
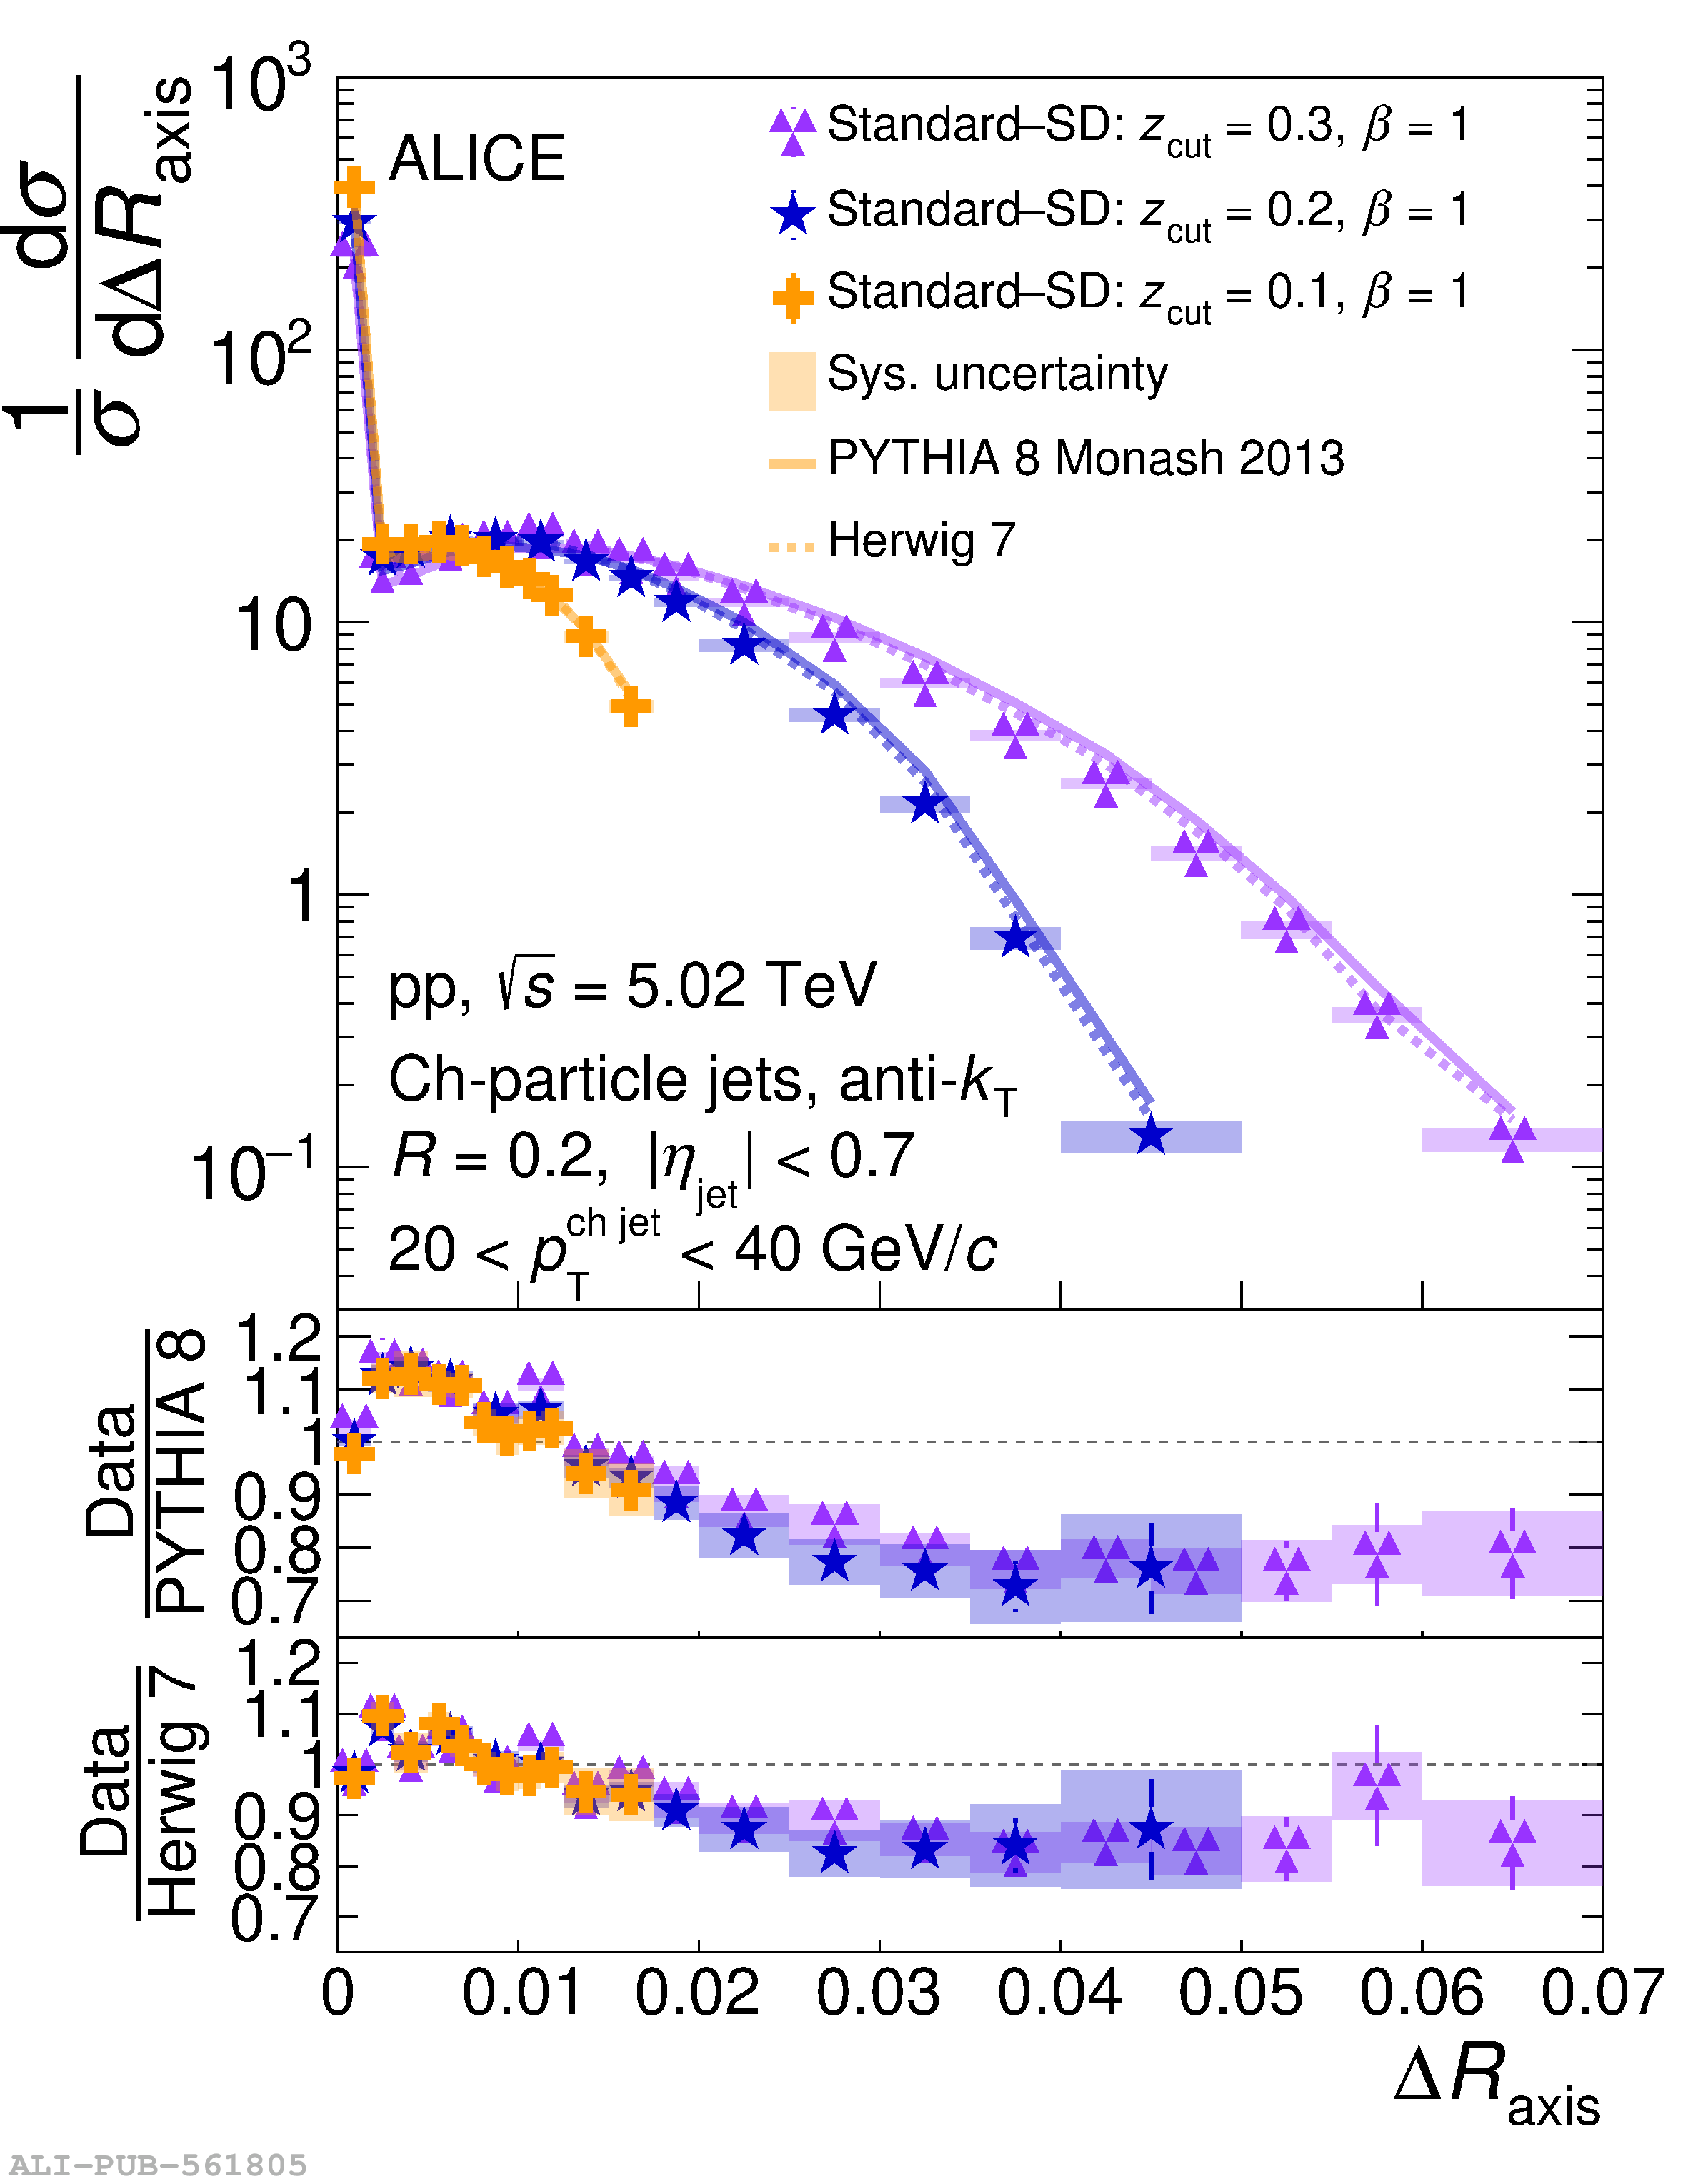

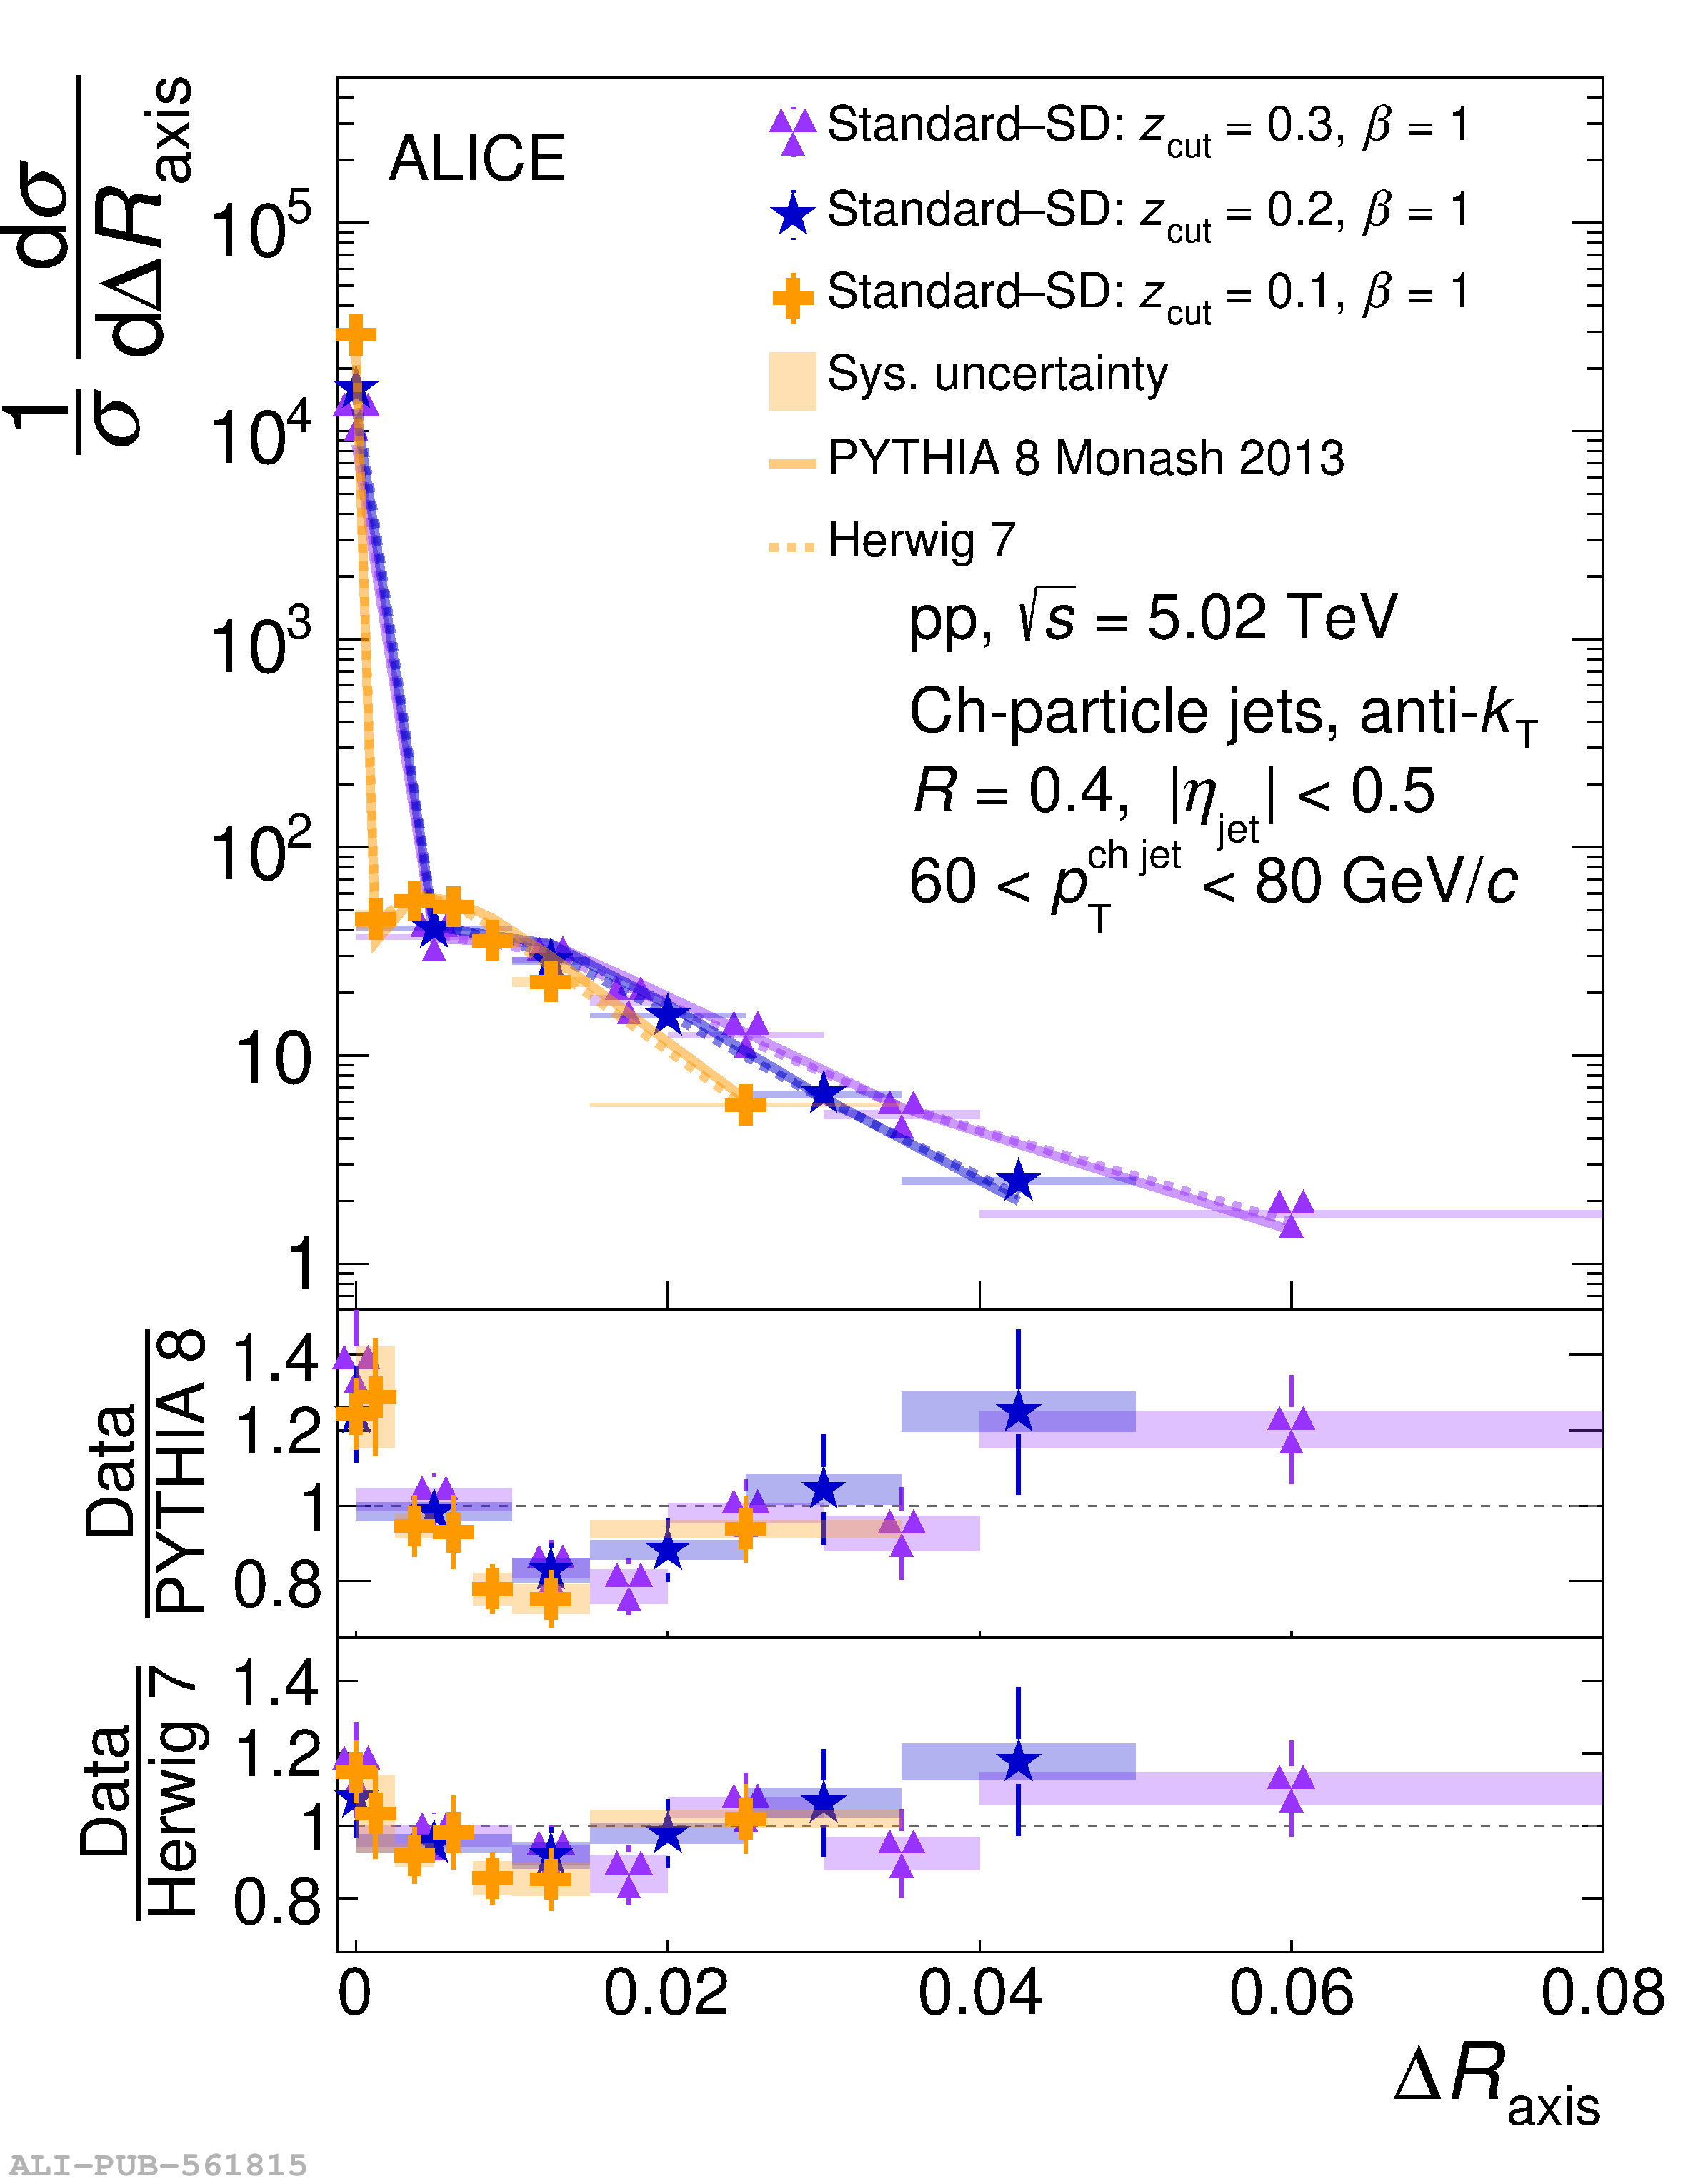
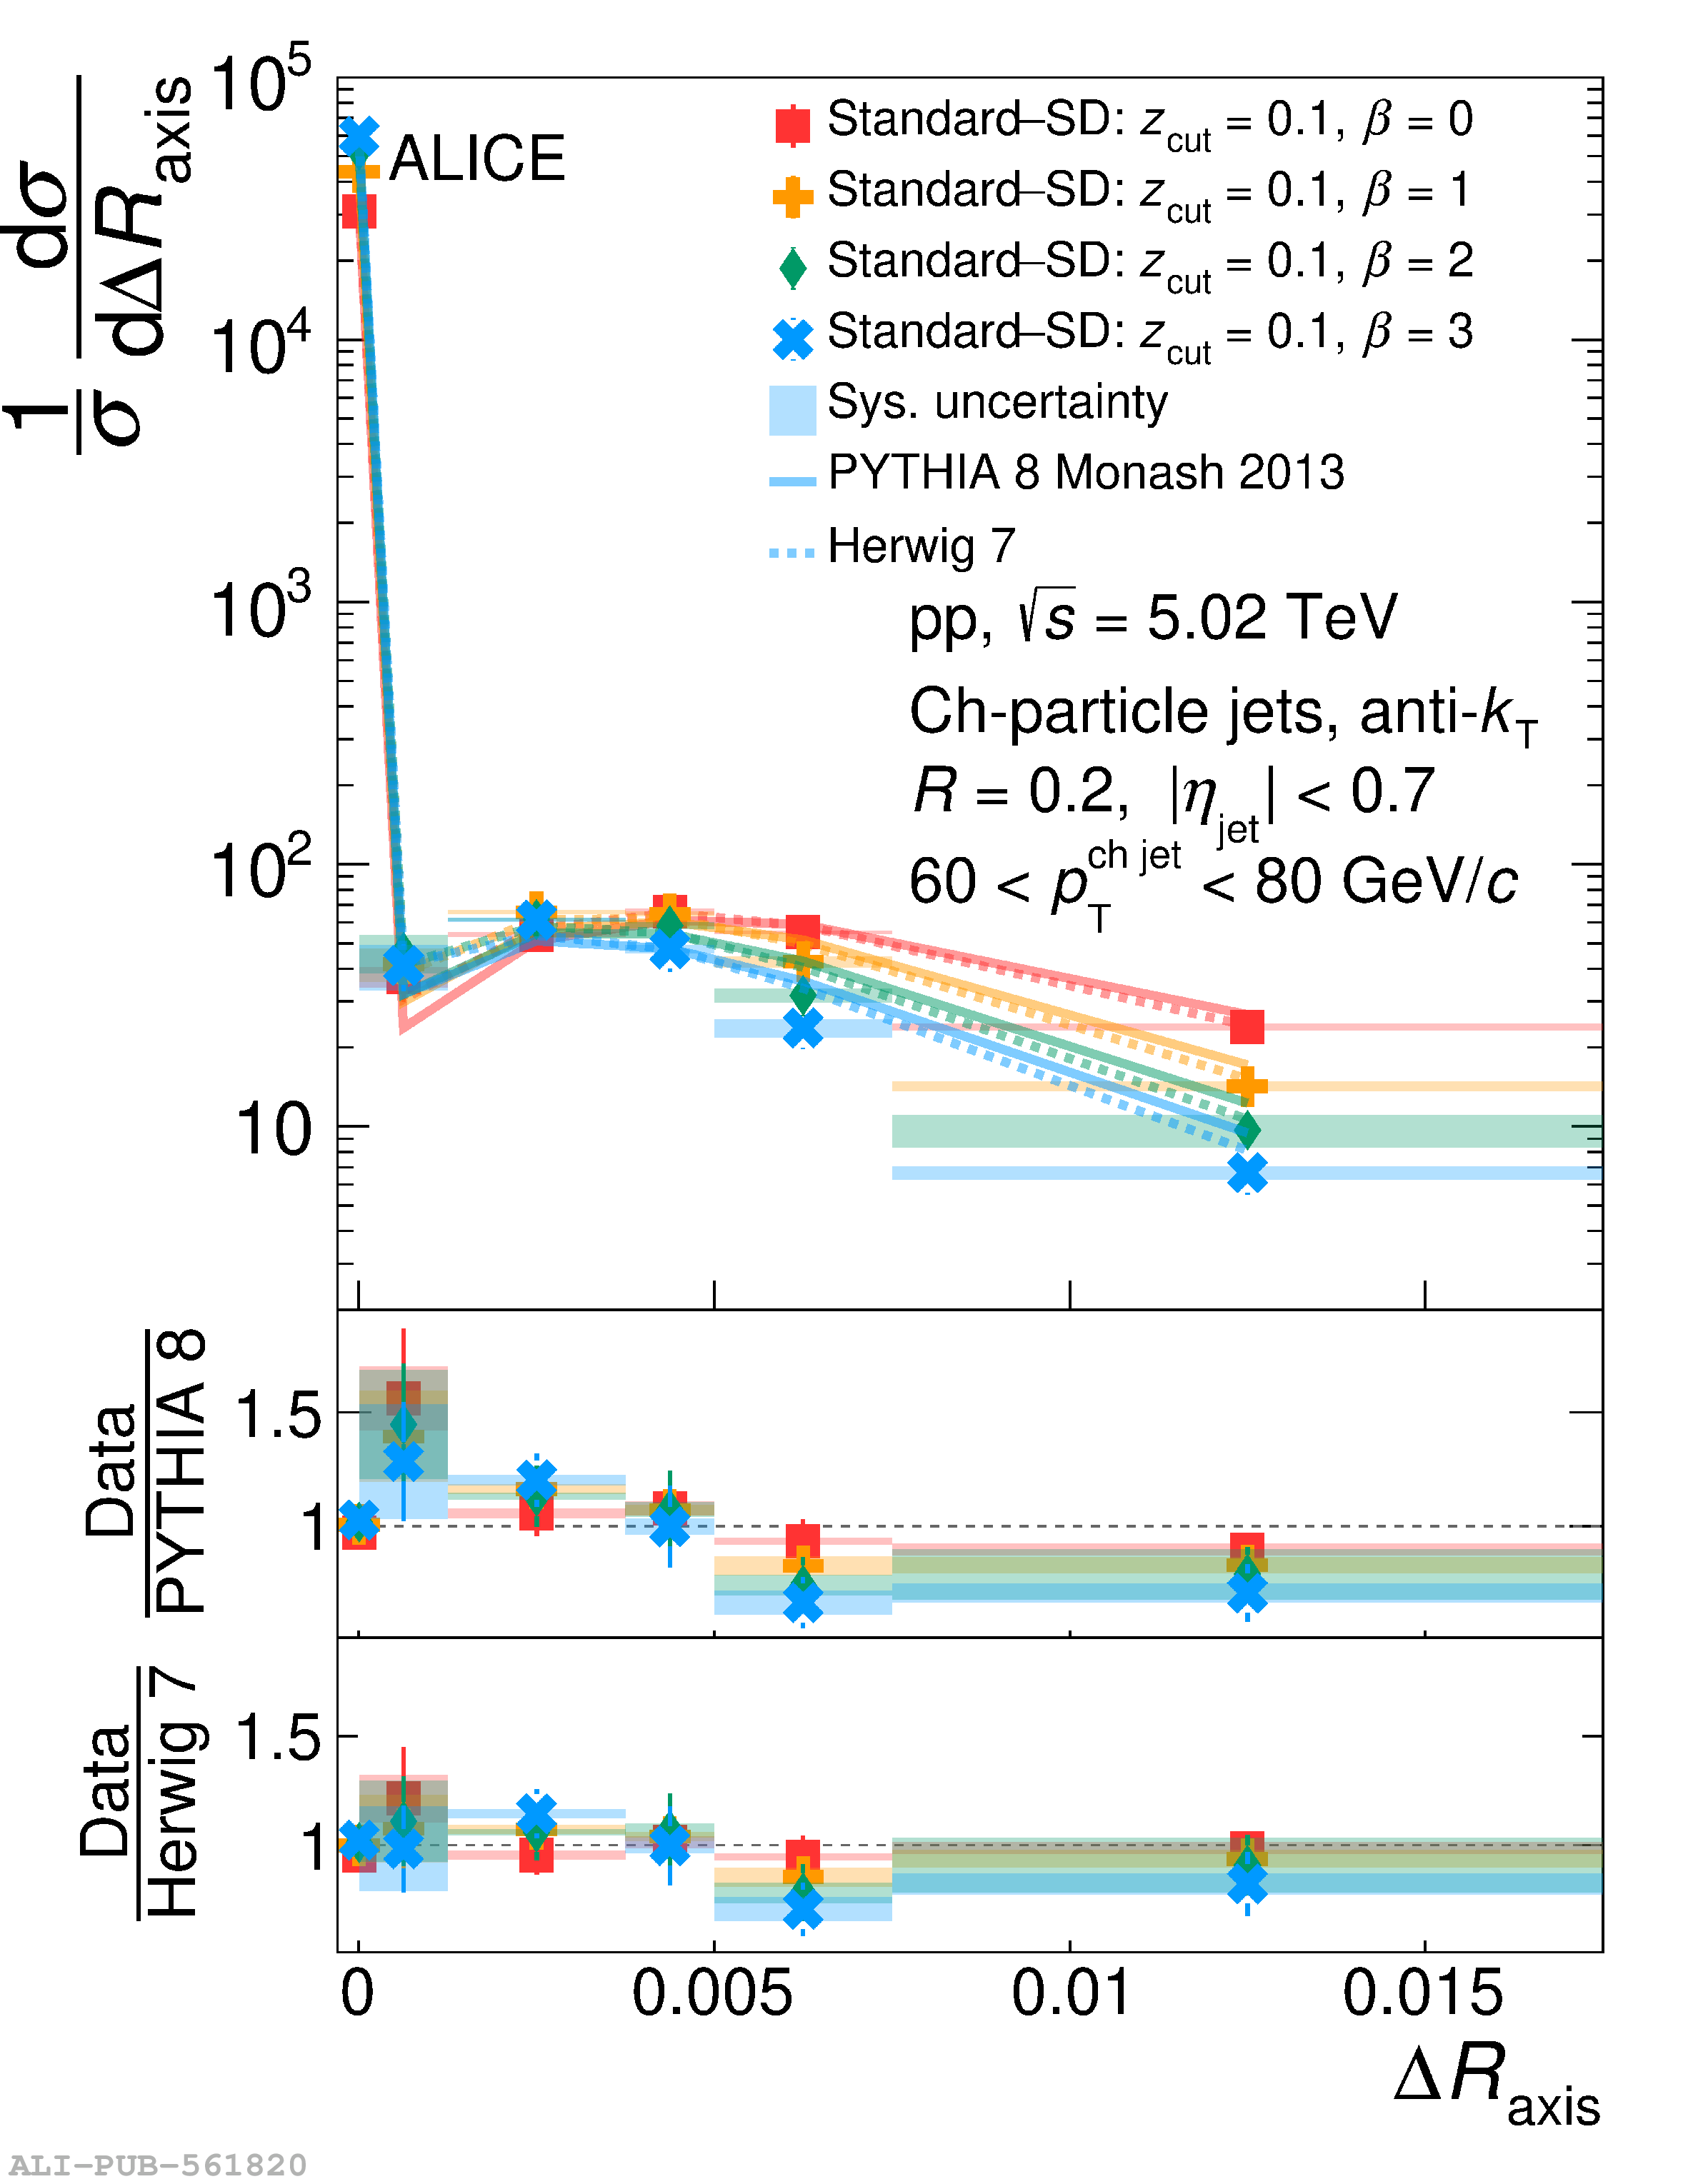
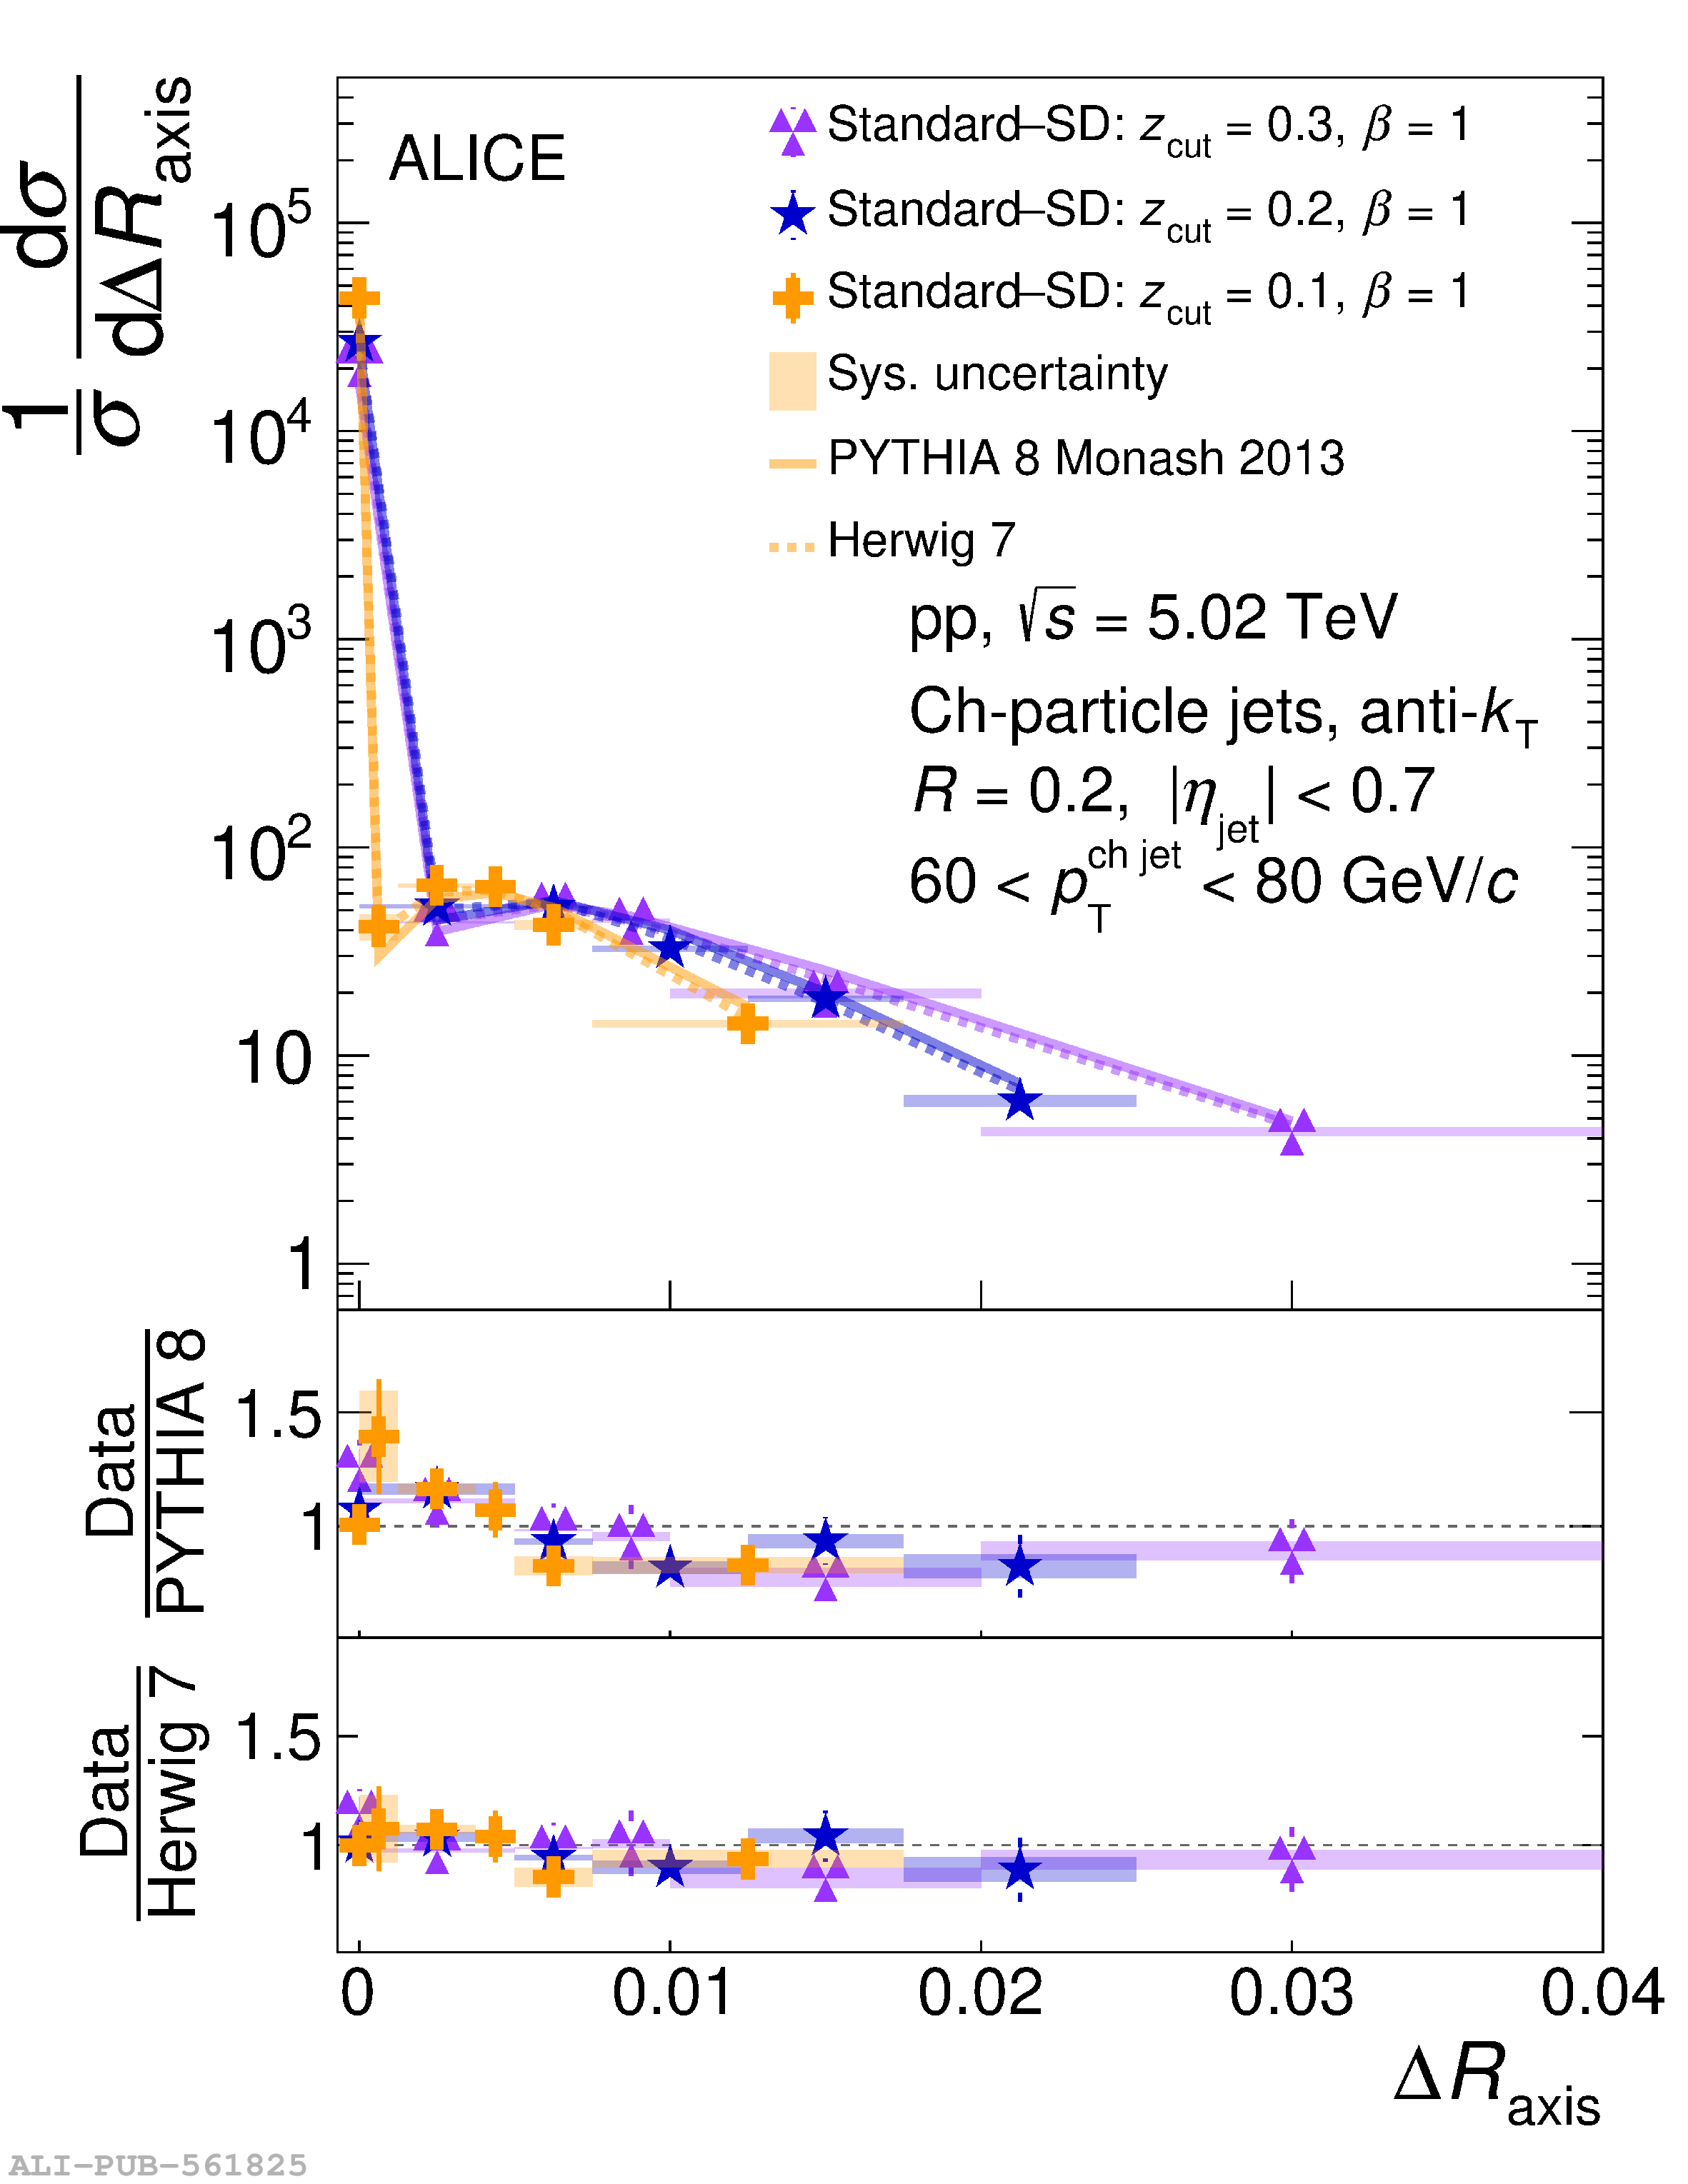

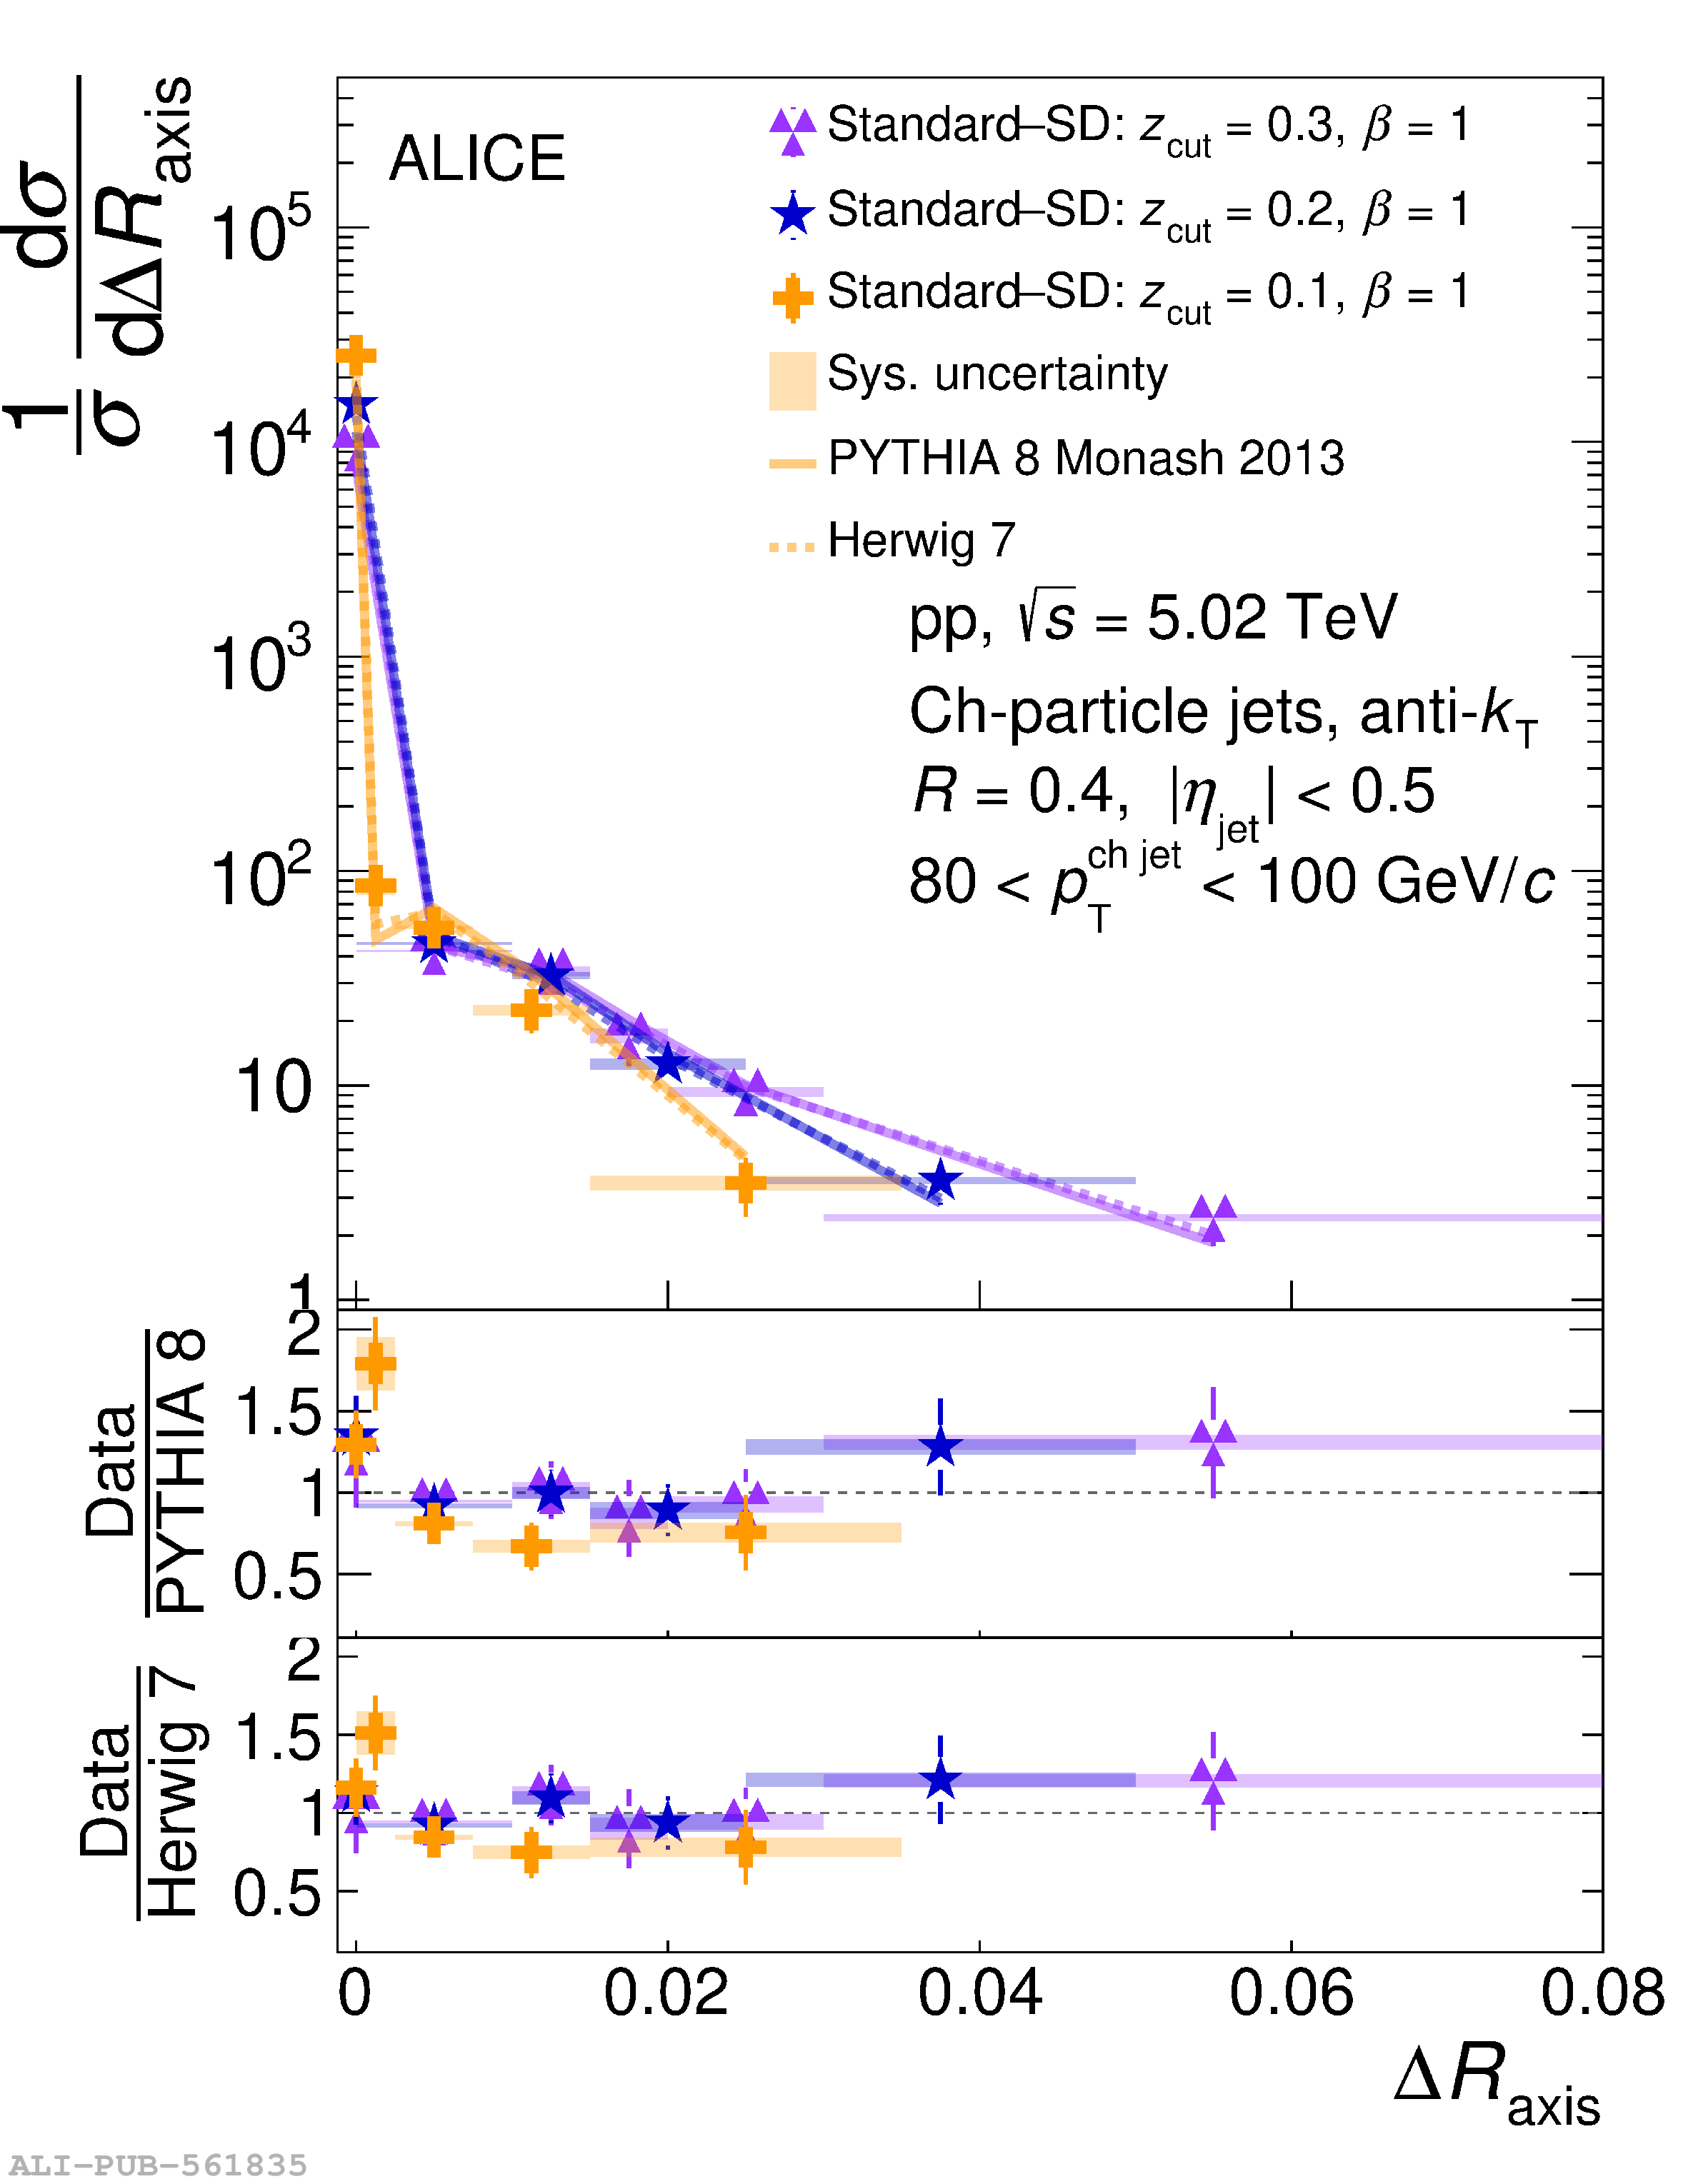
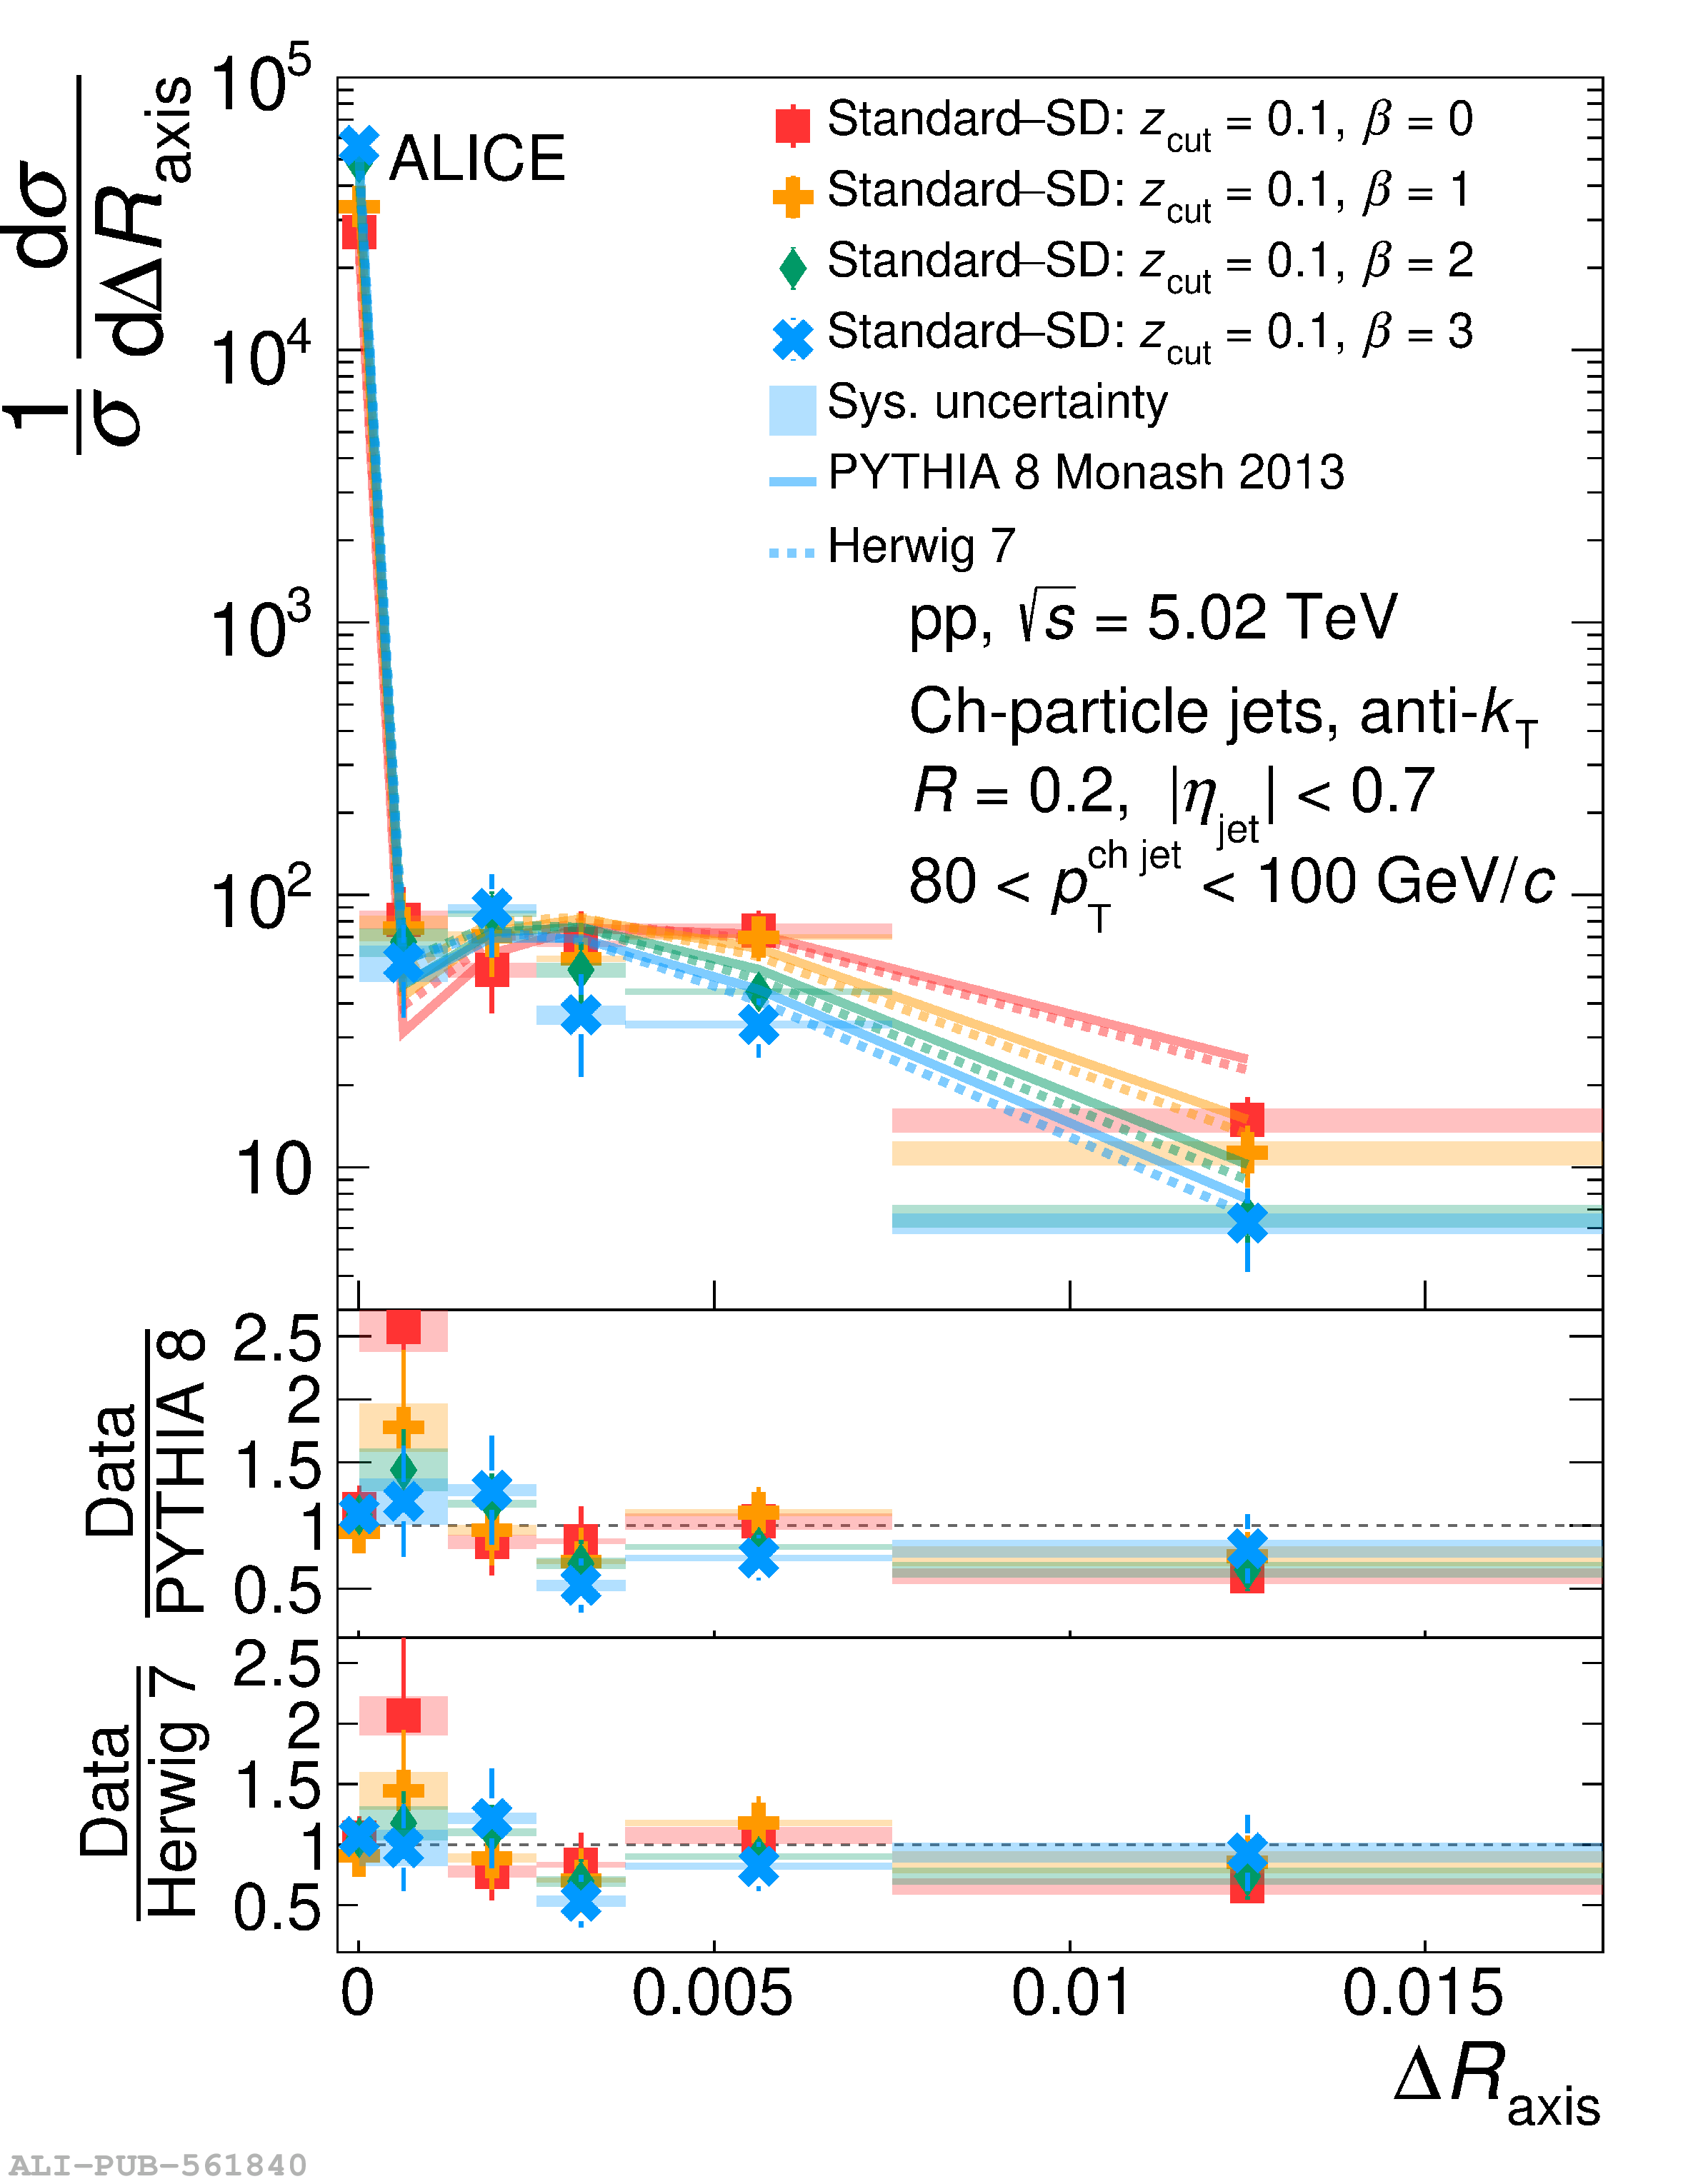
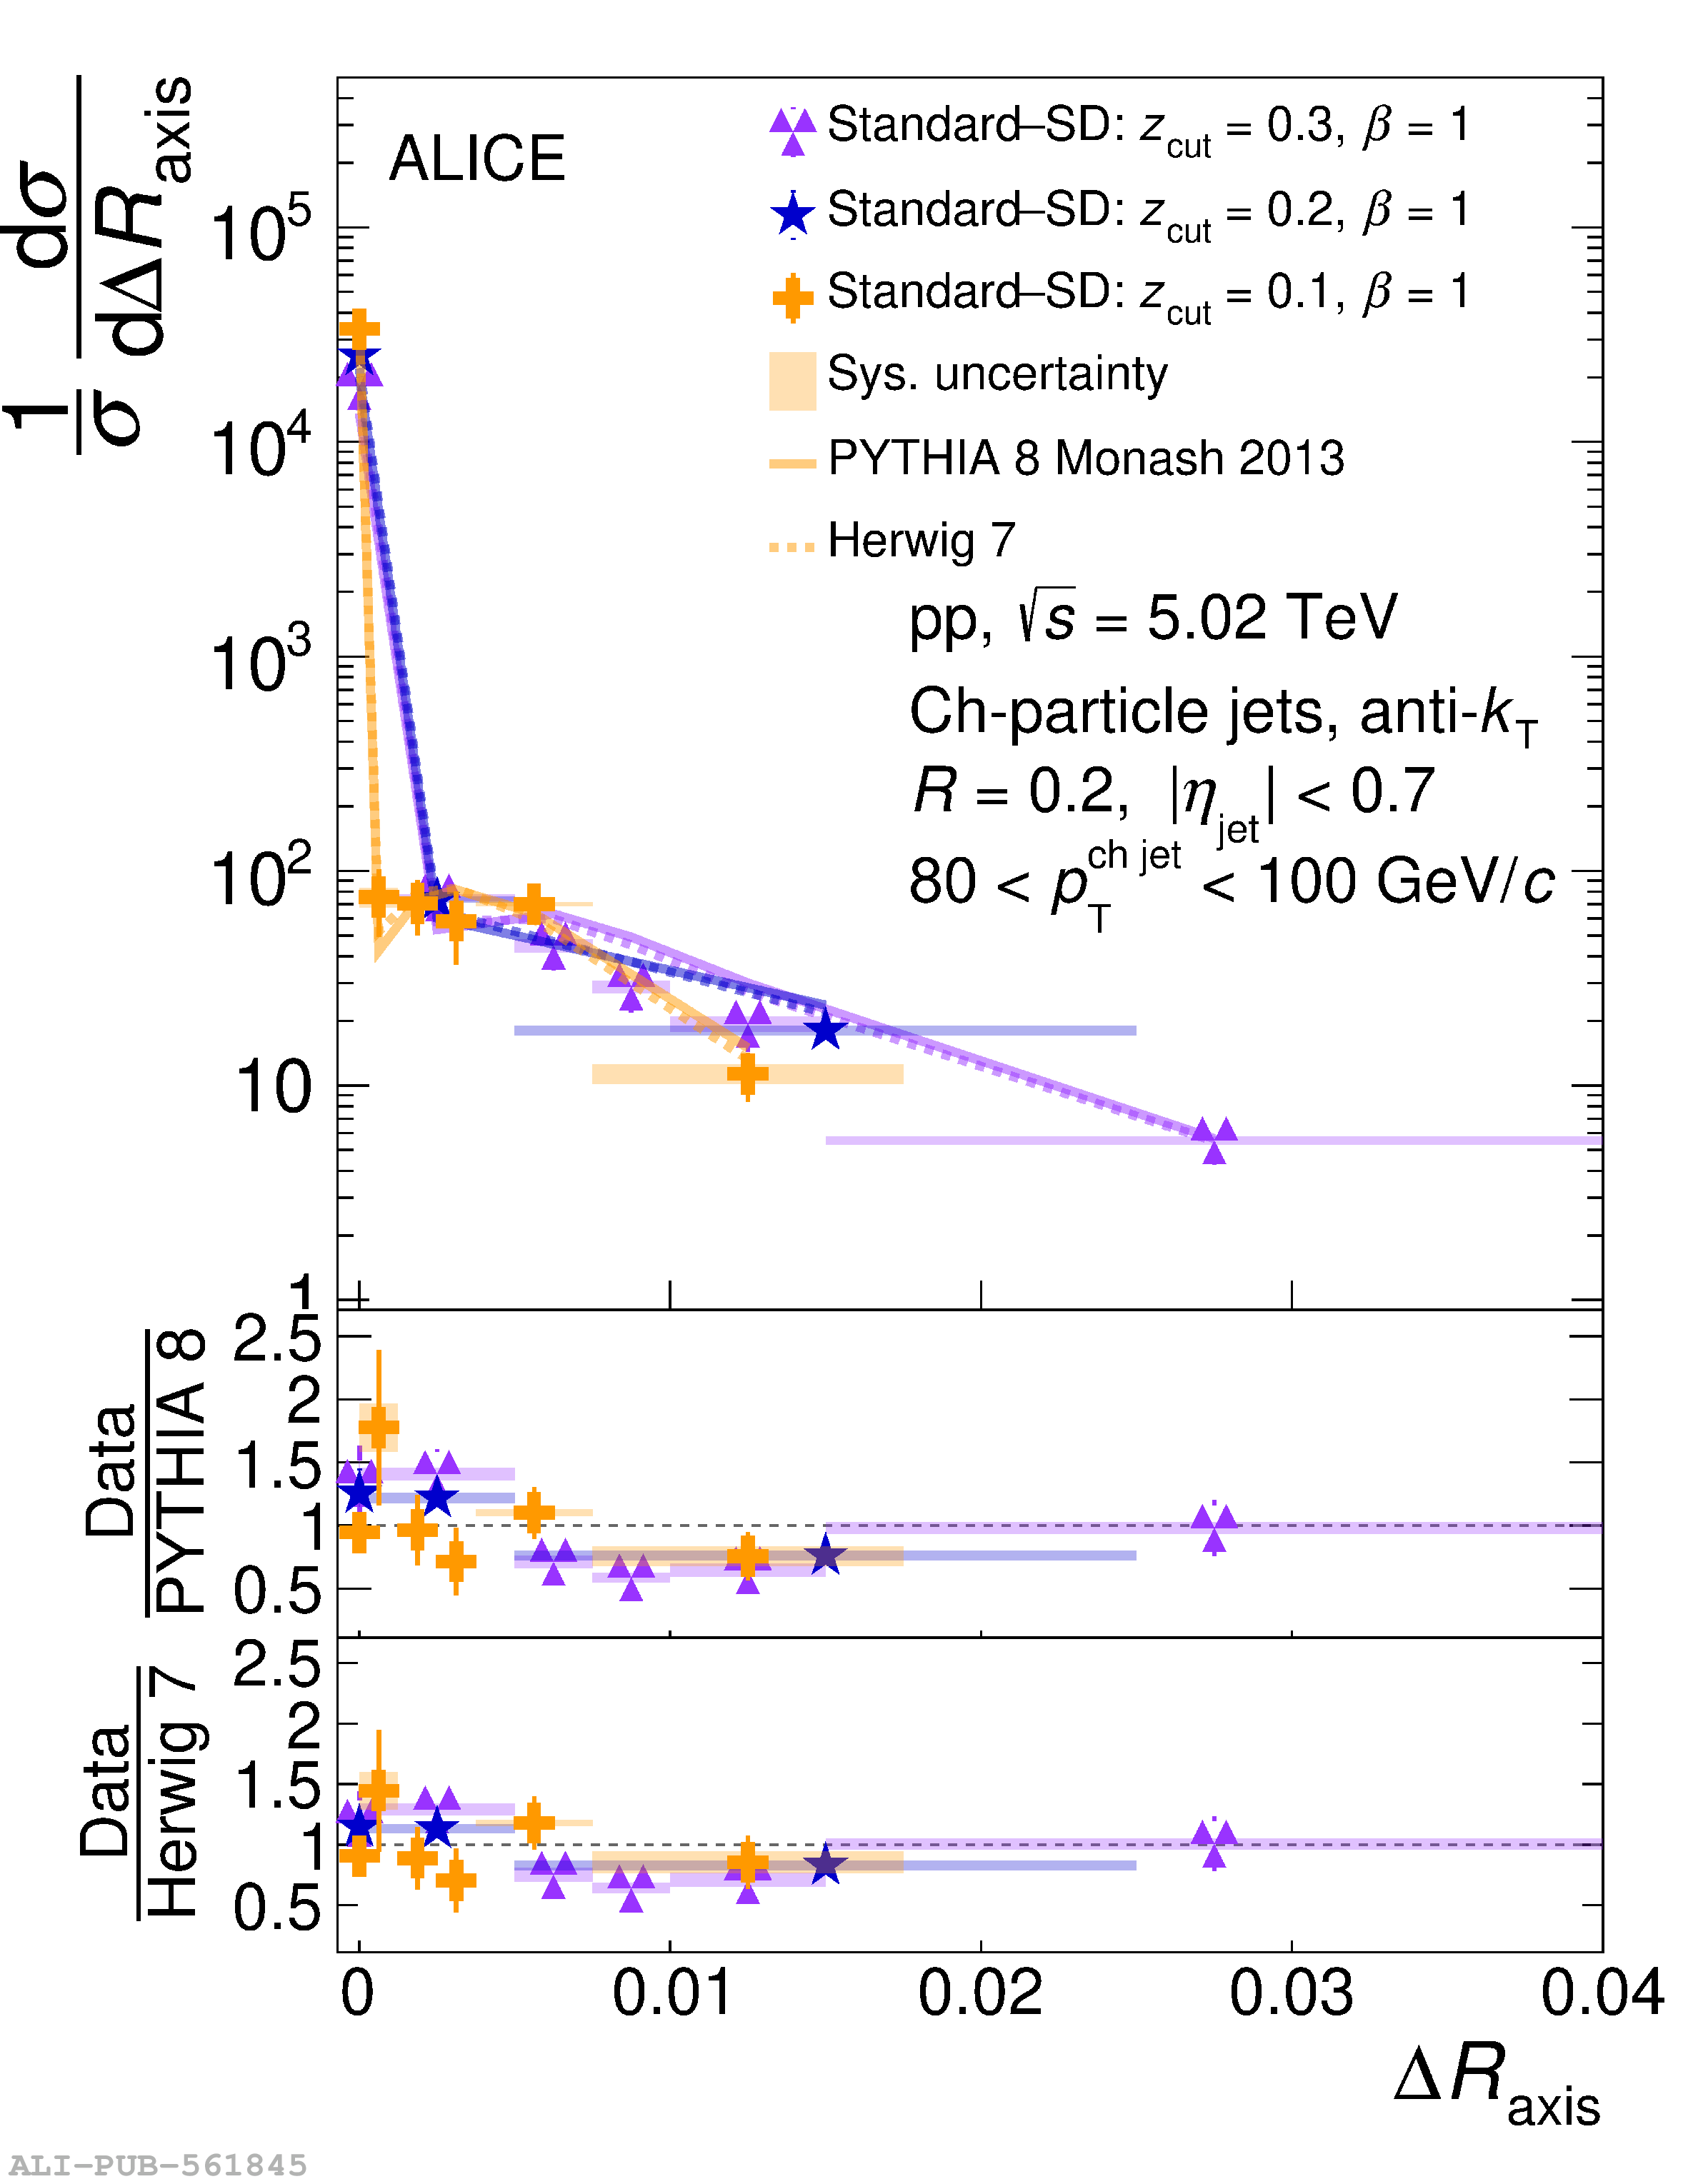
Figure B.1
Comparison between $\Delta R_{\rm axis}$ measured distributions and analytic predictions for the WTA$-$Standard case with $R=0.4$ Each panel corresponds to a different $p_{\rm T}^{\rm ch\,jet}$ bin. The measured distribution is shown in black The colored distributions correspond to the SCET prediction corrected with different MC event generators. |  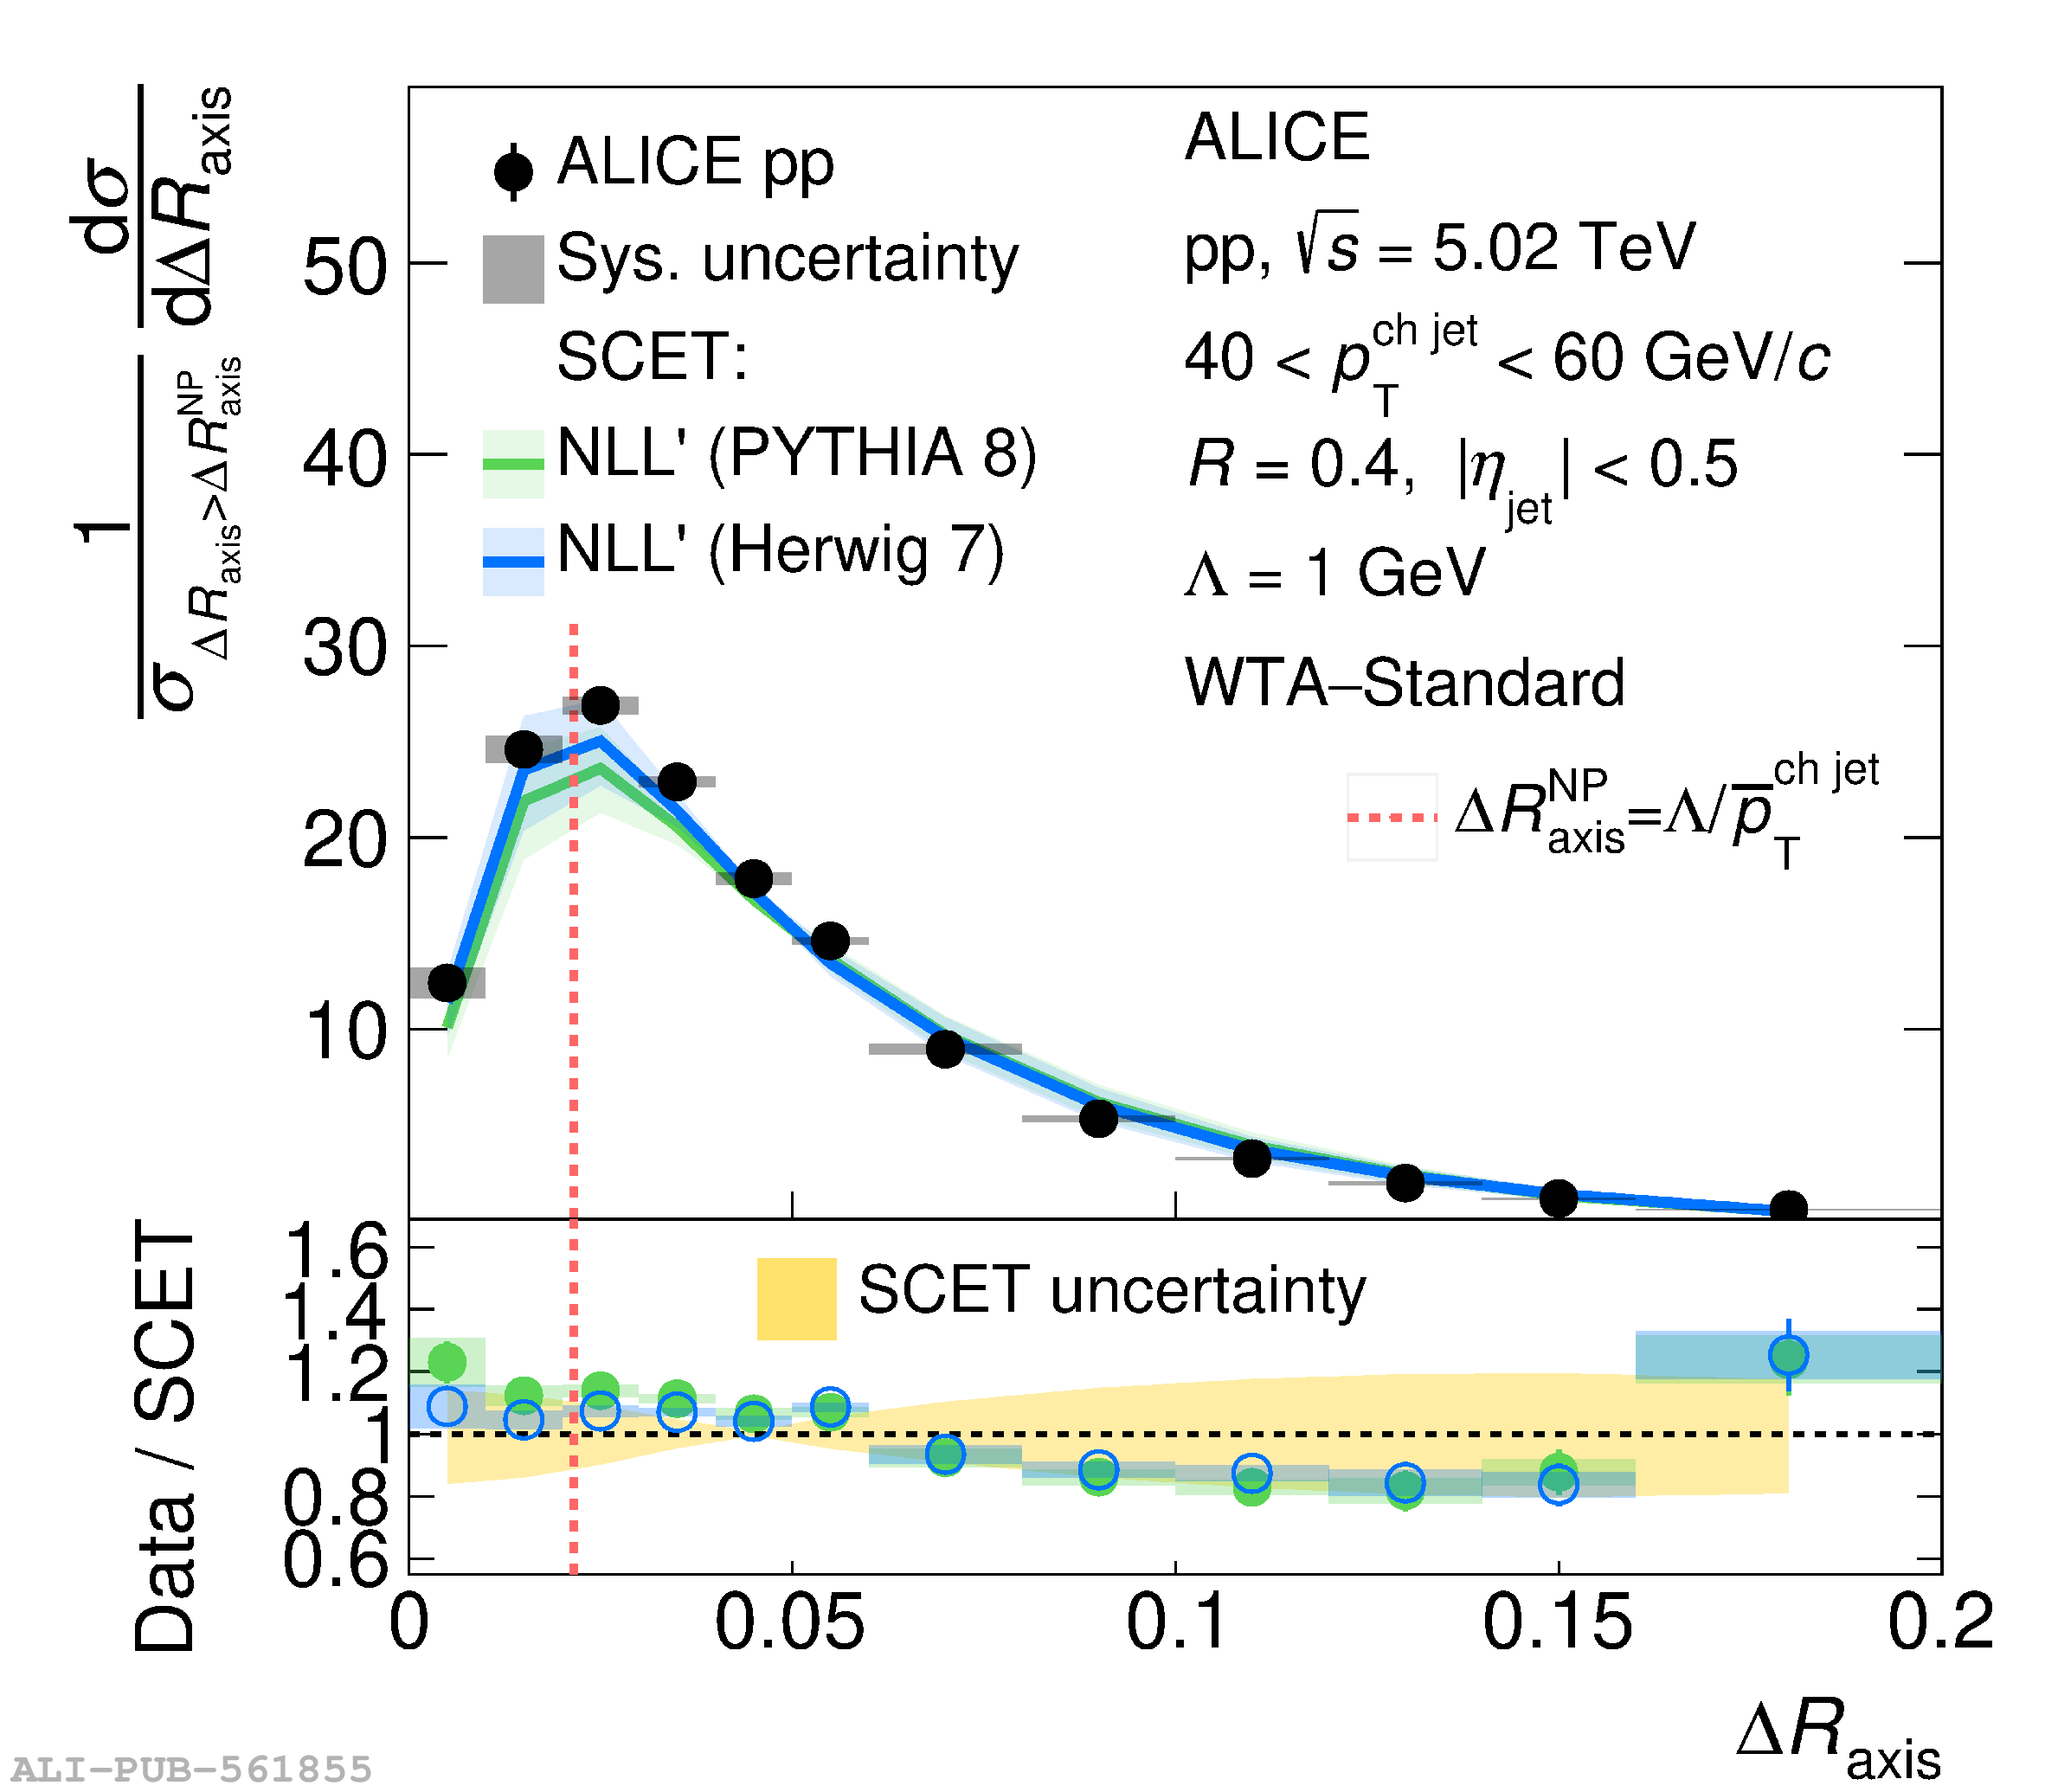 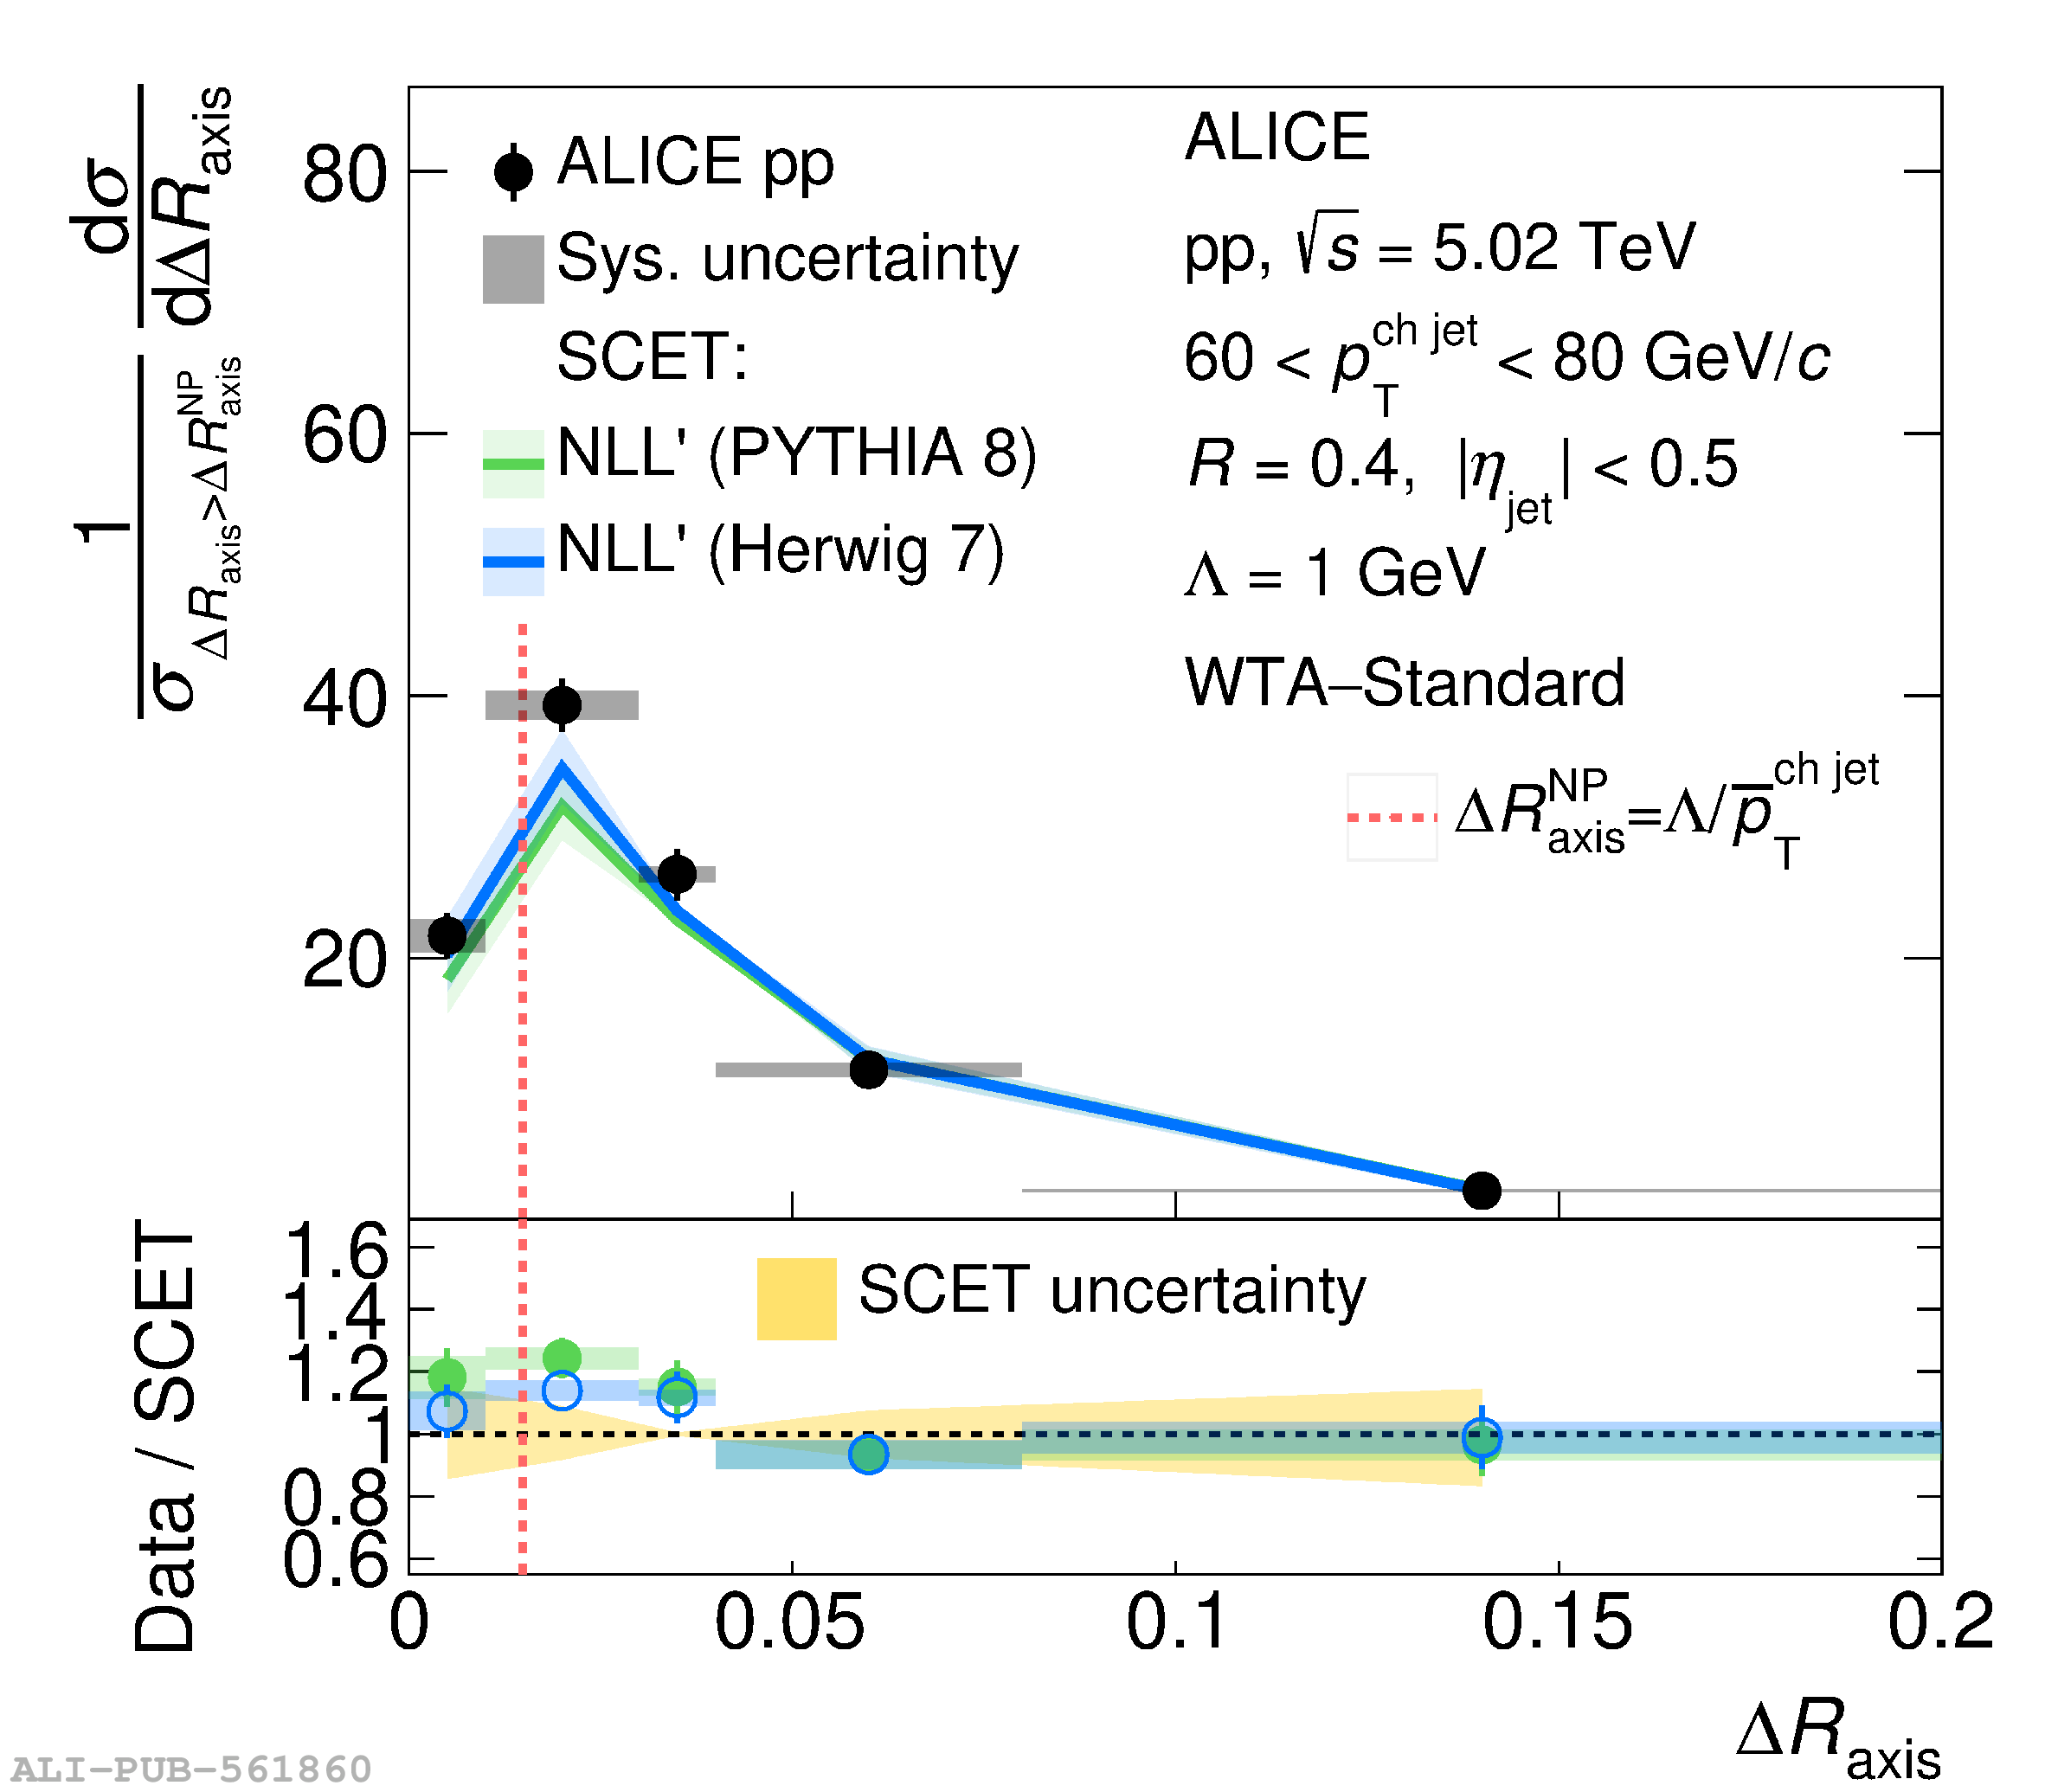  |