Multiplicity dependence of charged-particle jet production in pp collisions at $\sqrt{s} = 13$ TeV

The multiplicity dependence of jet production in pp collisions at the centre-of-mass energy of $\sqrt{s} = 13\ \mathrm{TeV}$ is studied for the first time. Jets are reconstructed from charged particles using the anti-$k_\mathrm{T}$ algorithm with resolution parameters $R$ varying from $0.2$ to $0.7$. The jets are measured in the pseudorapidity range $|\eta_{\rm jet}|<~ 0.9-R$ and in the transverse momentum range $5<~p_\mathrm{T,jet}^{\rm ch}<~140\ \mathrm{GeV}/c$. The multiplicity intervals are categorised by the ALICE forward detector V0. The $p_{\mathrm{T}}$ differential cross section of charged-particle jets are compared to leading order (LO) and next-to-leading order (NLO) perturbative quantum chromodynamics (pQCD) calculations. It is found that the data are better described by the NLO calculation, although the NLO prediction overestimates the jet cross section below $20\ \mathrm{GeV}/c$. The cross section ratios for different $R$ are also measured and compared to model calculations. These measurements provide insights into the angular dependence of jet fragmentation. The jet yield increases with increasing self-normalised charged-particle multiplicity. This increase shows only a weak dependence on jet transverse momentum and resolution parameter at the highest multiplicity. While such behaviour is qualitatively described by the present version of PYTHIA, quantitative description may require implementing new mechanisms for multi-particle production in hadronic collisions.


Eur. Phys. J. C 82 (2022) 514
HEP Data
e-Print: arXiv:2202.01548 | PDF | inSPIRE
CERN-EP-2022-011

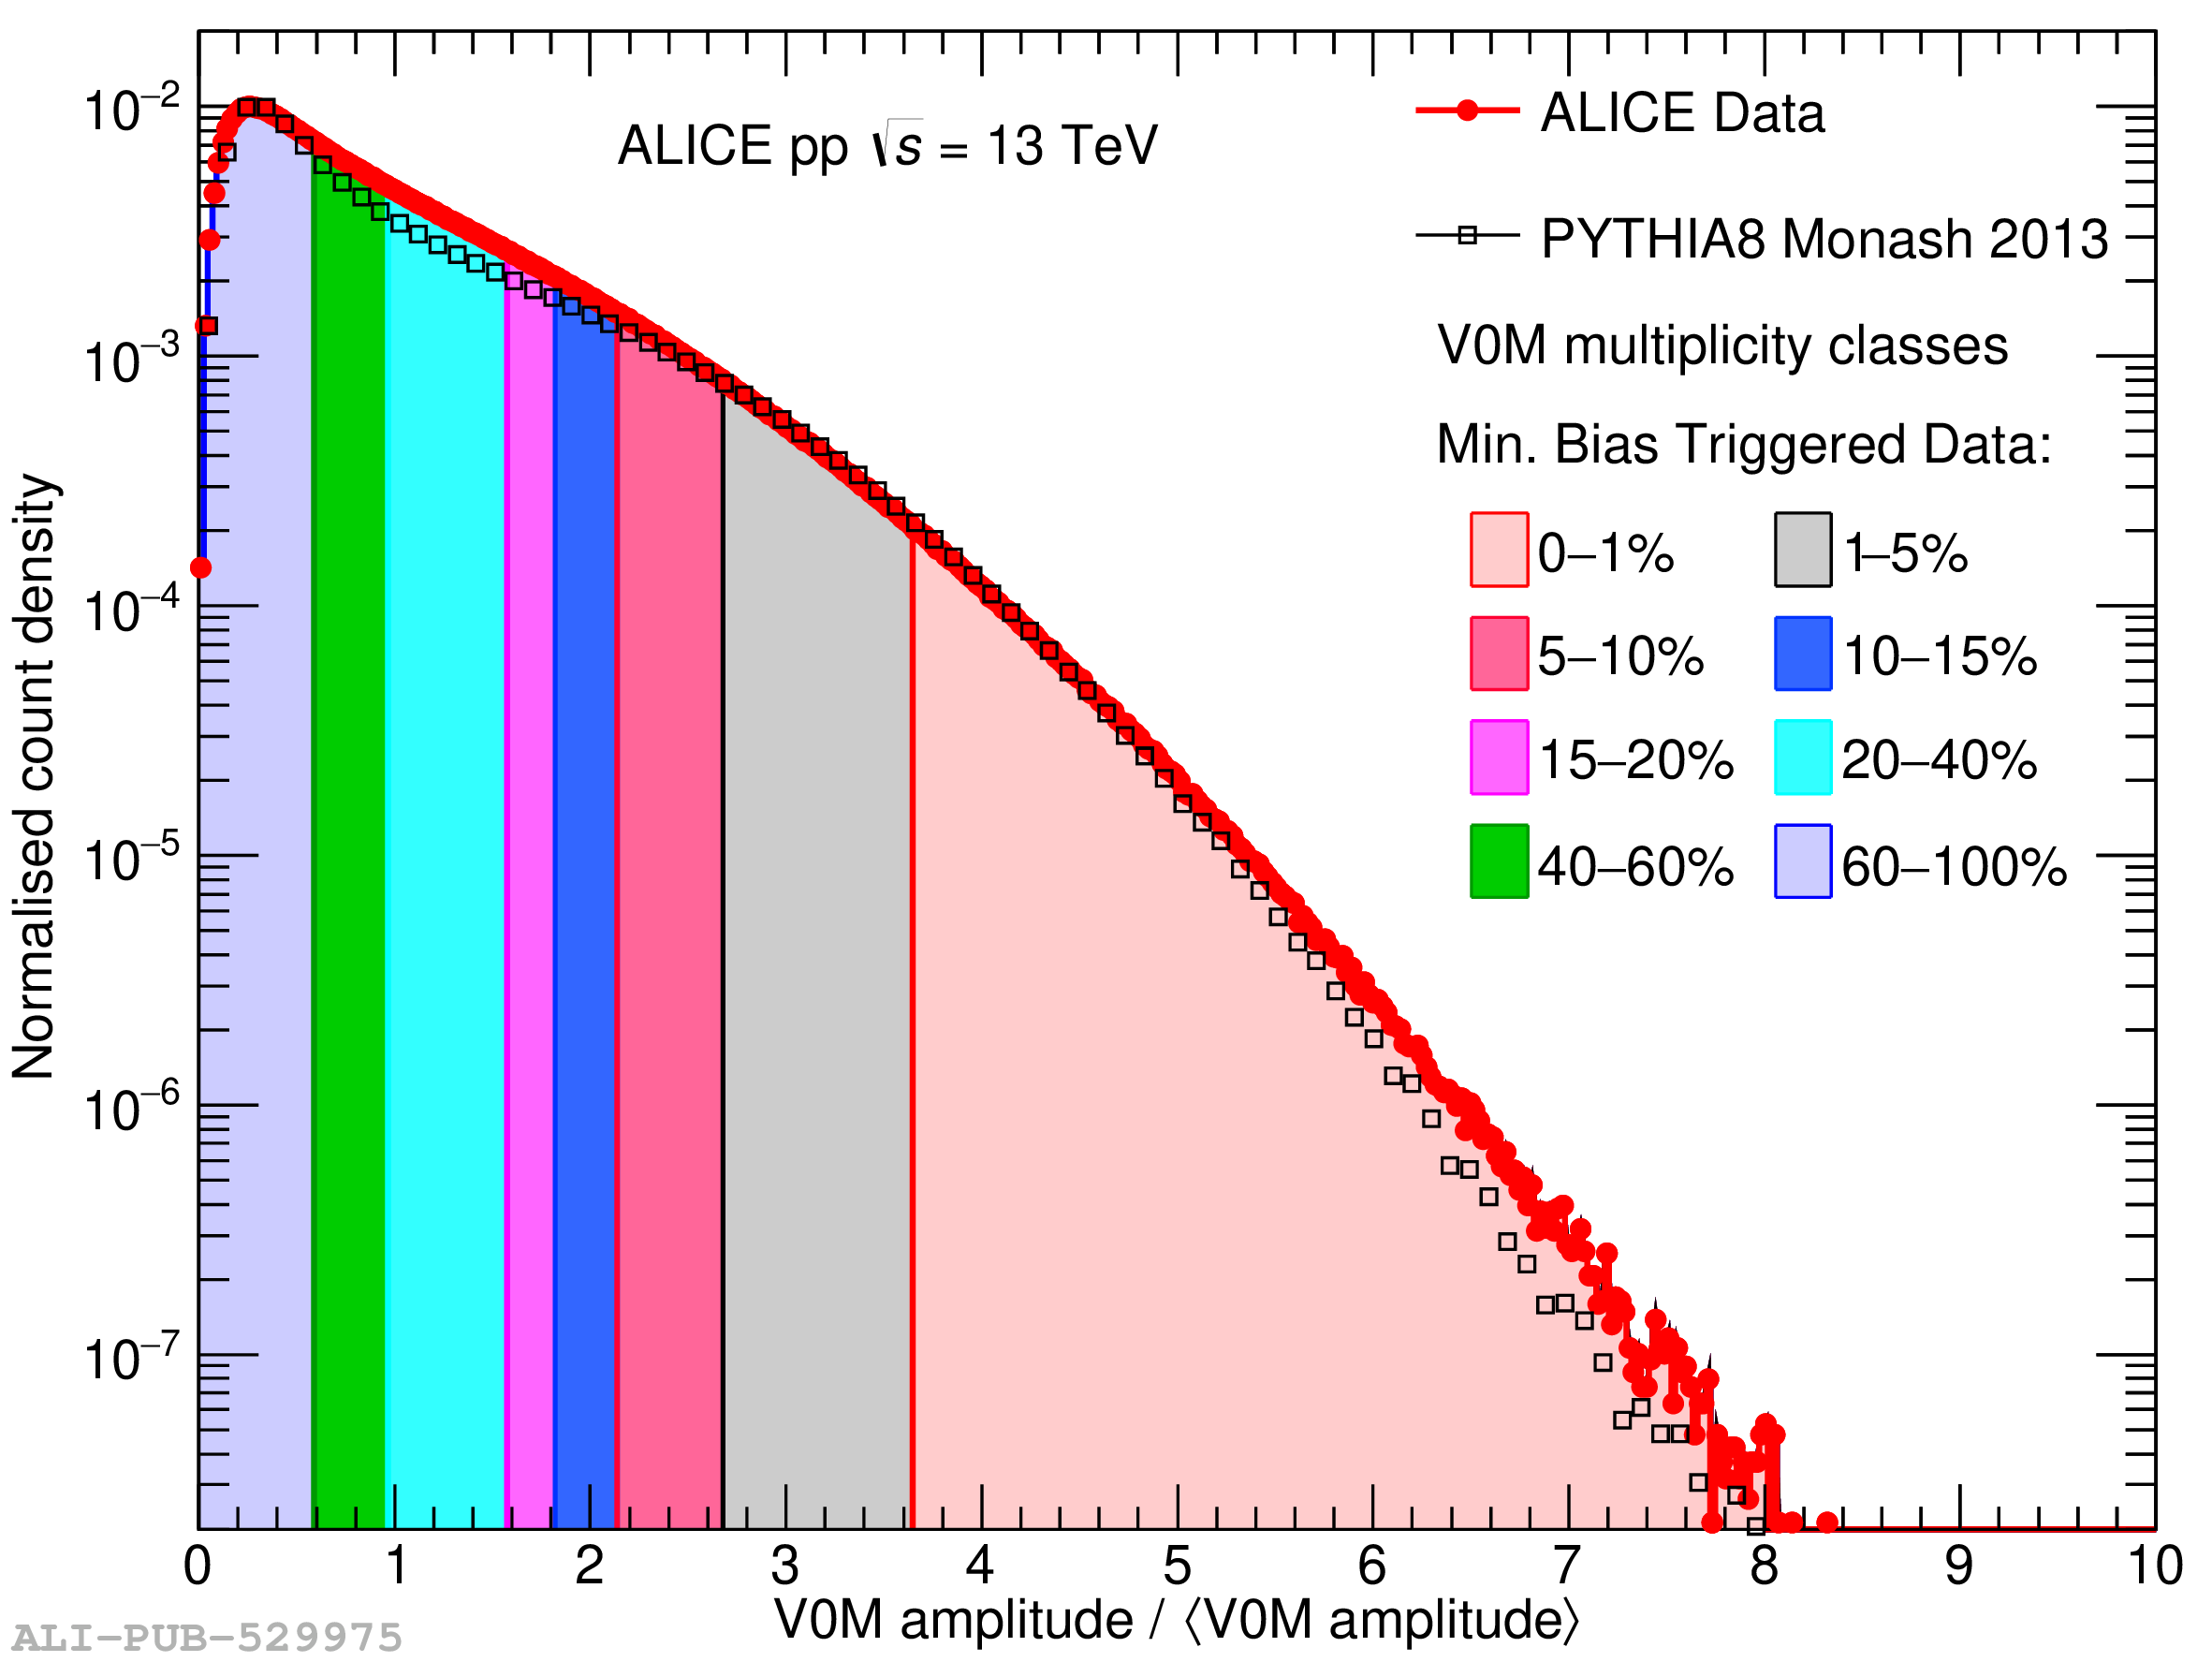
Figure 1

Scaled V0M distribution which is used to determine the forward multiplicity classes in pp collisions at $\sqrt{s}$ = 13 TeV. The colour shaded areas represent V0M multiplicity classes obtained from real data. The PYTHIA8 distribution is shown with the open black markers.

Figure 2

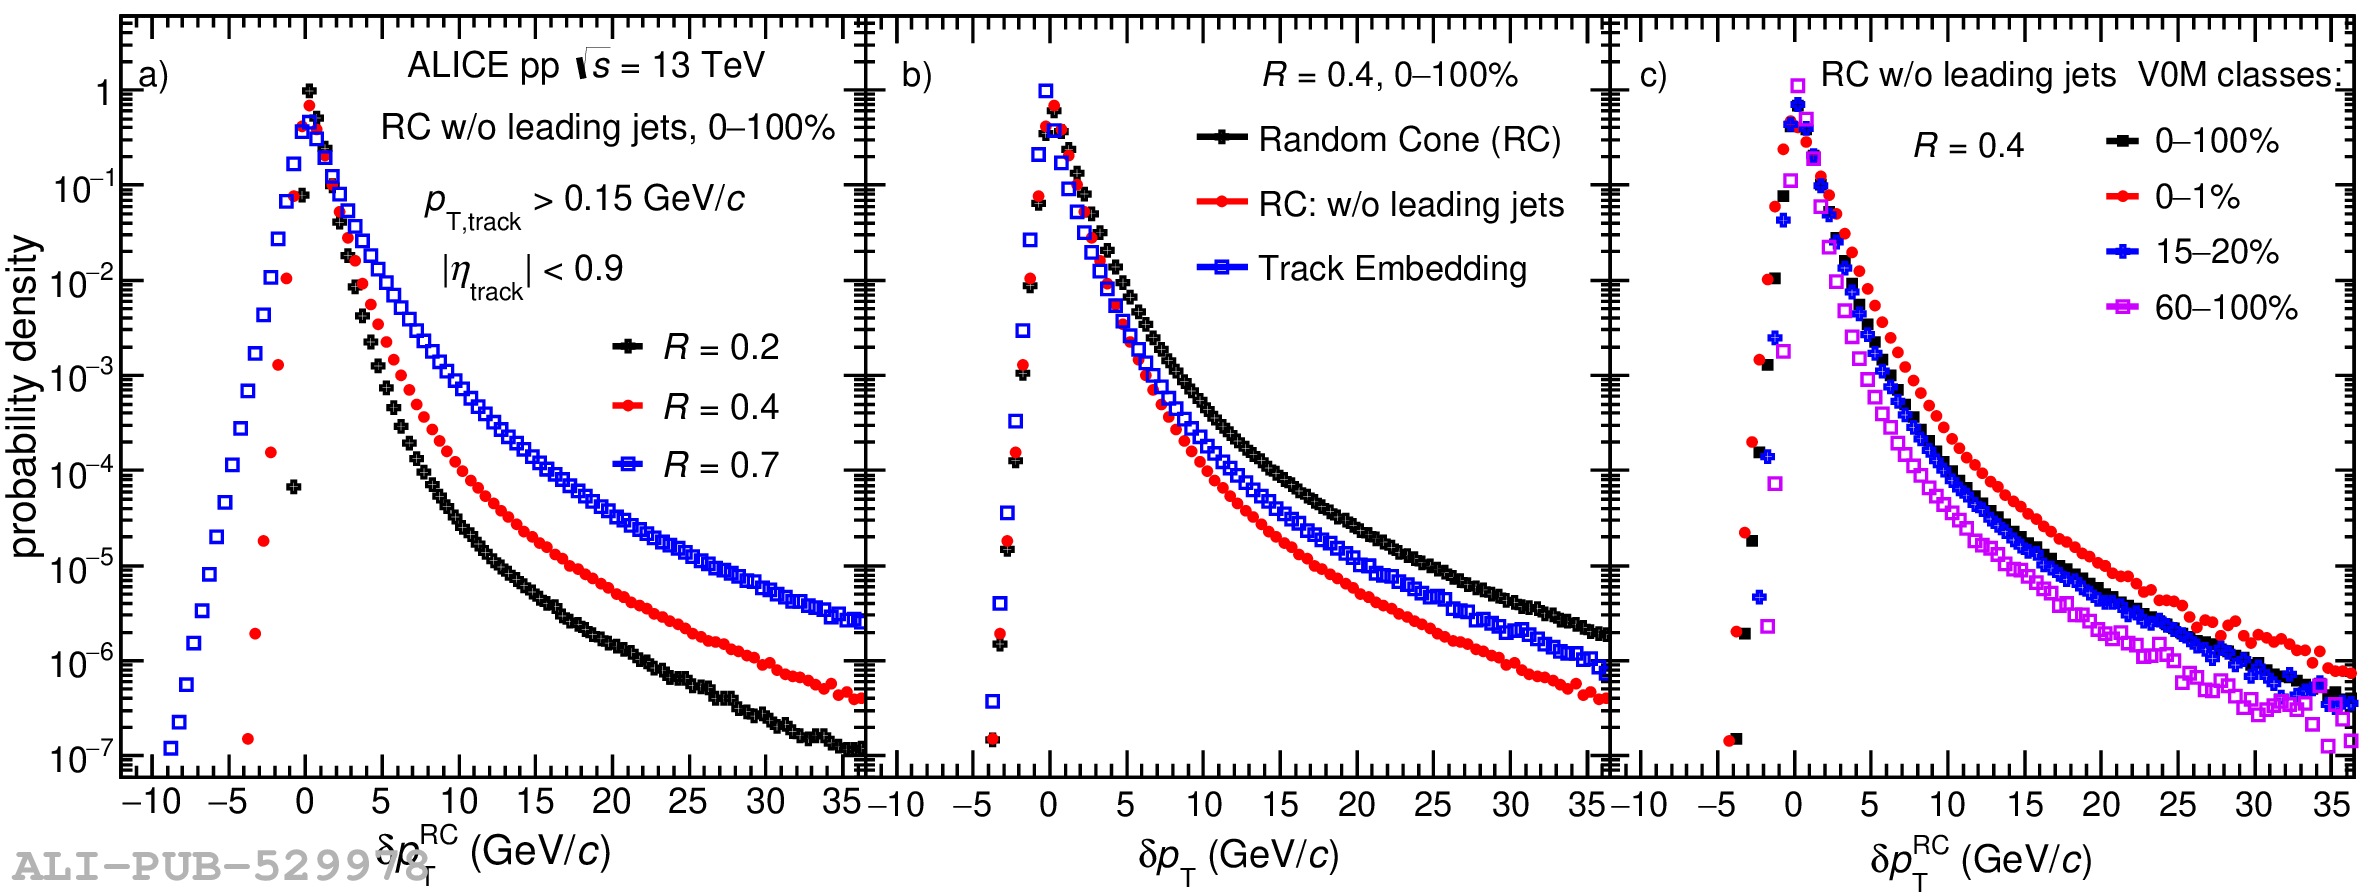
a) Comparison of the $\delta p_{\rm T}$ distribution obtained for different random cone radii ($R=0.2, 0.4, 0.7$). b) Comparison of the $\delta p_{\rm T}$ distribution with the RC method (including and excluding two leading jets) and the track embedding approach for $R=0.4$. c) Comparison of measured $\delta p_{\rm T}$ distribution using RC method without leading jets for $R=0.4$ in different multiplicity classes.

Figure 3

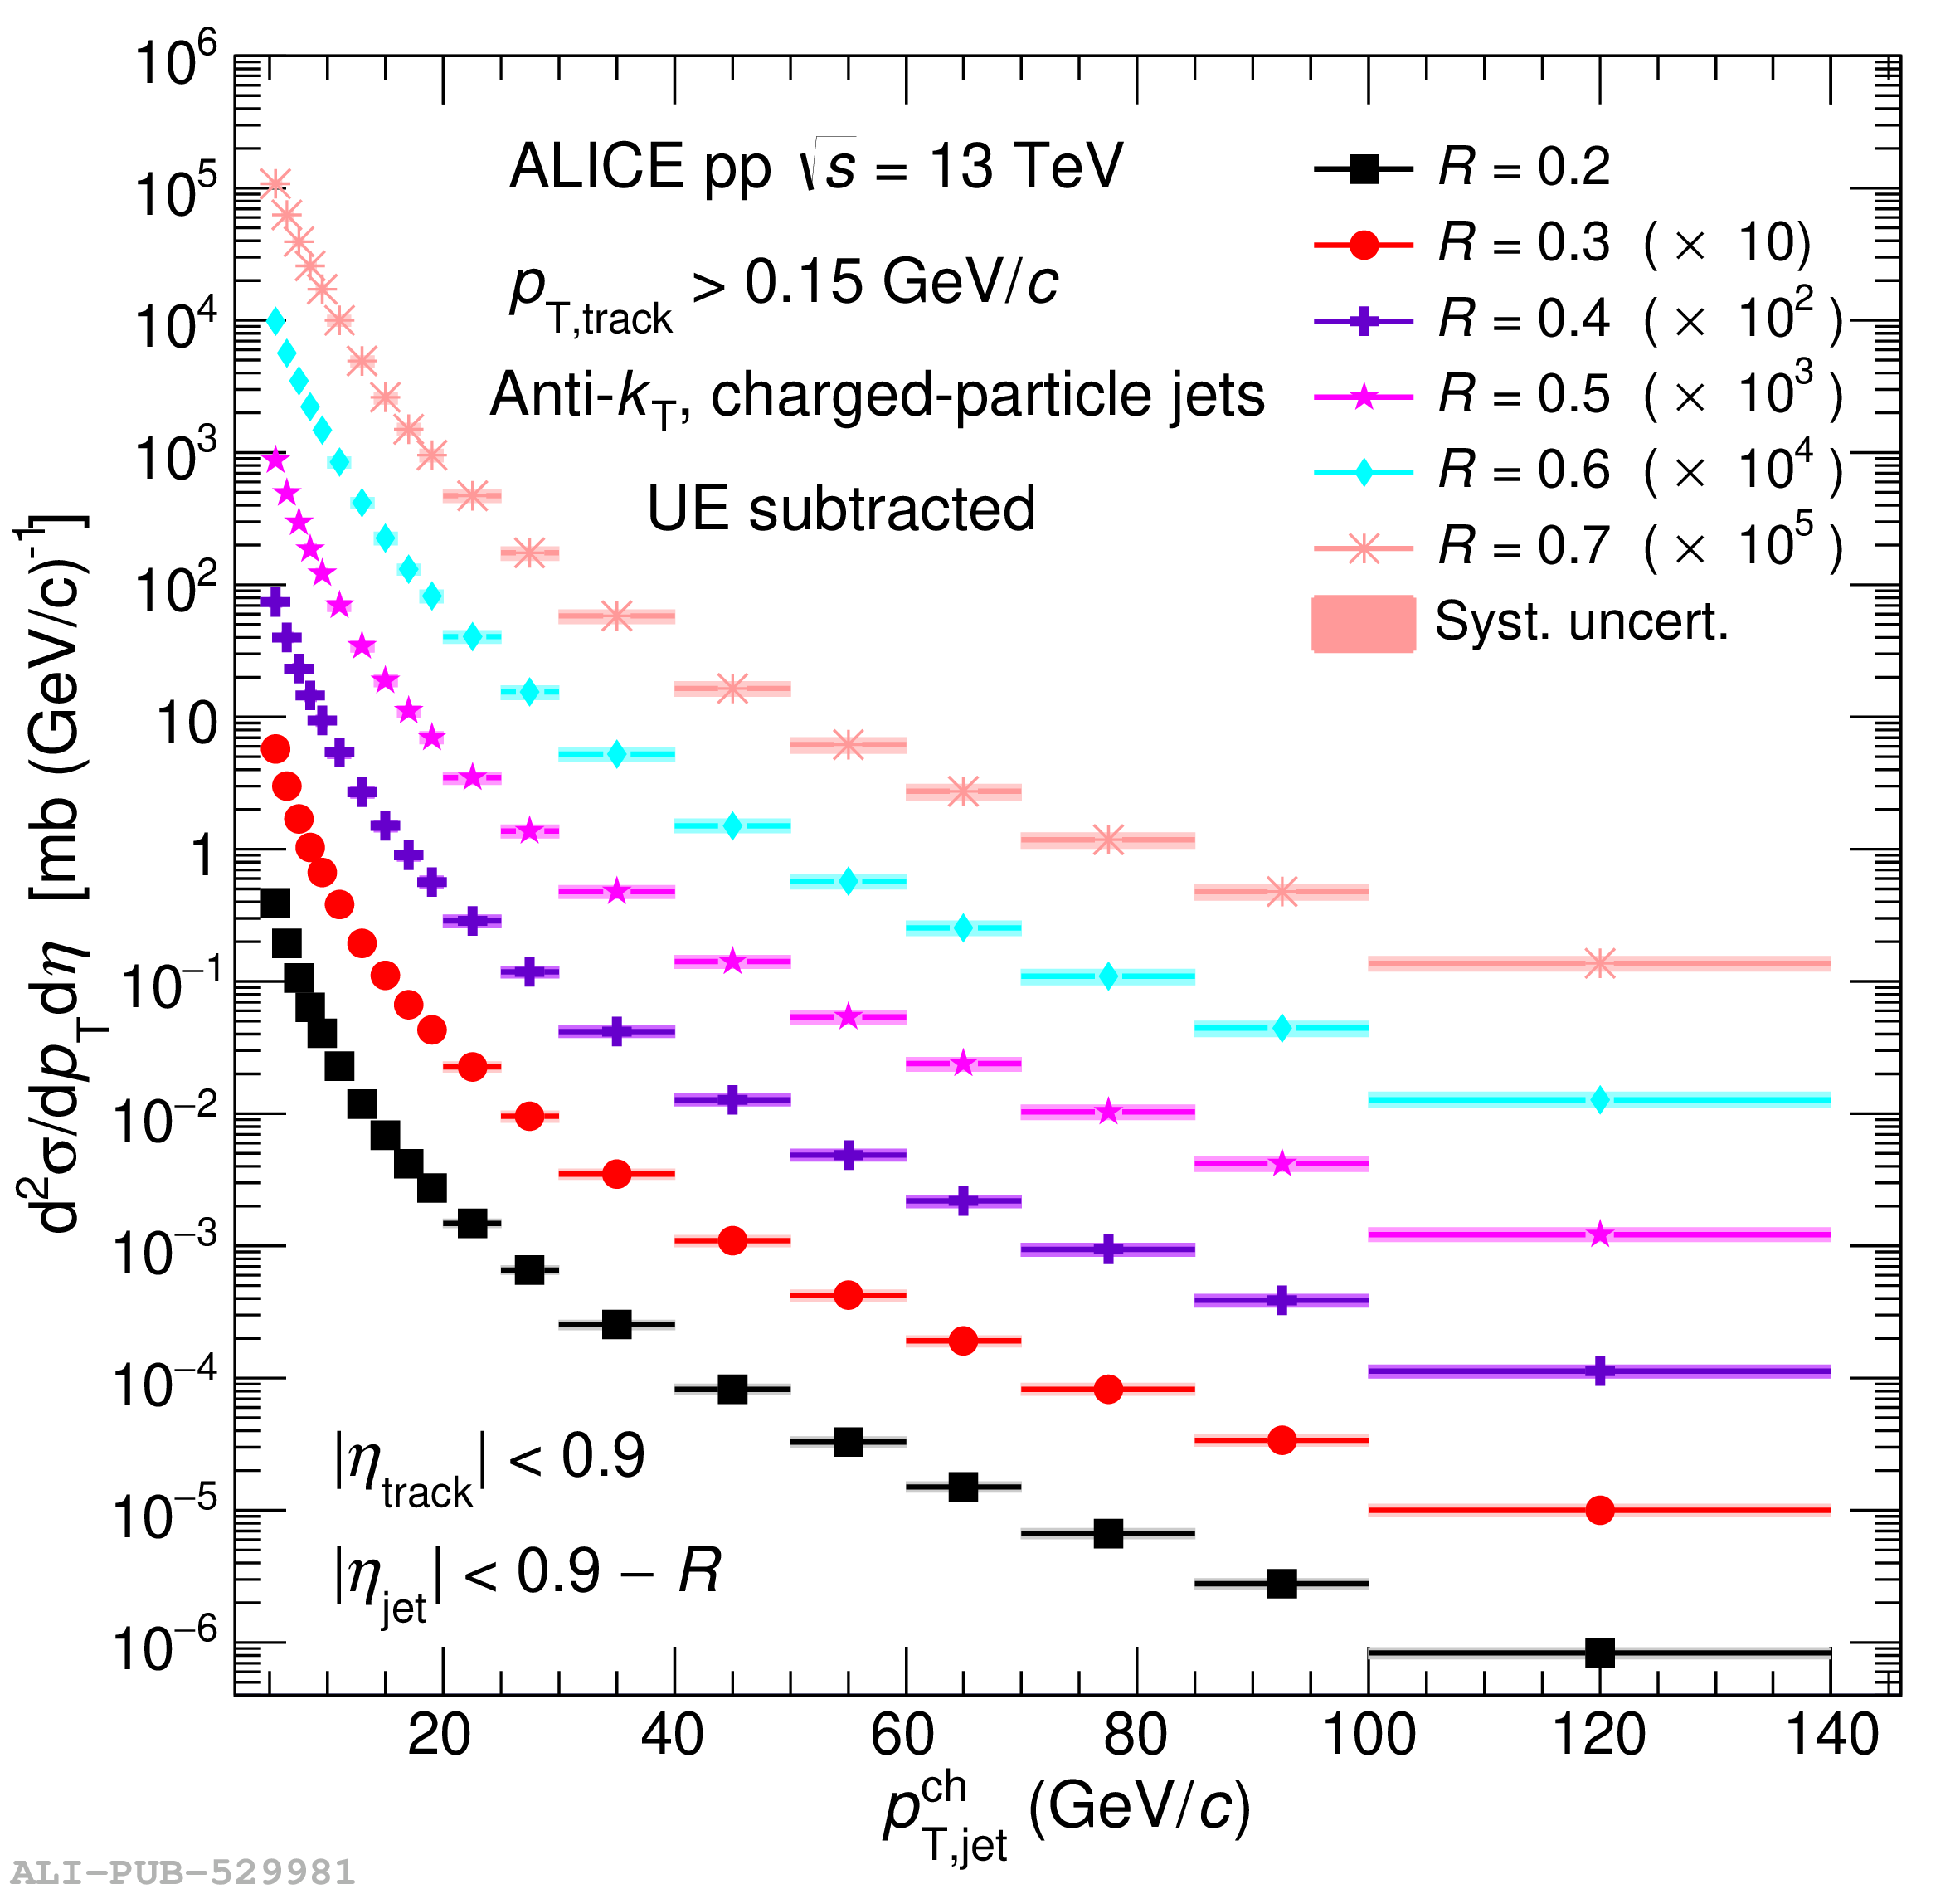
Inclusive charged-particle jet cross sections in pp collisions at $\sqrt{s} = 13$ TeV using the anti-$k_{\rm T}$ algorithm for different jet resolution parameters $R$ from $0.2$ to $0.7$, with UE subtraction. Statistical uncertainties are displayed as vertical error bars. The total systematic uncertainties are shown as solid boxes around the data points.

Figure 4

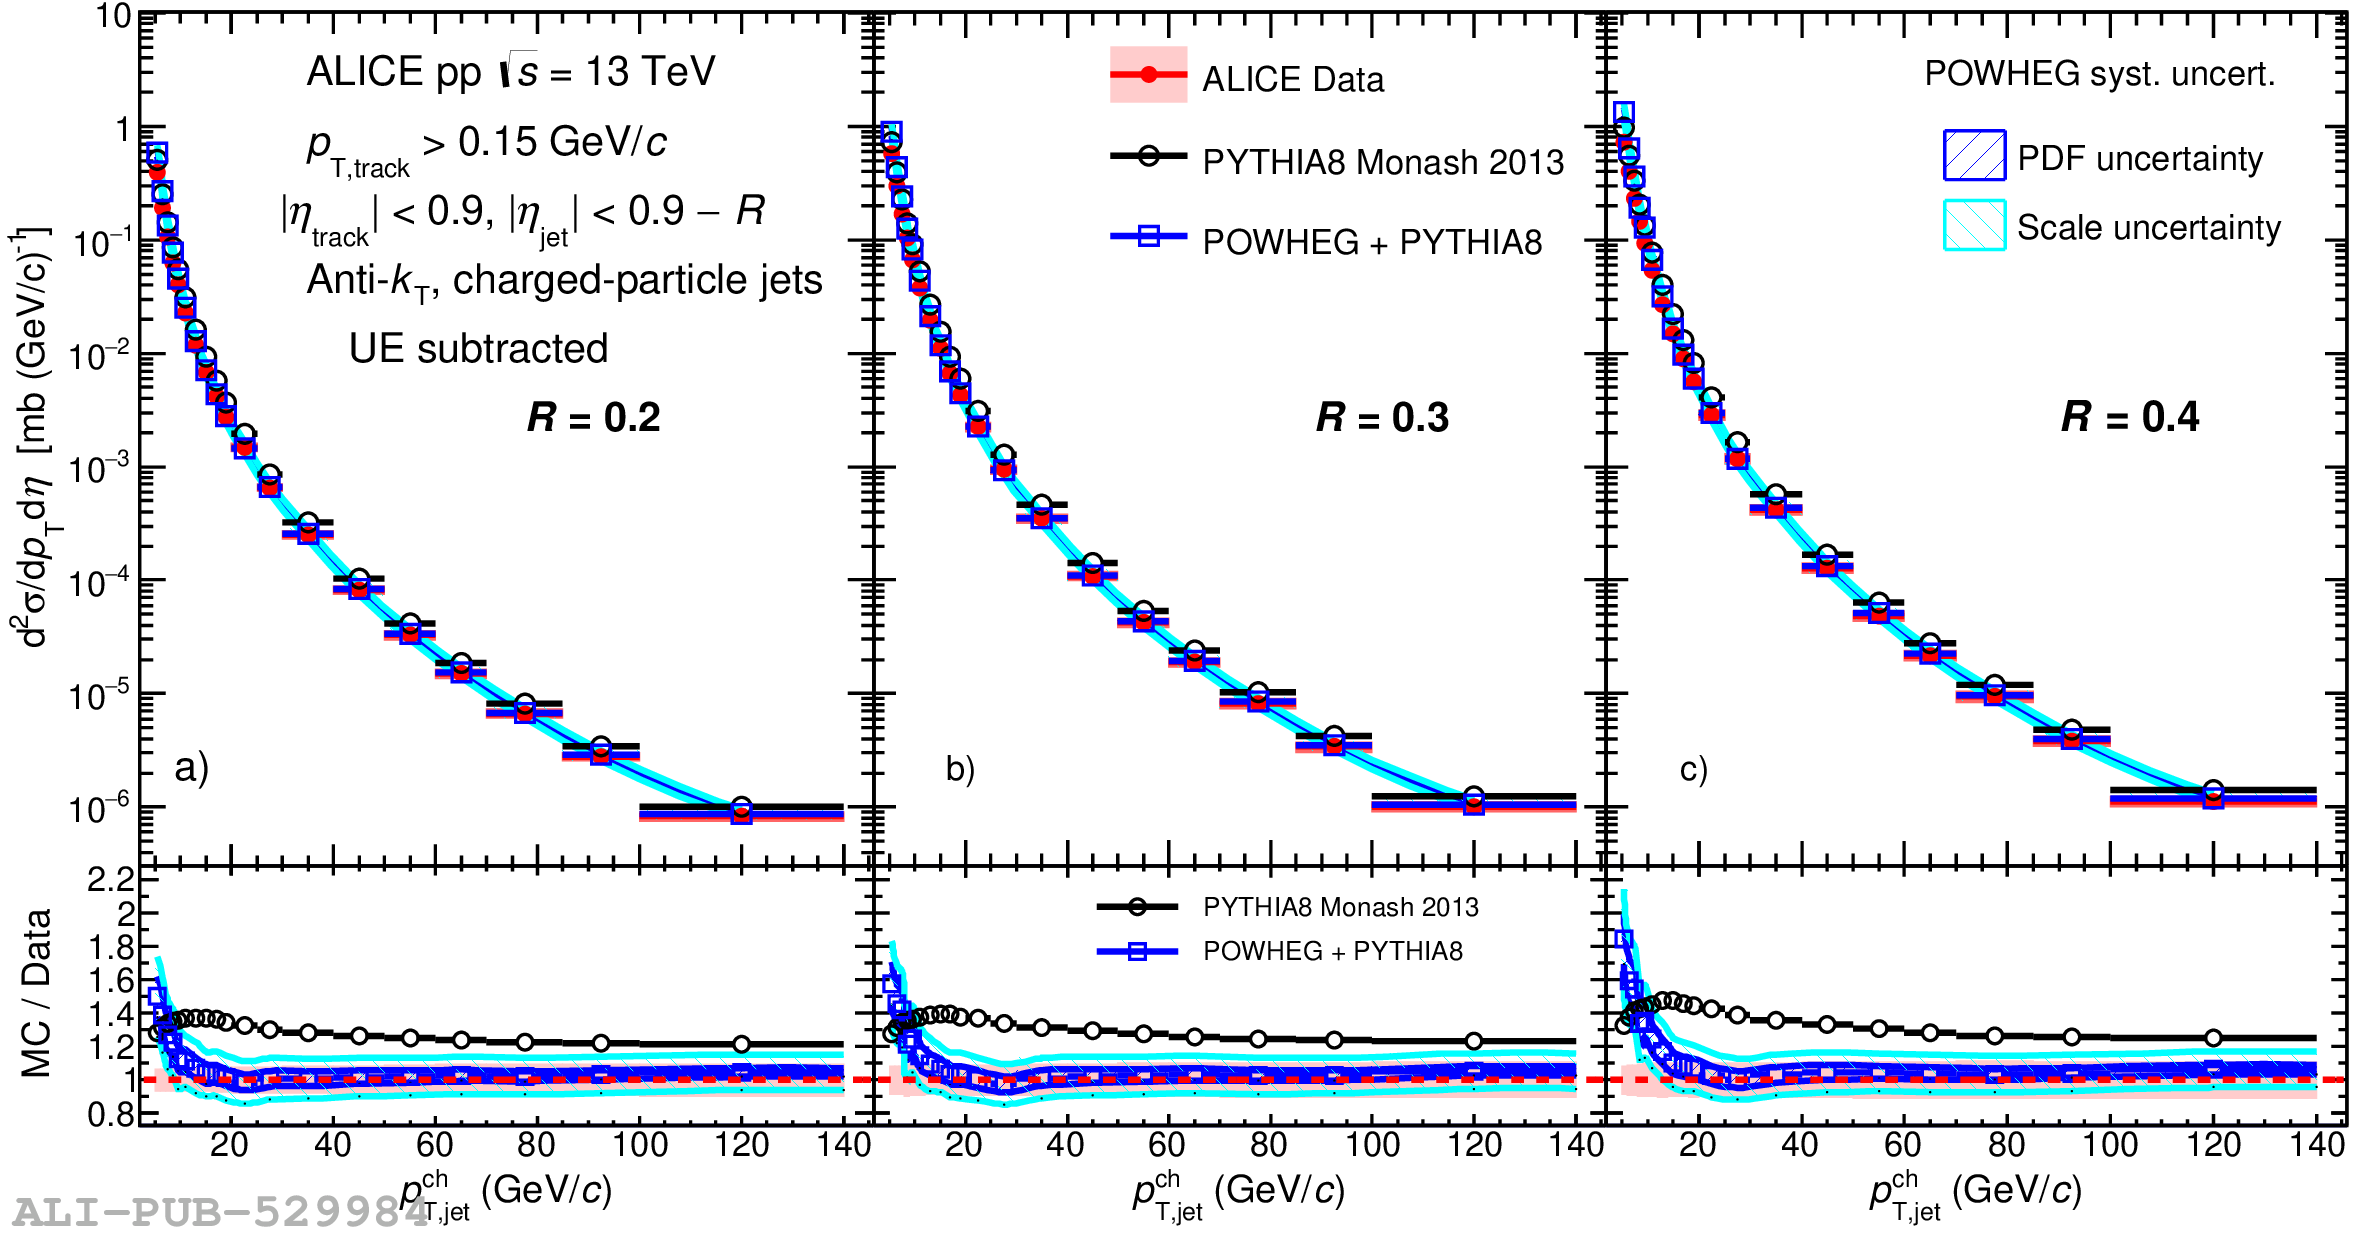
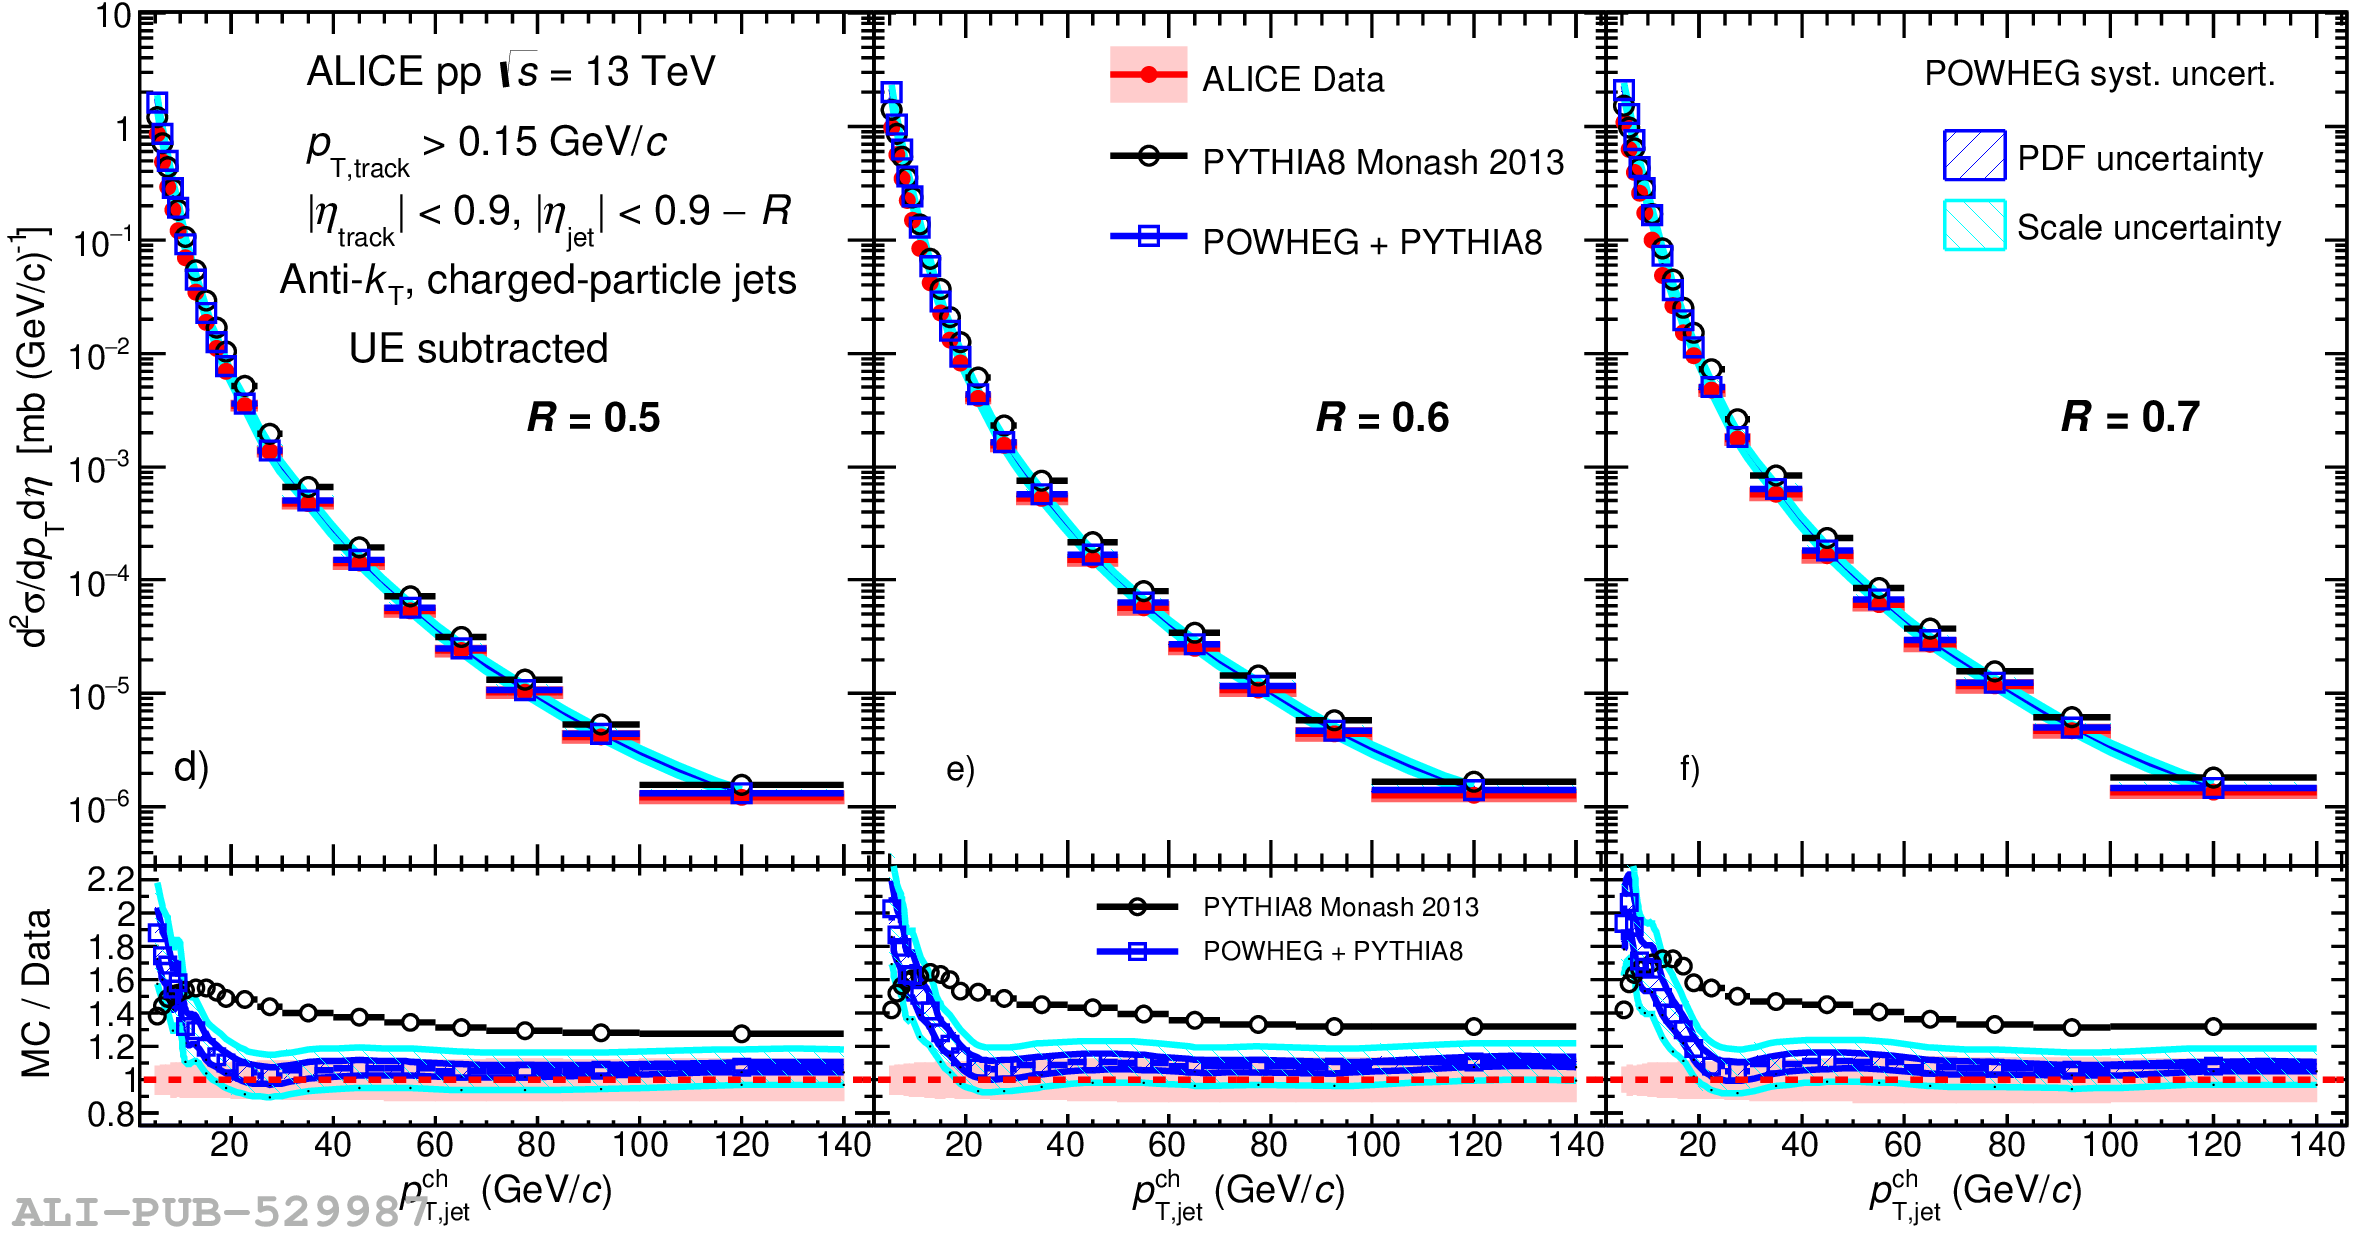
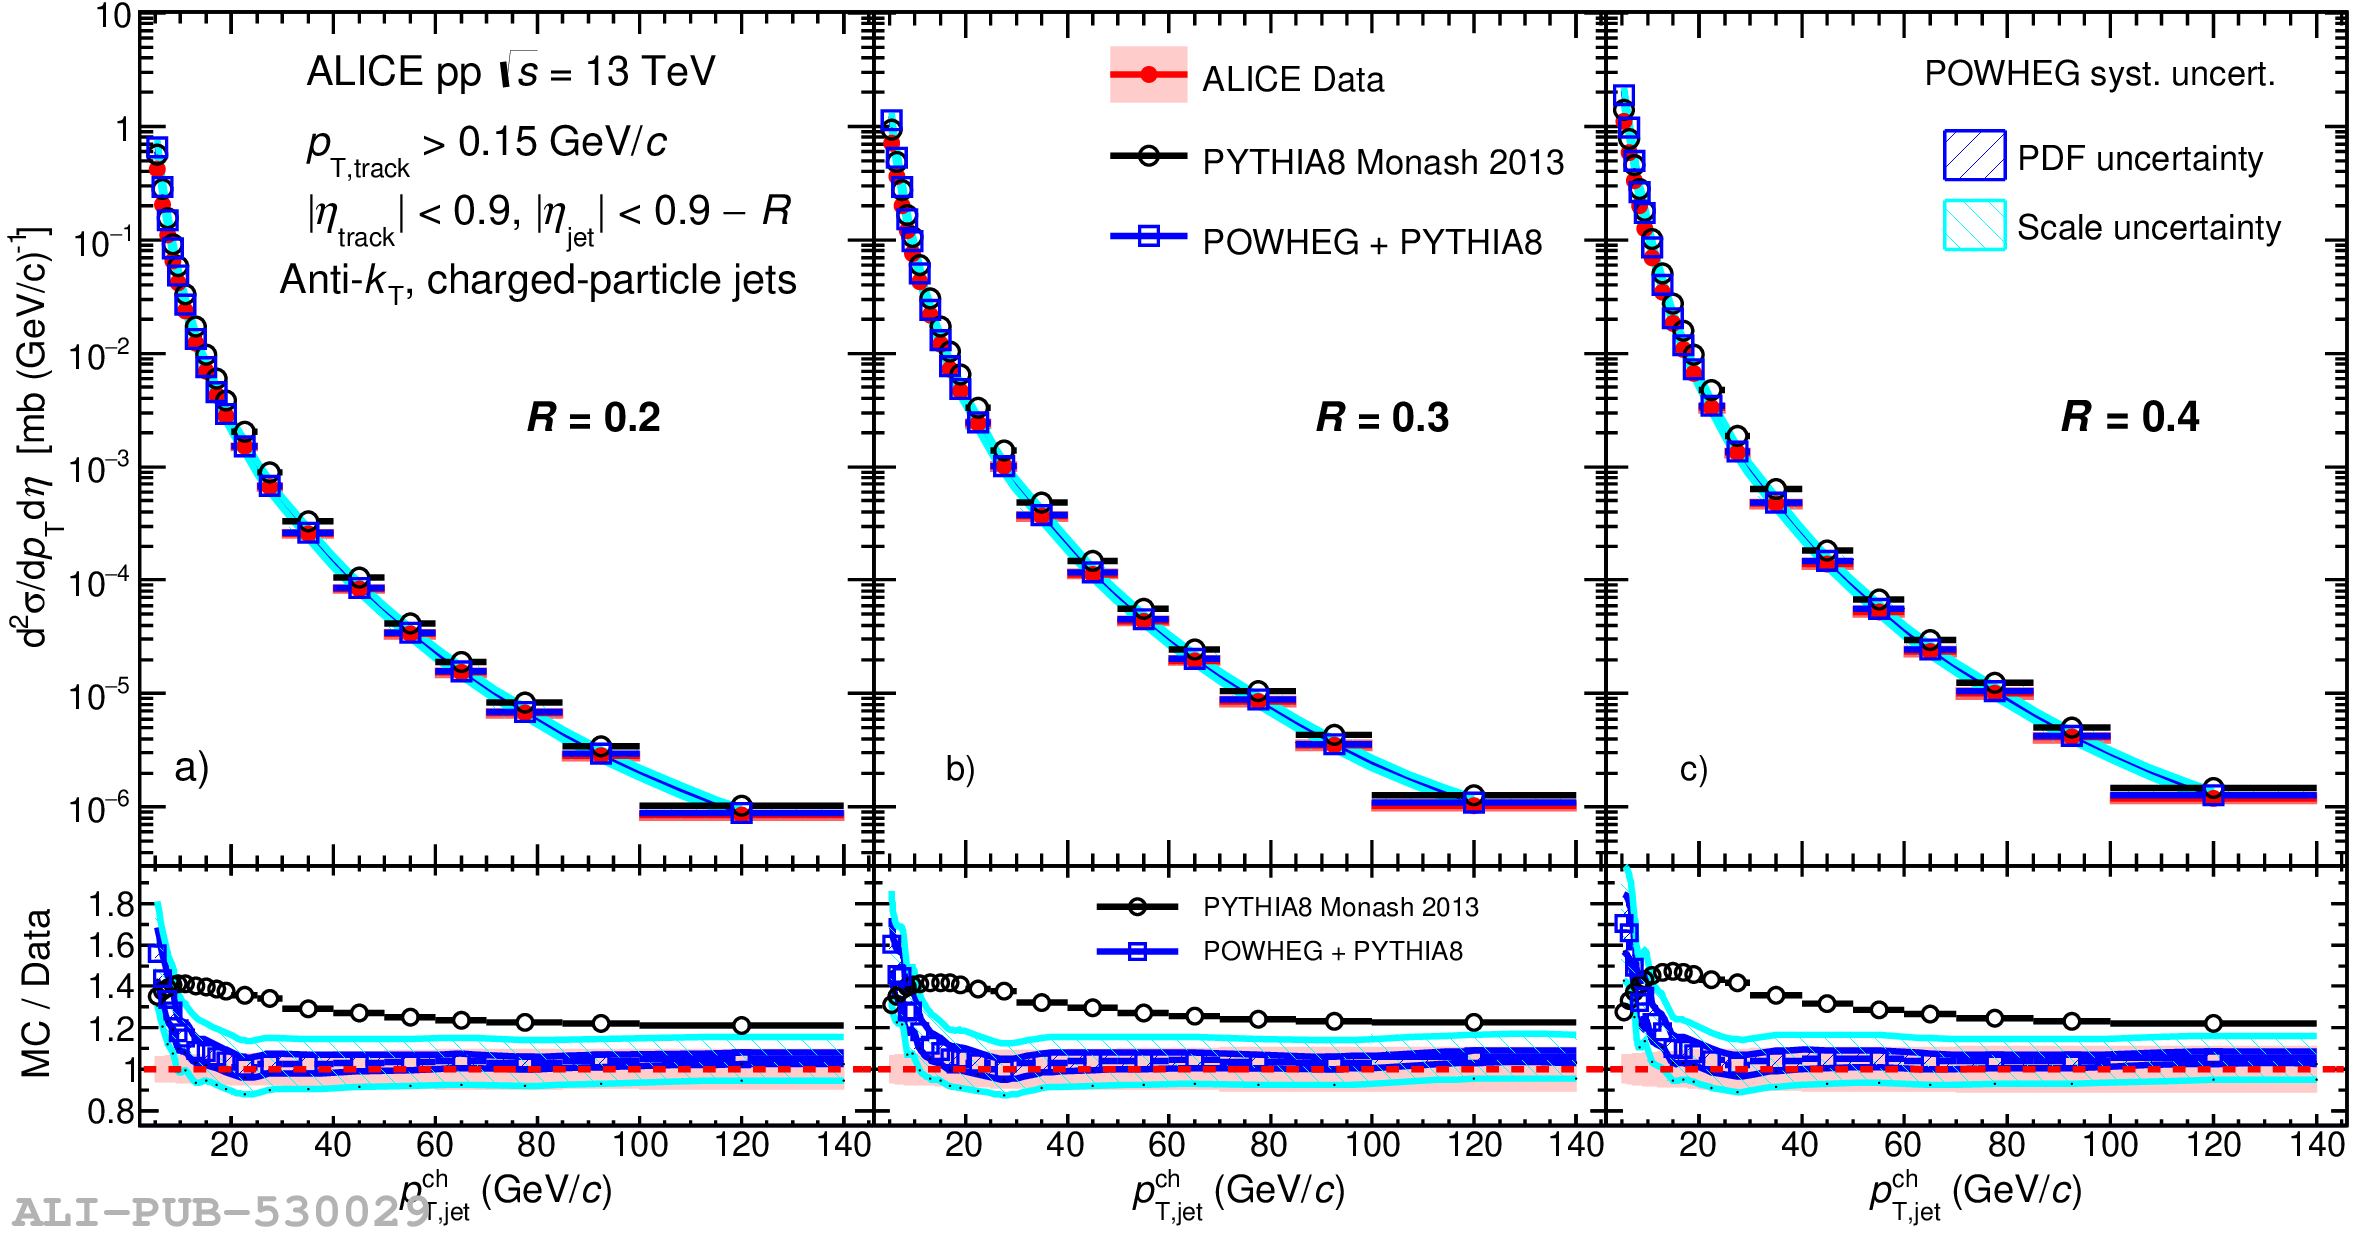
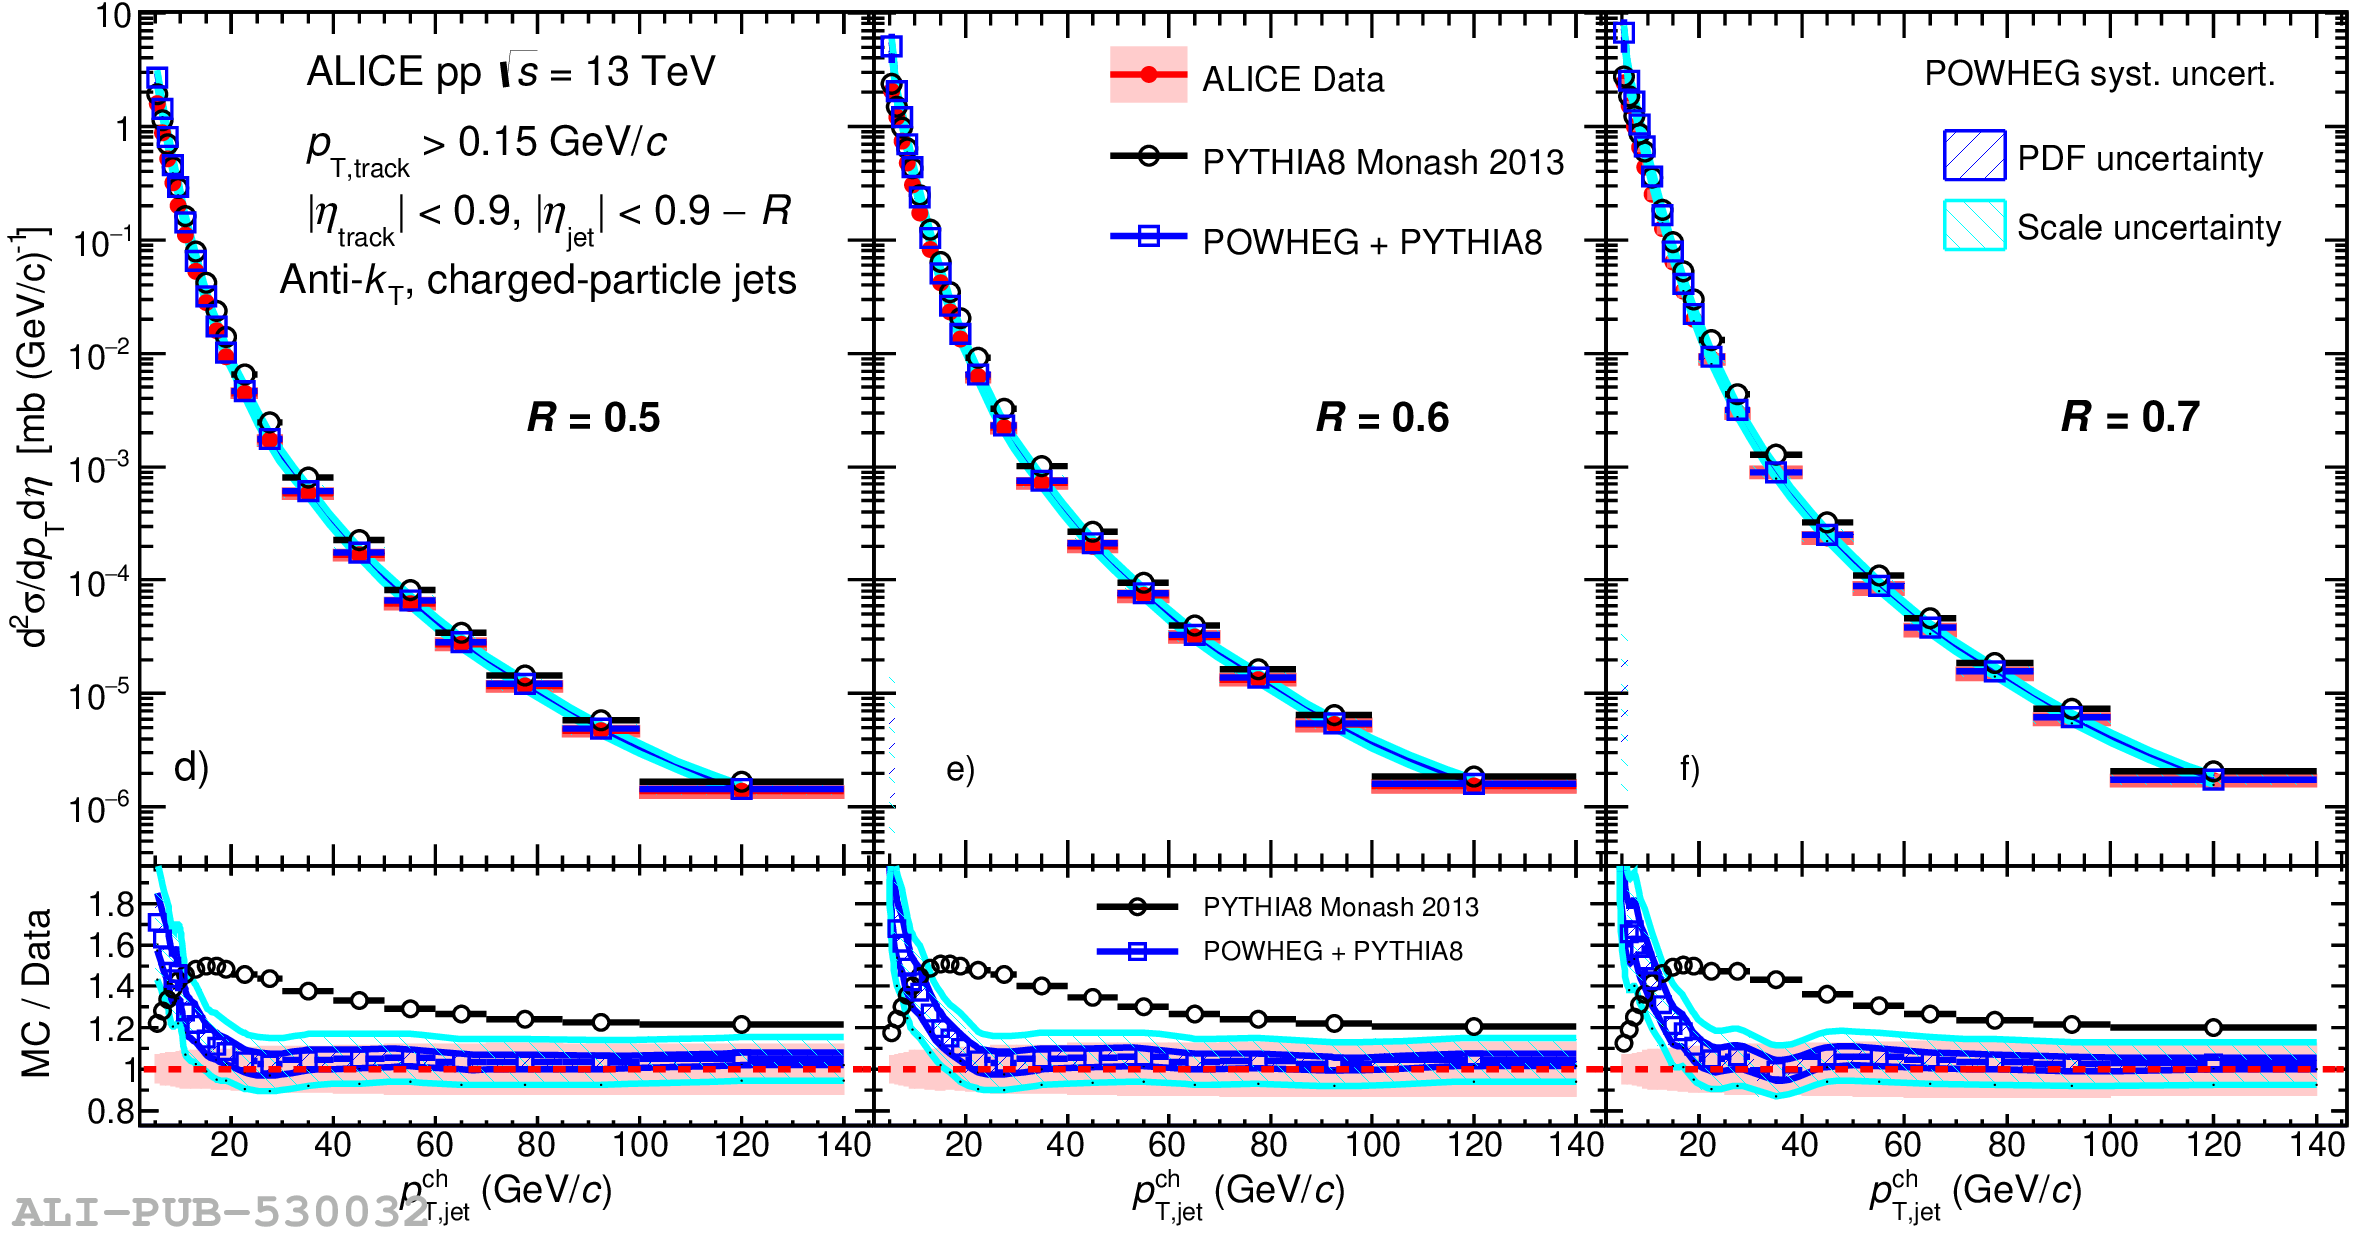
Inclusive charged-particle jet cross sections in pp collisions at $\sqrt{s} = 13$ TeV with UE subtraction. Data for different jet resolution parameters $R$ varied from $0.2$ to $0.7$ are compared to LO and NLO MC predictions. The statistical uncertainties are displayed as vertical error bars. The systematic uncertainties on the data are indicated by shaded boxes in the top panels and shaded bands drawn around unity in the bottom panels. The red lines in the ratio correspond to unity.

Figure 5

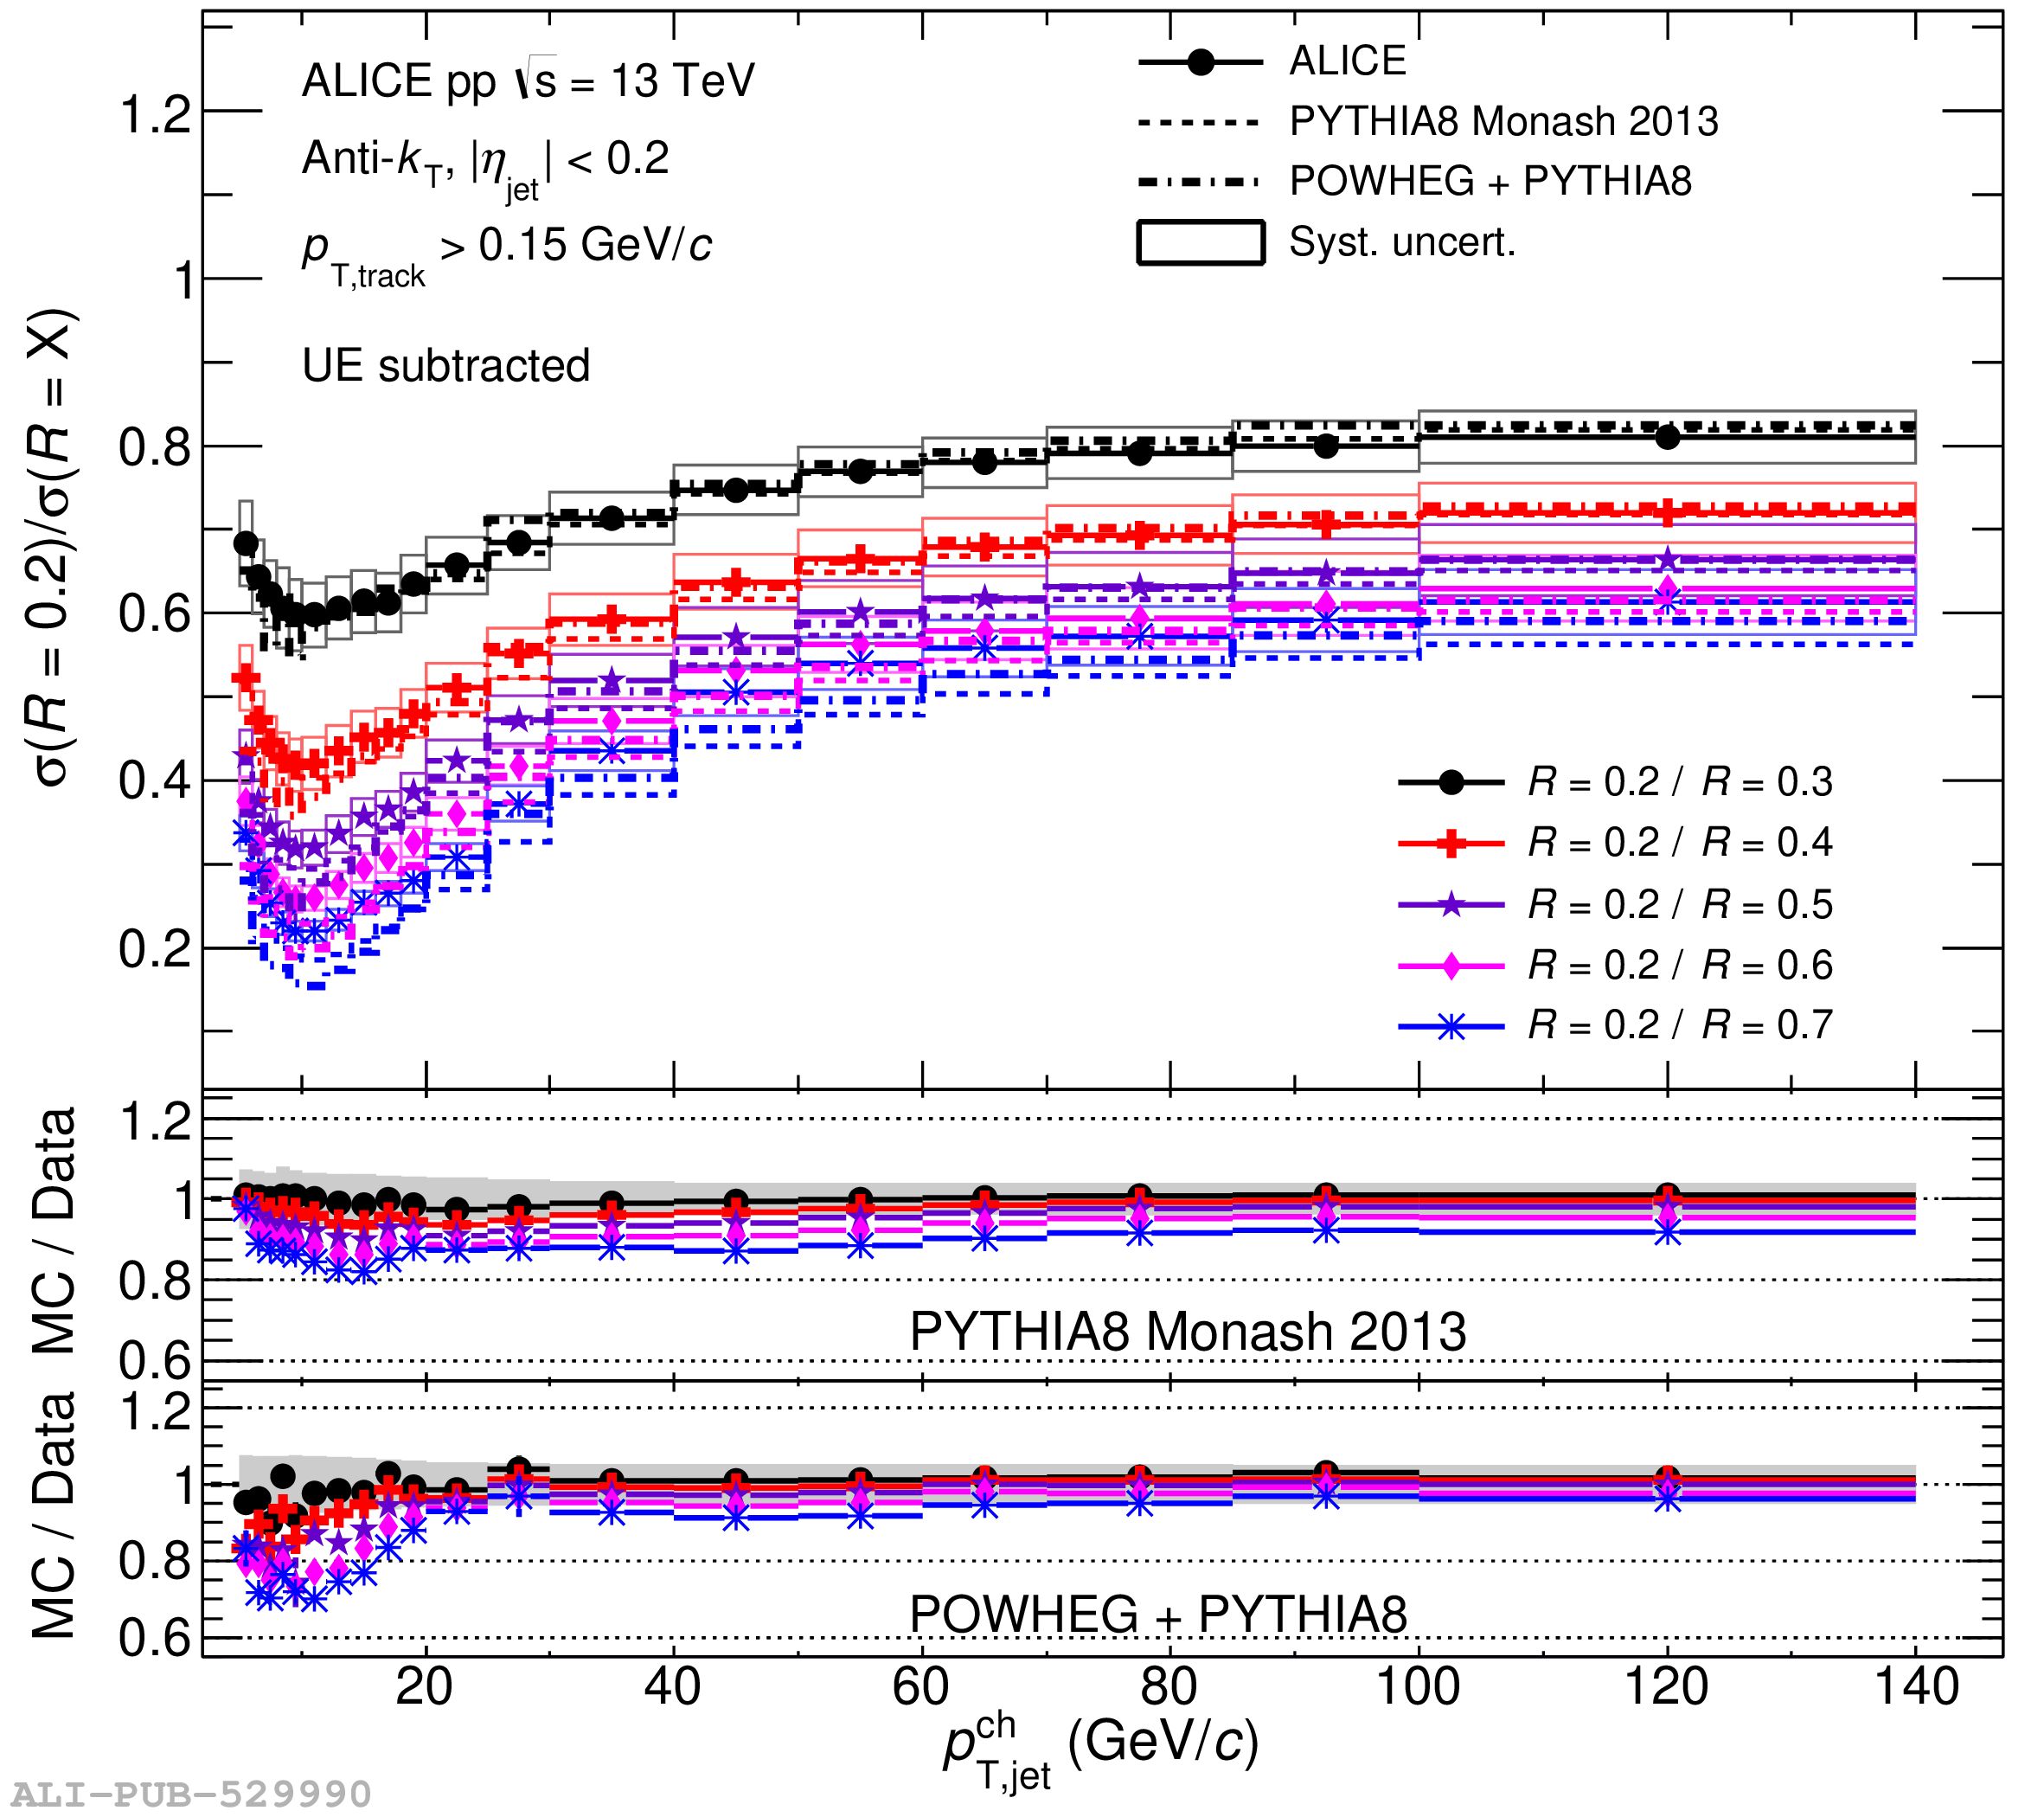
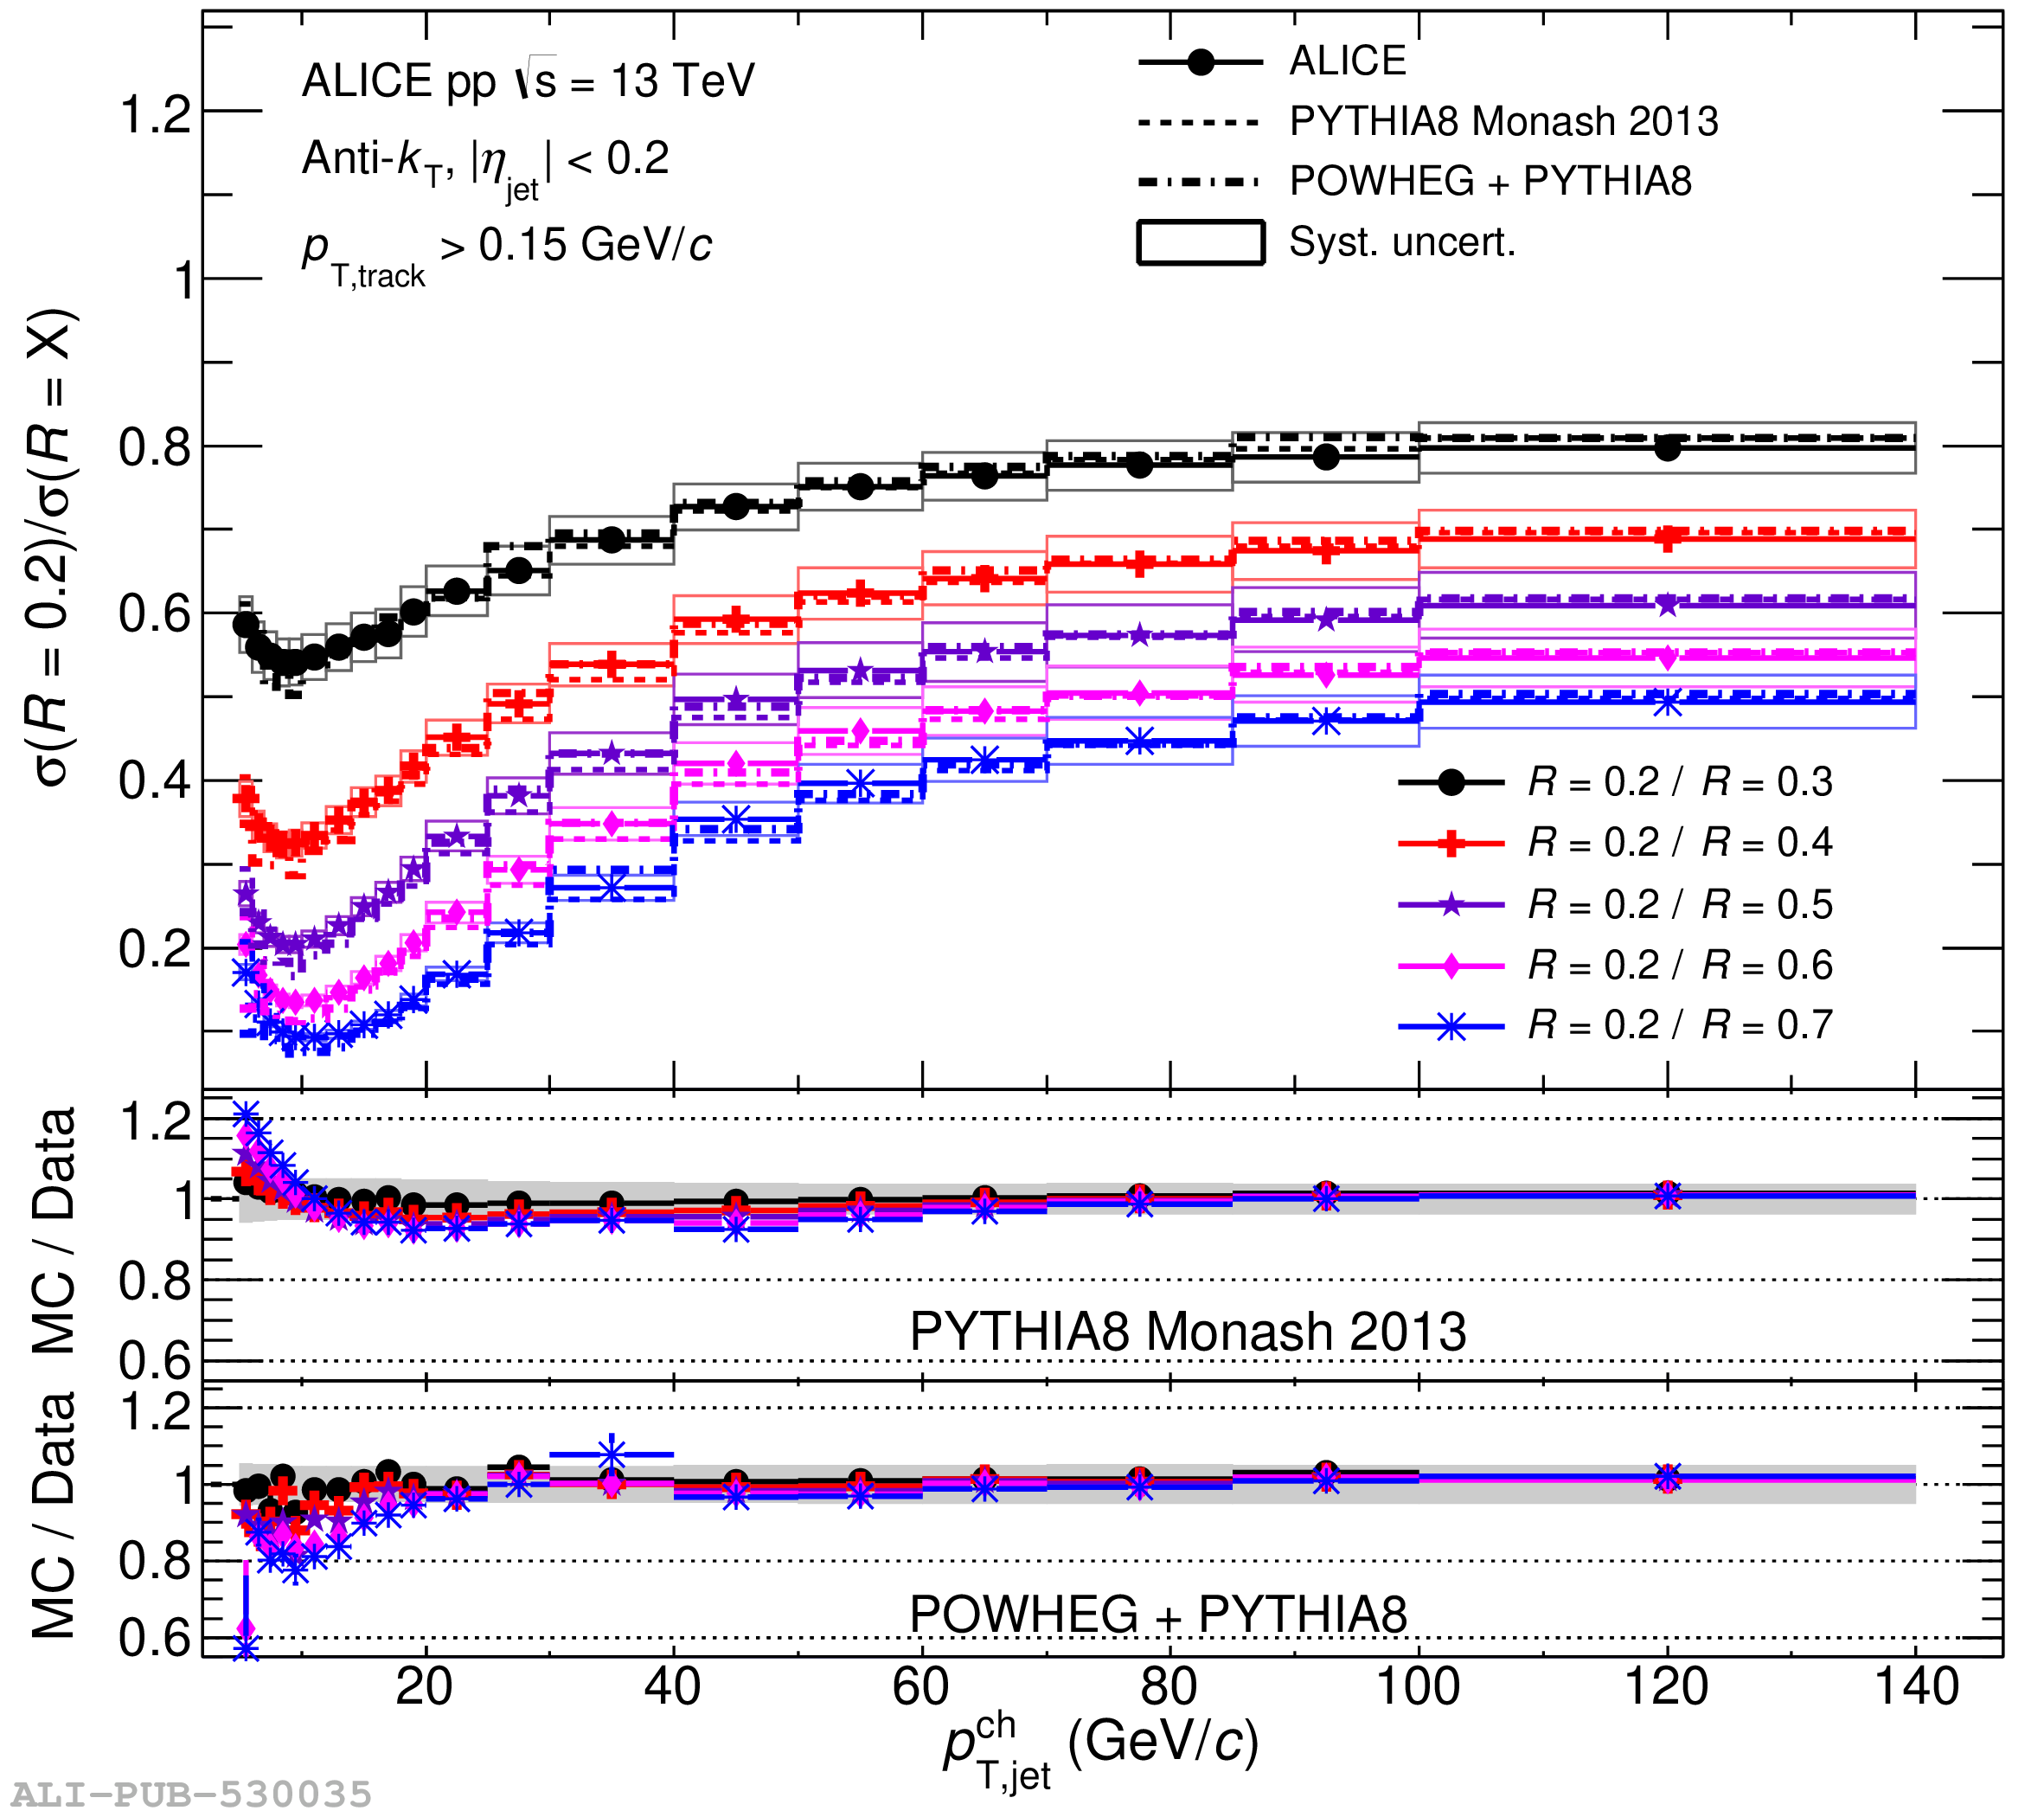
Ratio of charged-particle jet cross section for resolution parameter $R = 0.2$ to other radii $R = X $, with $X$ ranging from $0.3$ to $0.7$, after UE subtraction. Data are compared with LO (PYTHIA) and NLO (POWHEG+PYTHIA8) predictions as shown in the bottom panels. The systematic uncertainties of the cross section ratios from data are indicated by solid boxes around data points in the upper panel and shaded bands around unity in the mid and lower panels. No uncertainties are shown for theoretical predictions for better visibility.

Figure 6

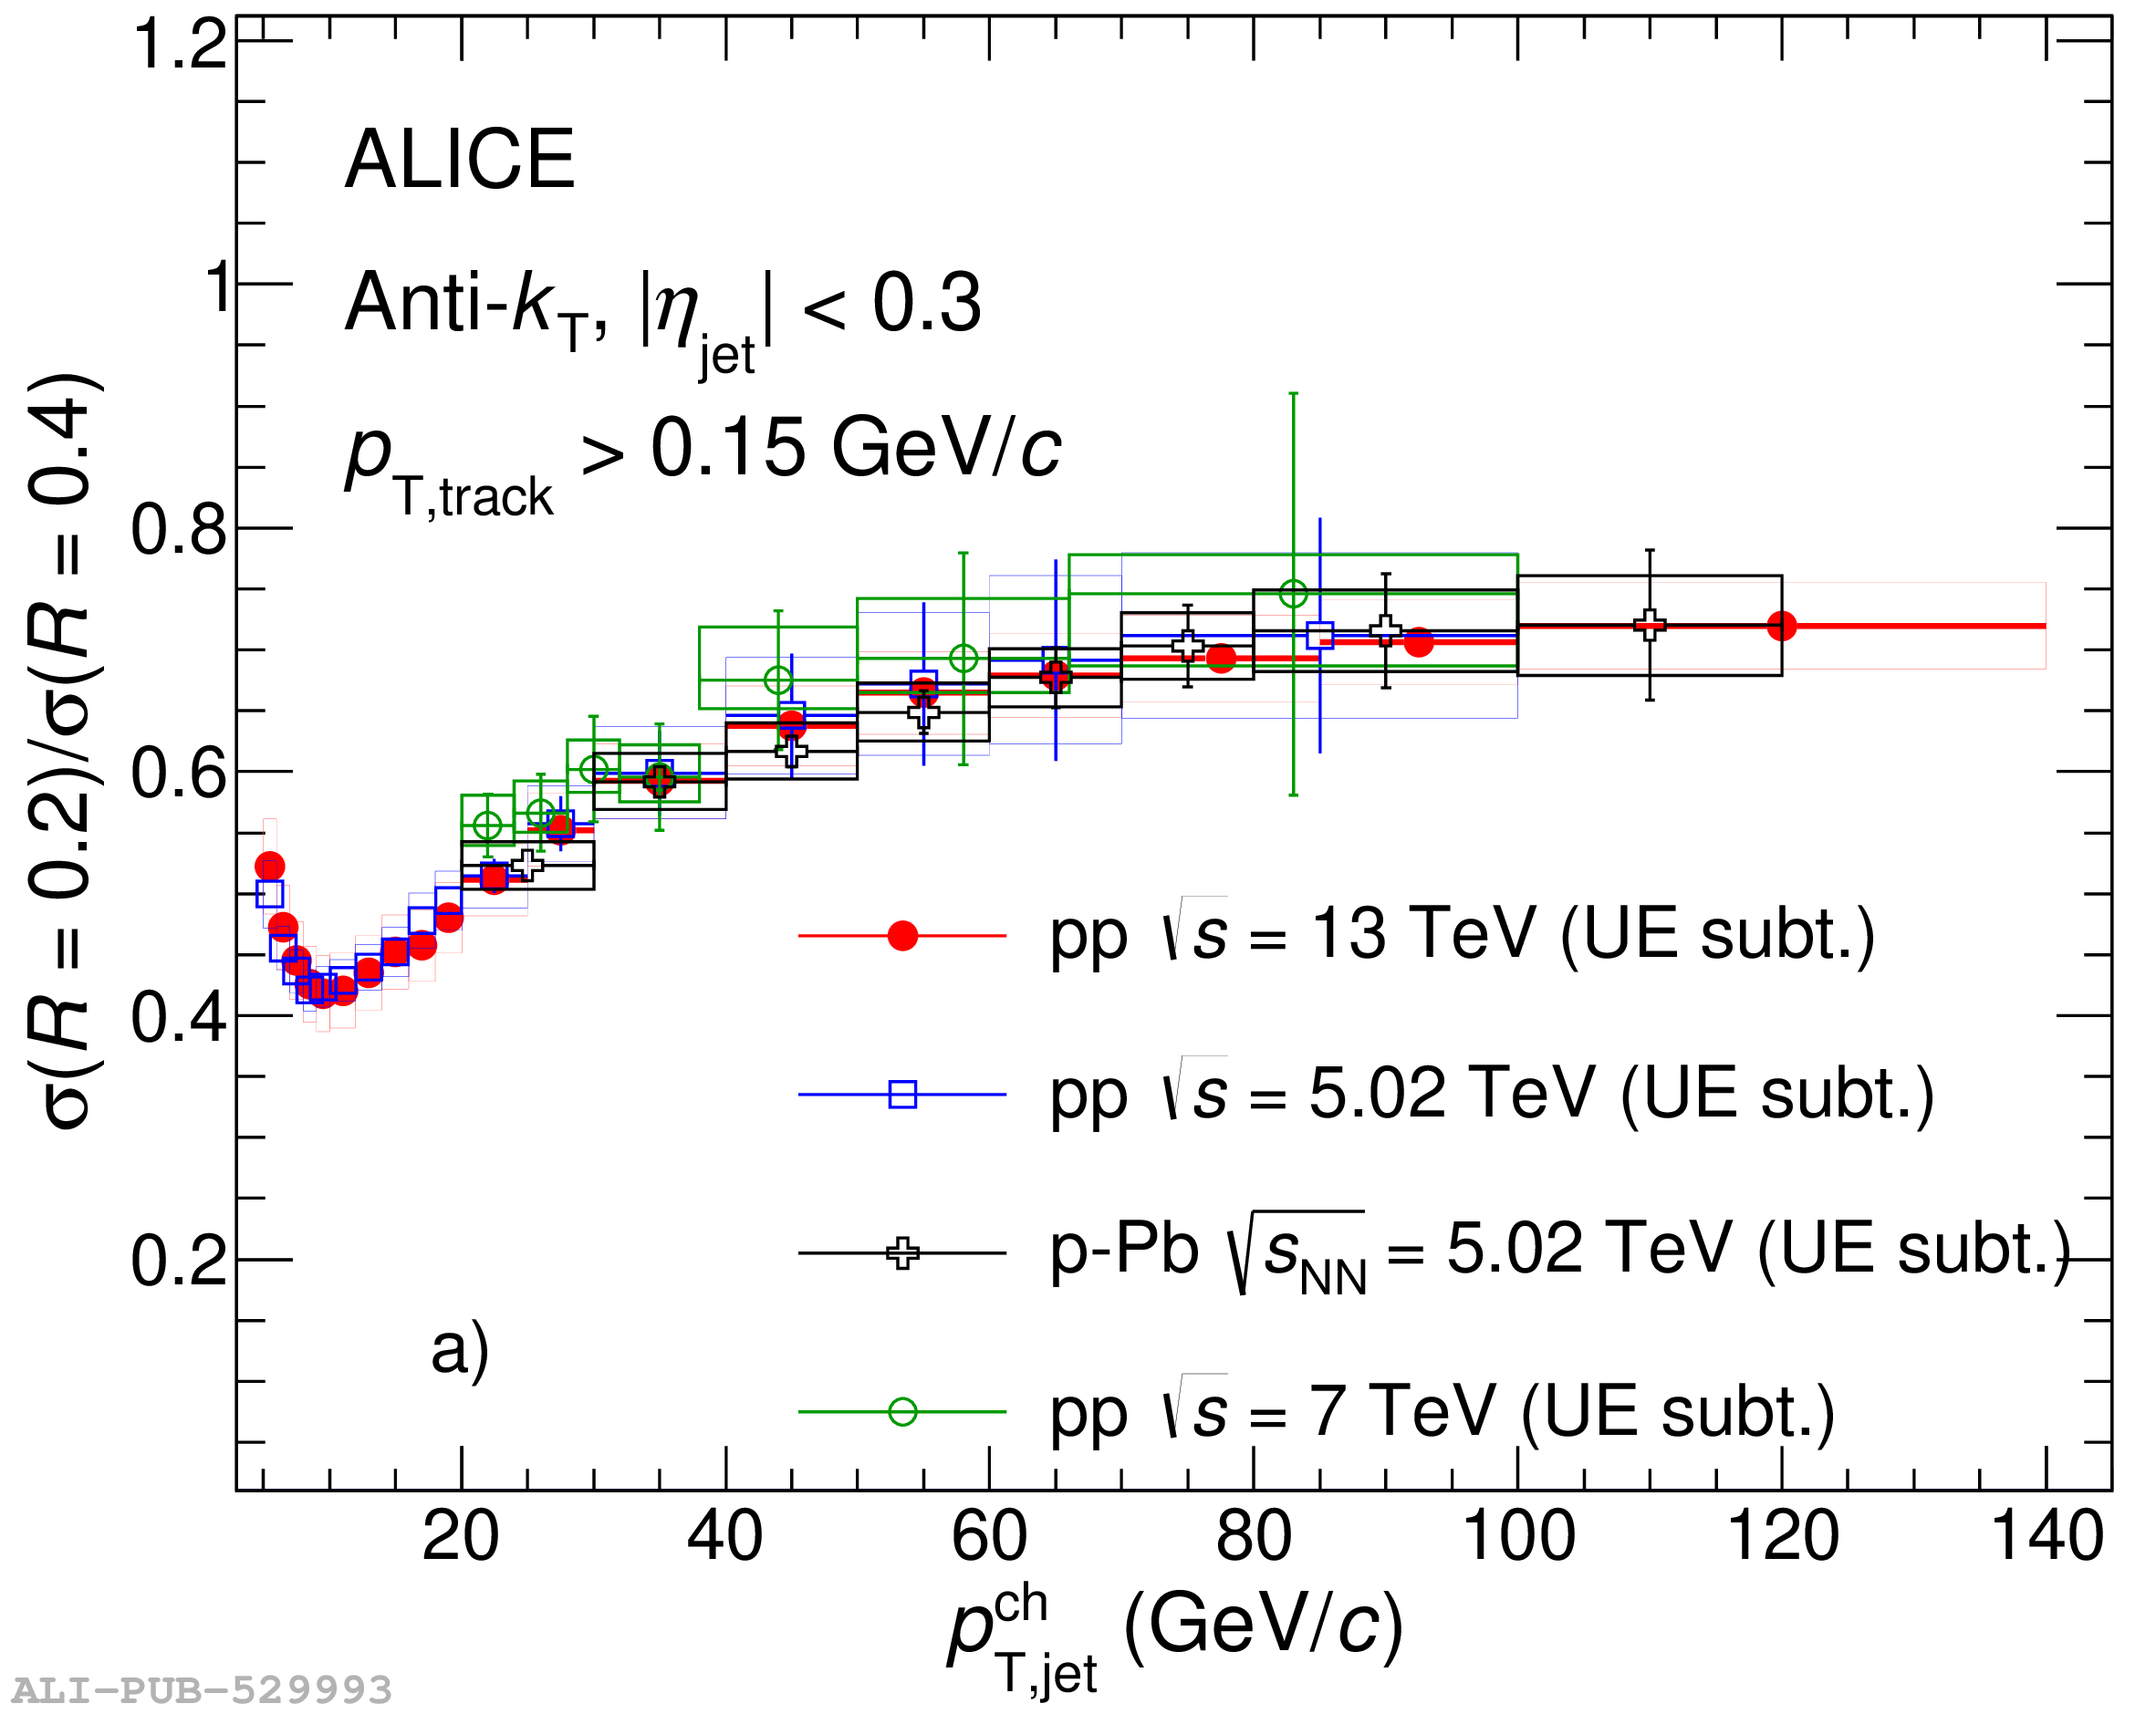
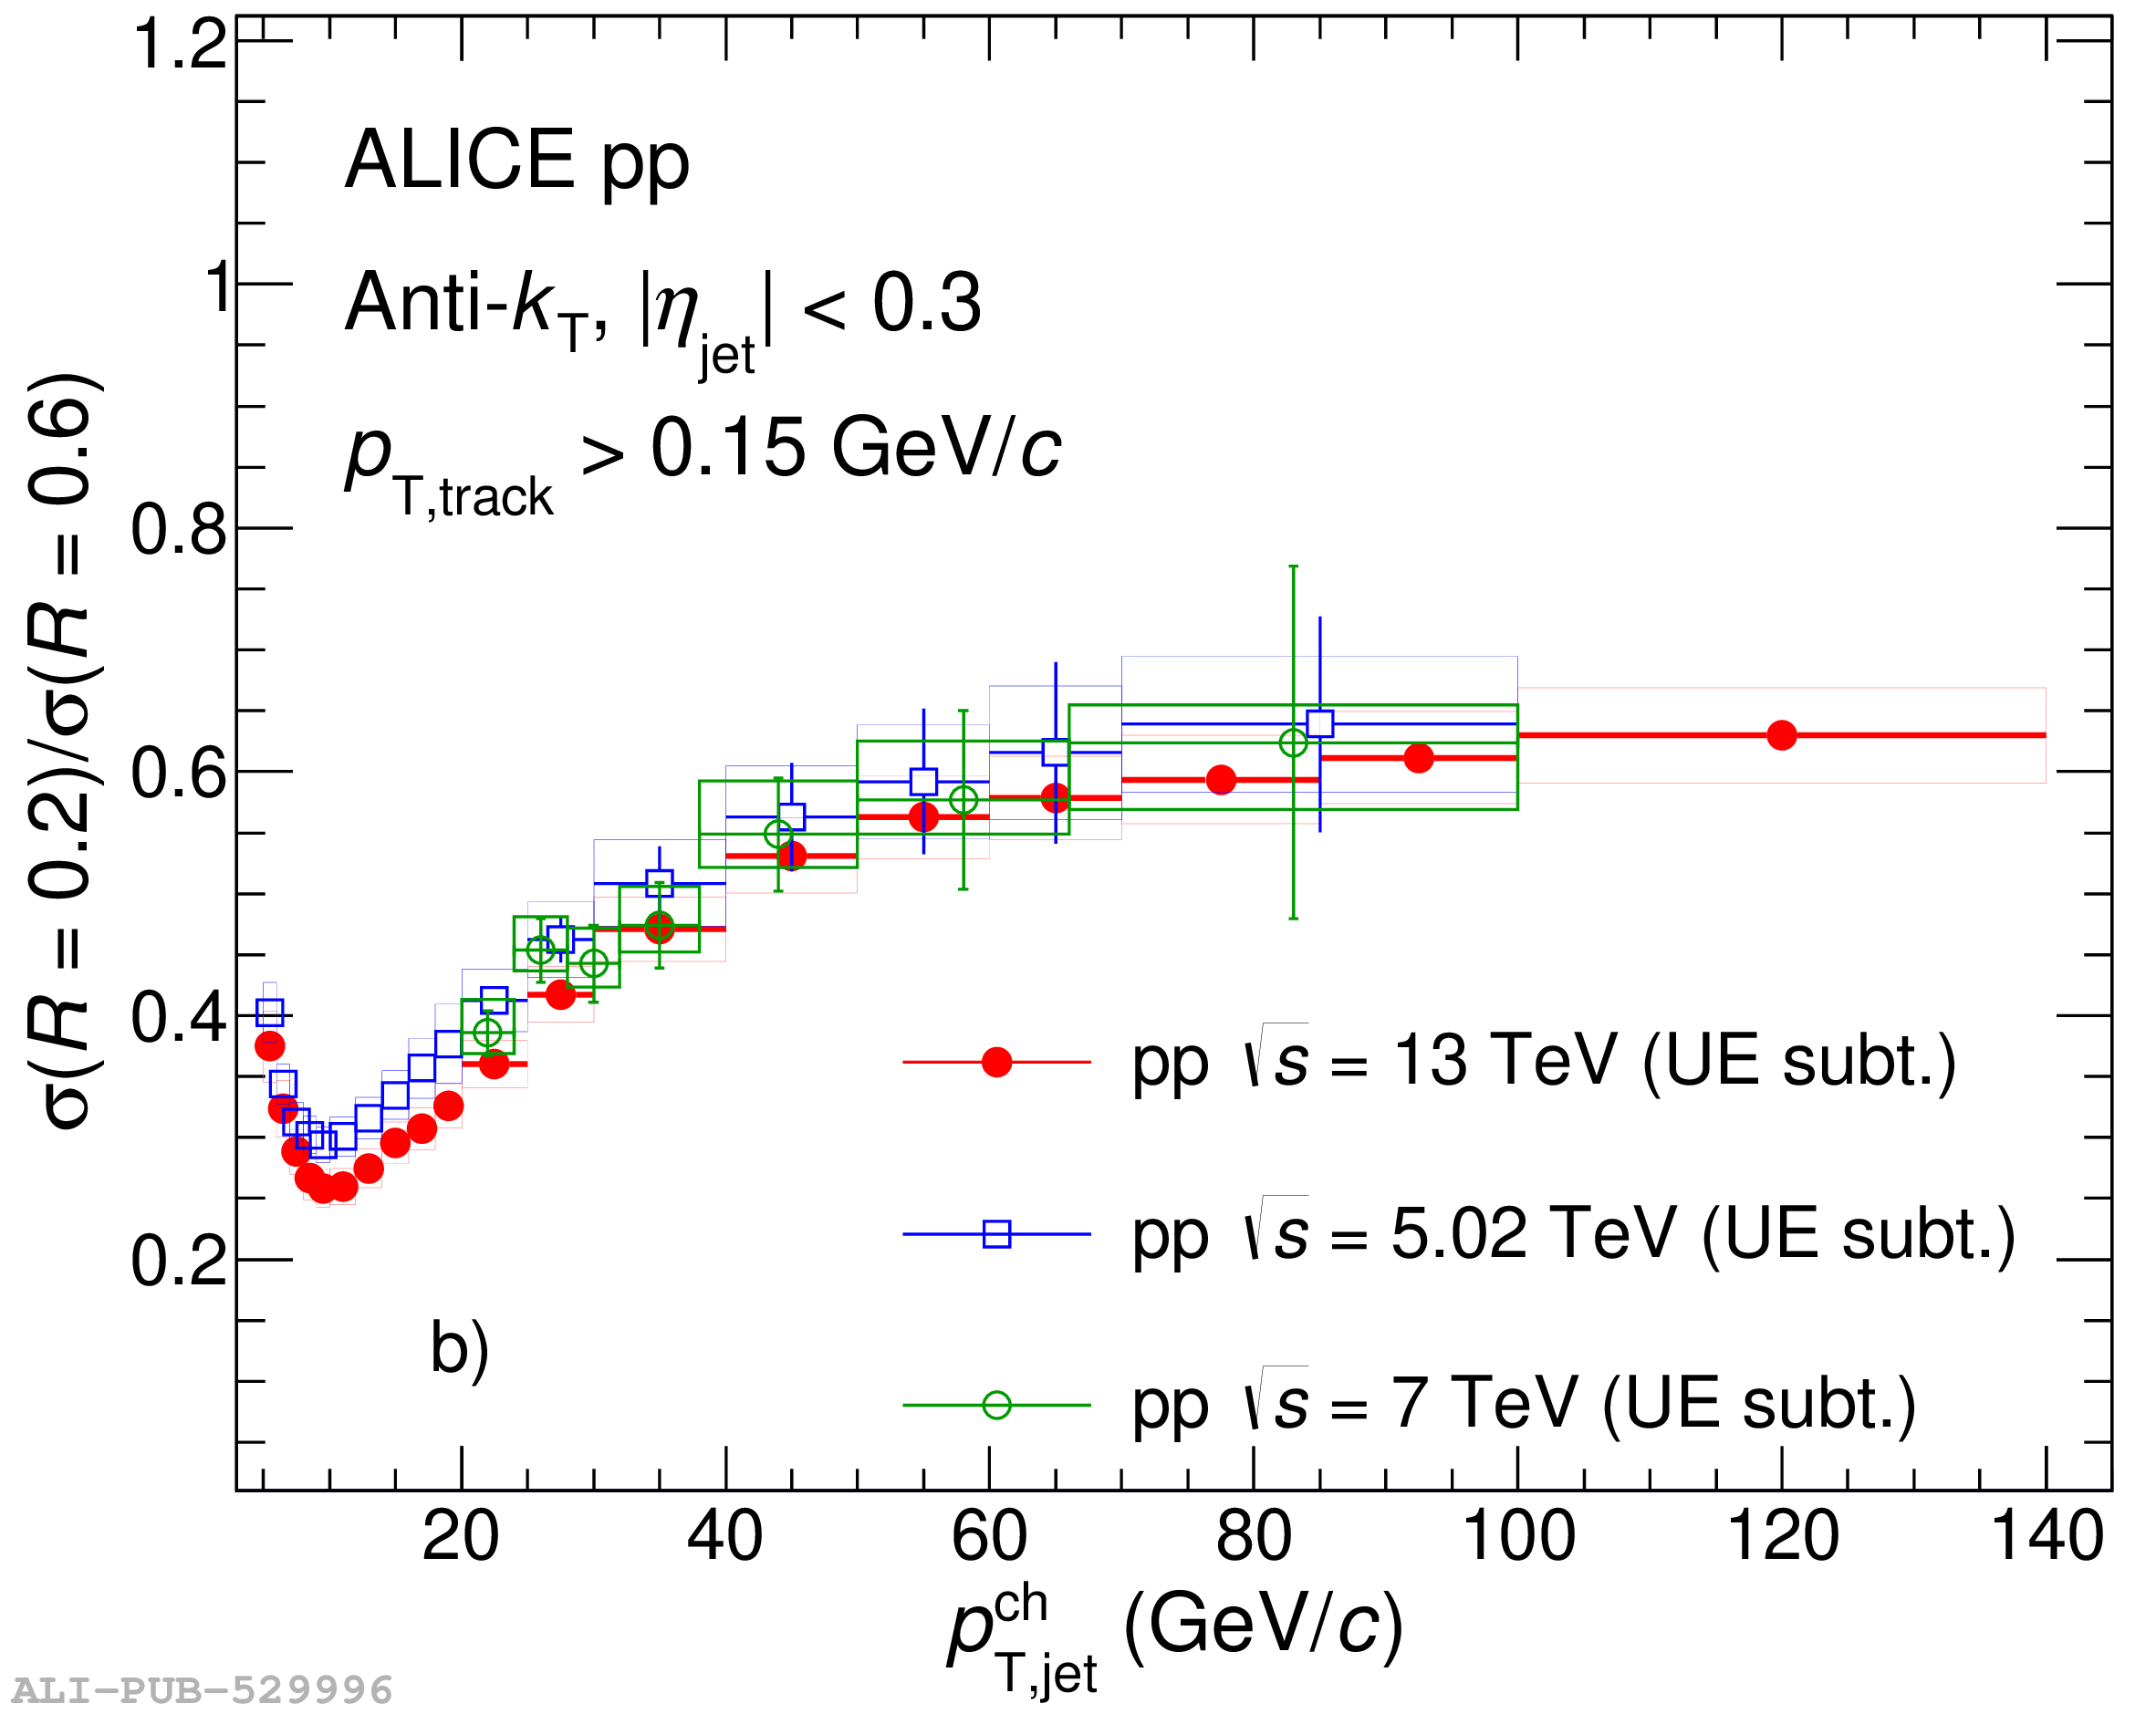
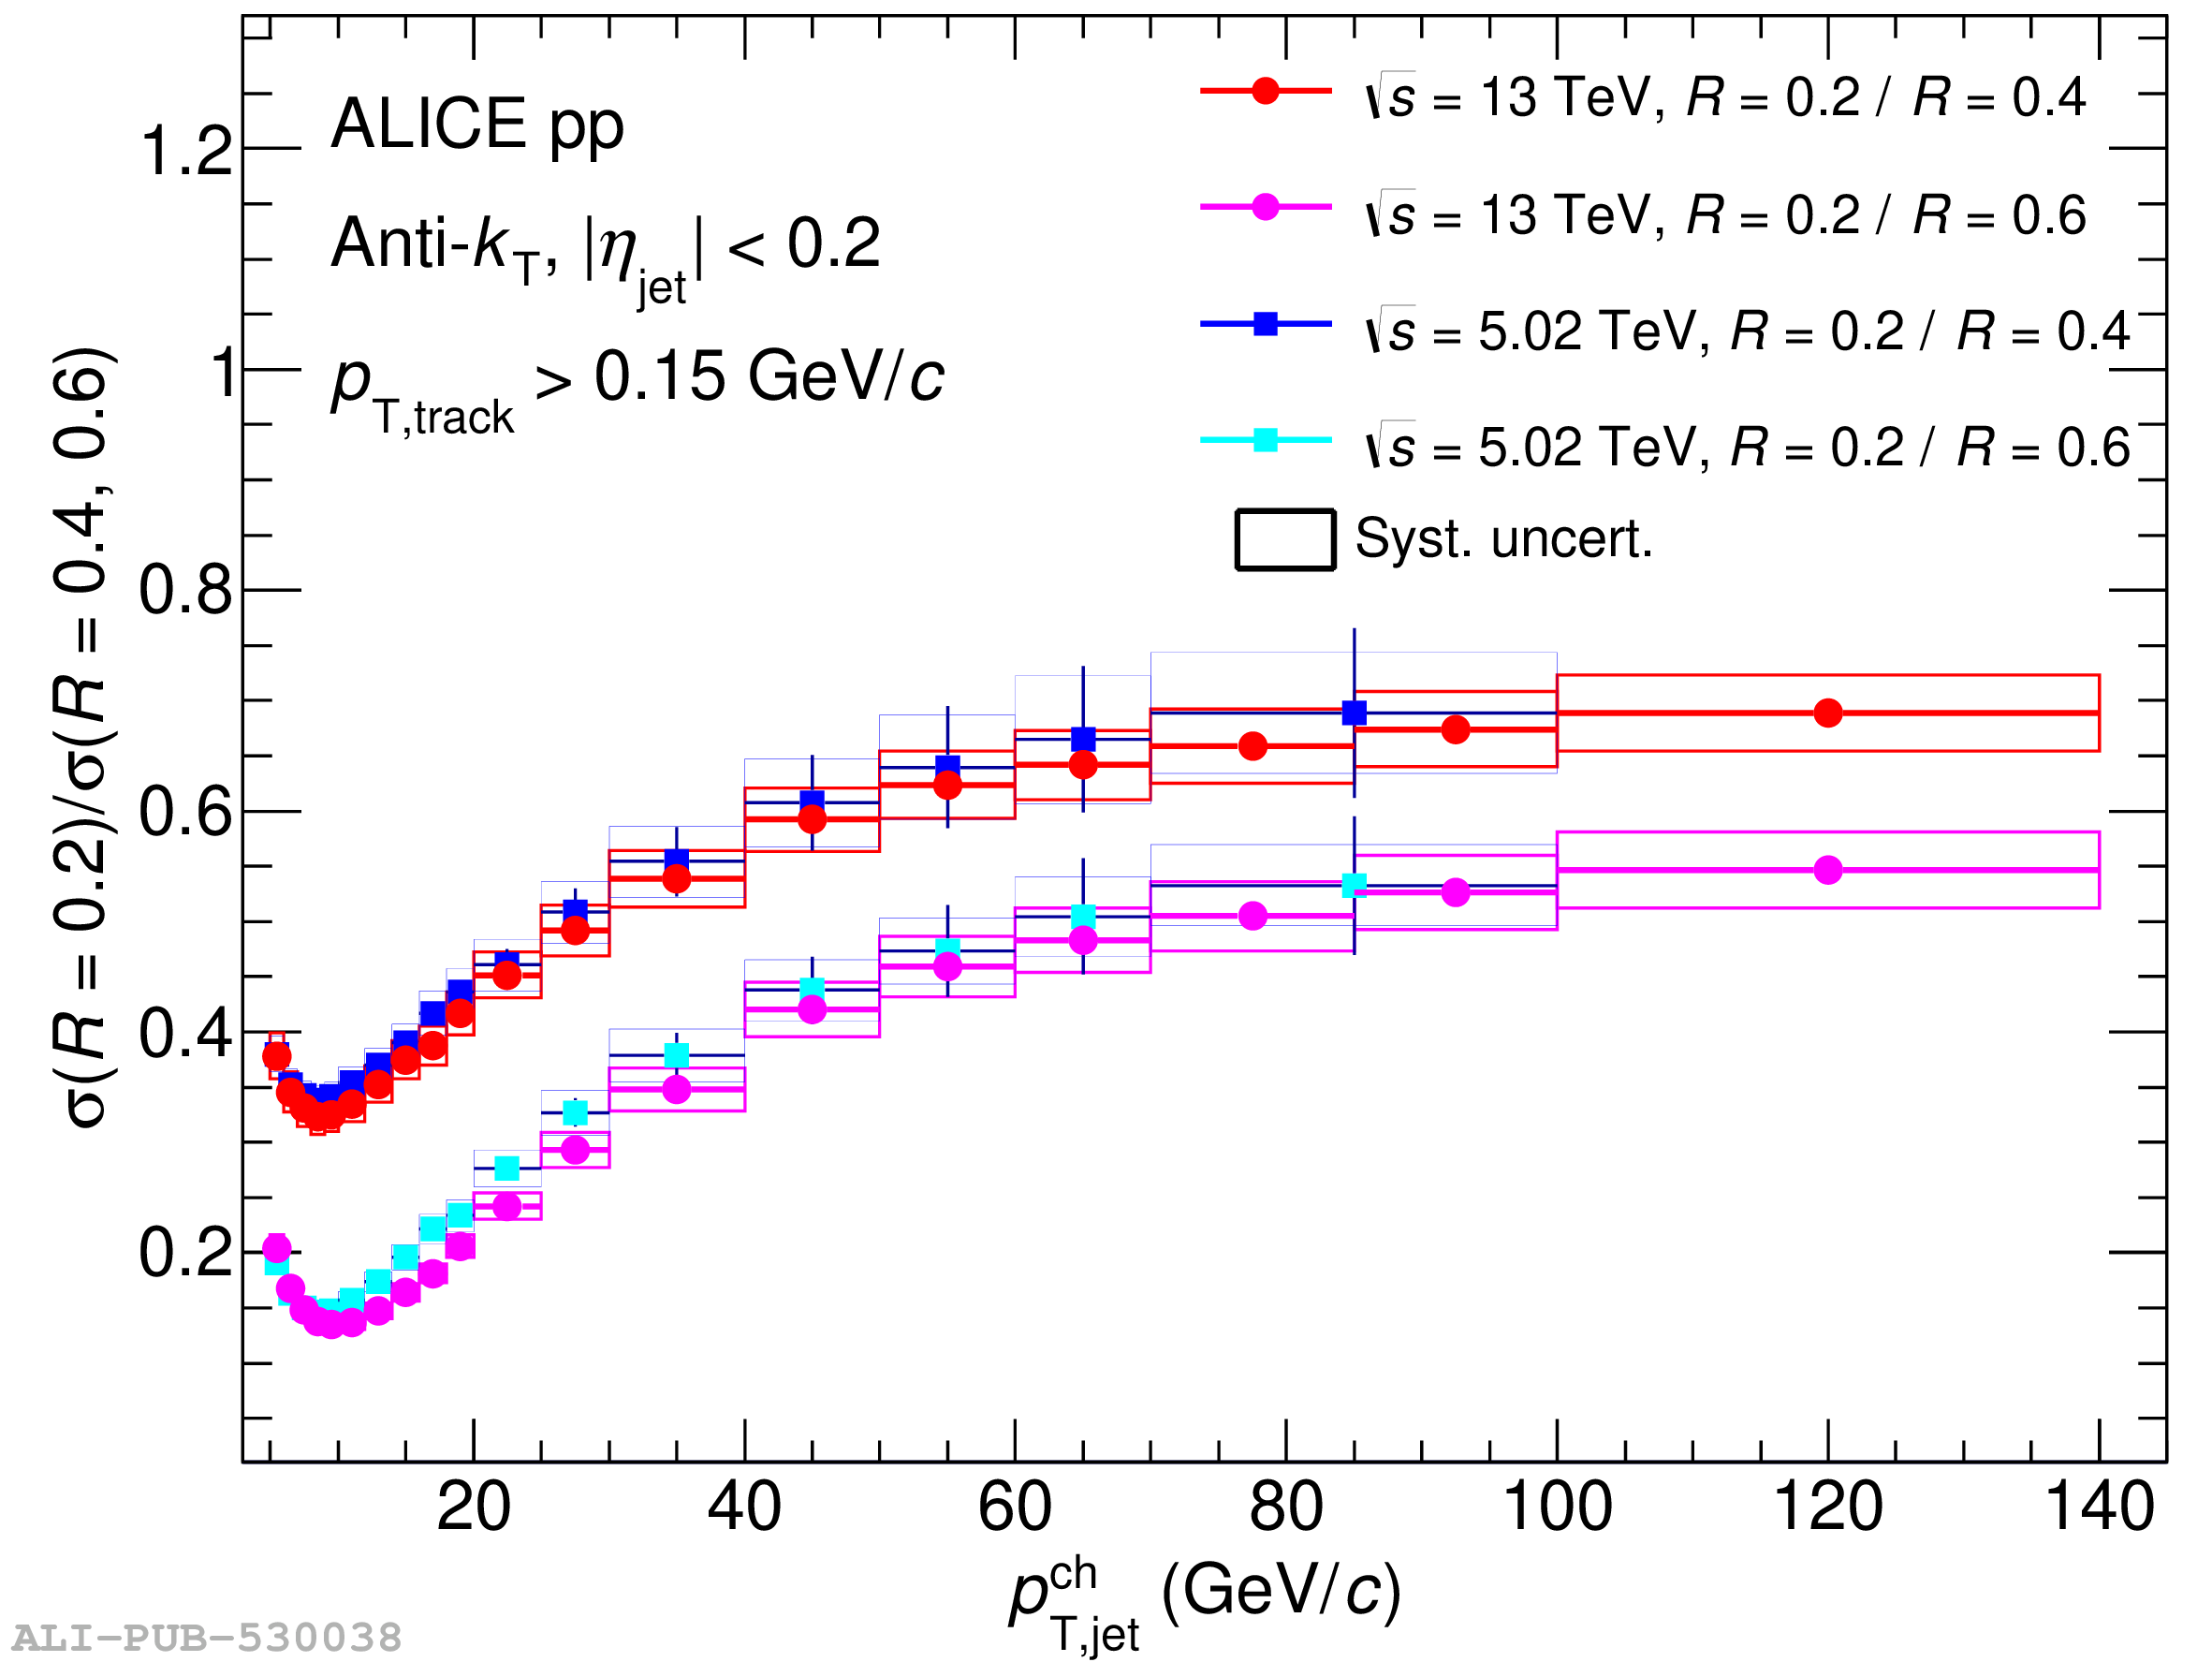
Comparison of charged-particle jet cross section ratio with UE subtraction in pp collisions at $\sqrt{s} = 5.02$ , $7$ , and $13$ $\mathrm{TeV}$ and in p--Pb collisions at $\sqrt{s_\mathrm{NN}} = 5.02 \ \mathrm{TeV}$ . Results are a) $\sigma(R=0.2)/\sigma(R=0.4)$ , and b) $\sigma(R=0.2)/\sigma(R=0.6)$.

Figure 7

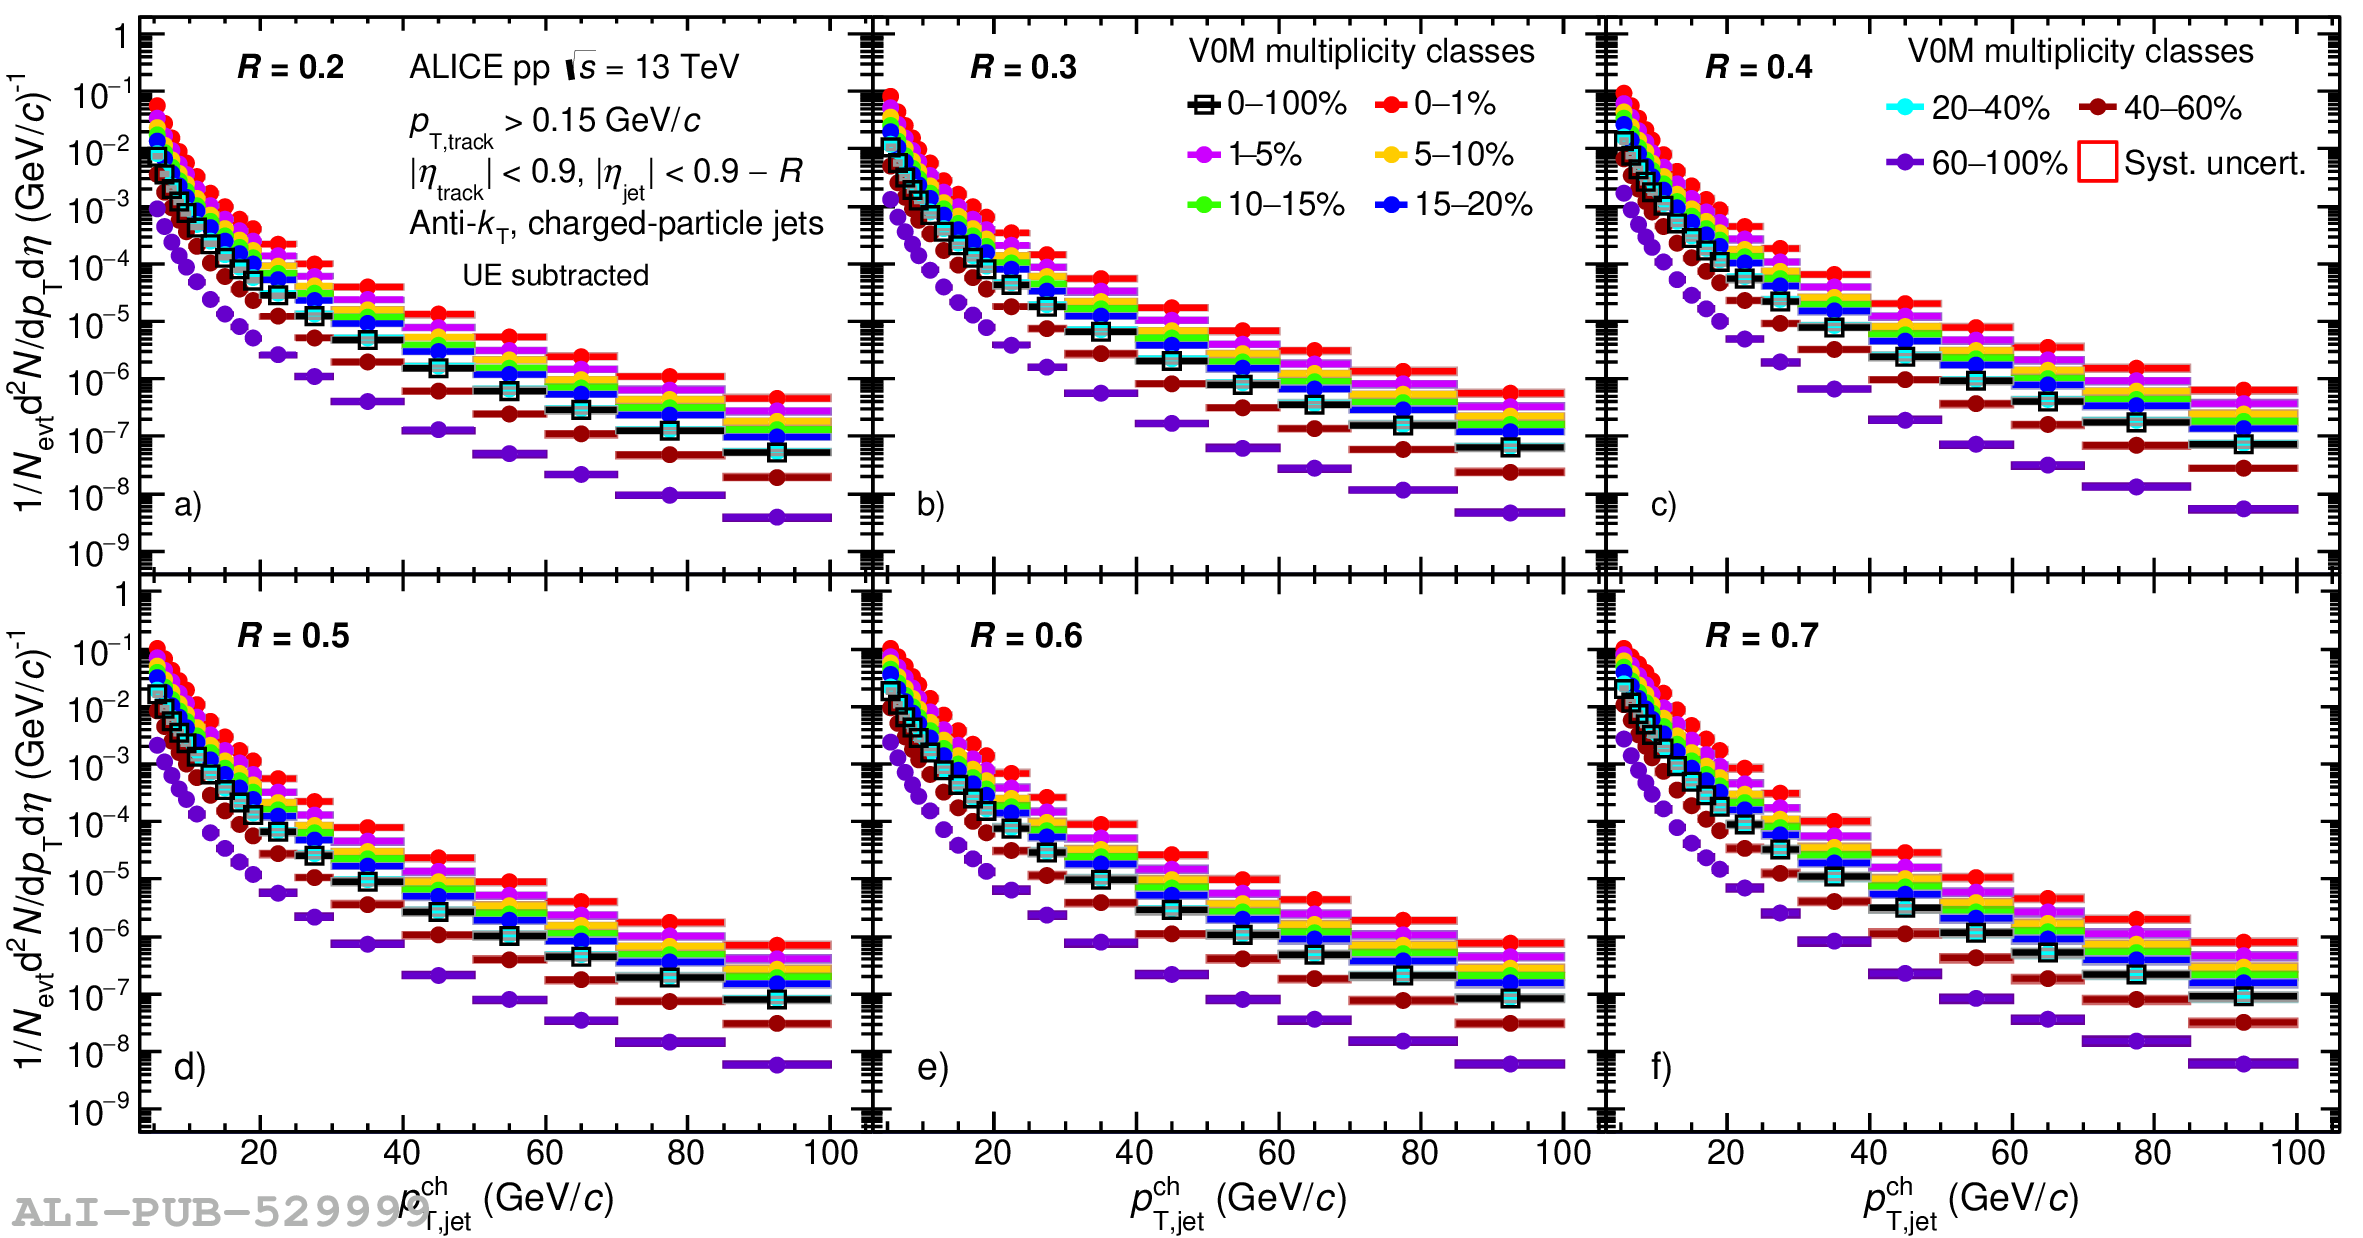
Charged-particle jet yields in different V0M multiplicity percentile intervals for resolution parameters $R$ varied from $0.2$ to $0.7$ in pp collisions at $\sqrt{s} = 13\ \mathrm{TeV}$. Statistical and total systematic uncertainties are shown as vertical error bars and boxes around the data points, respectively.

Figure 8

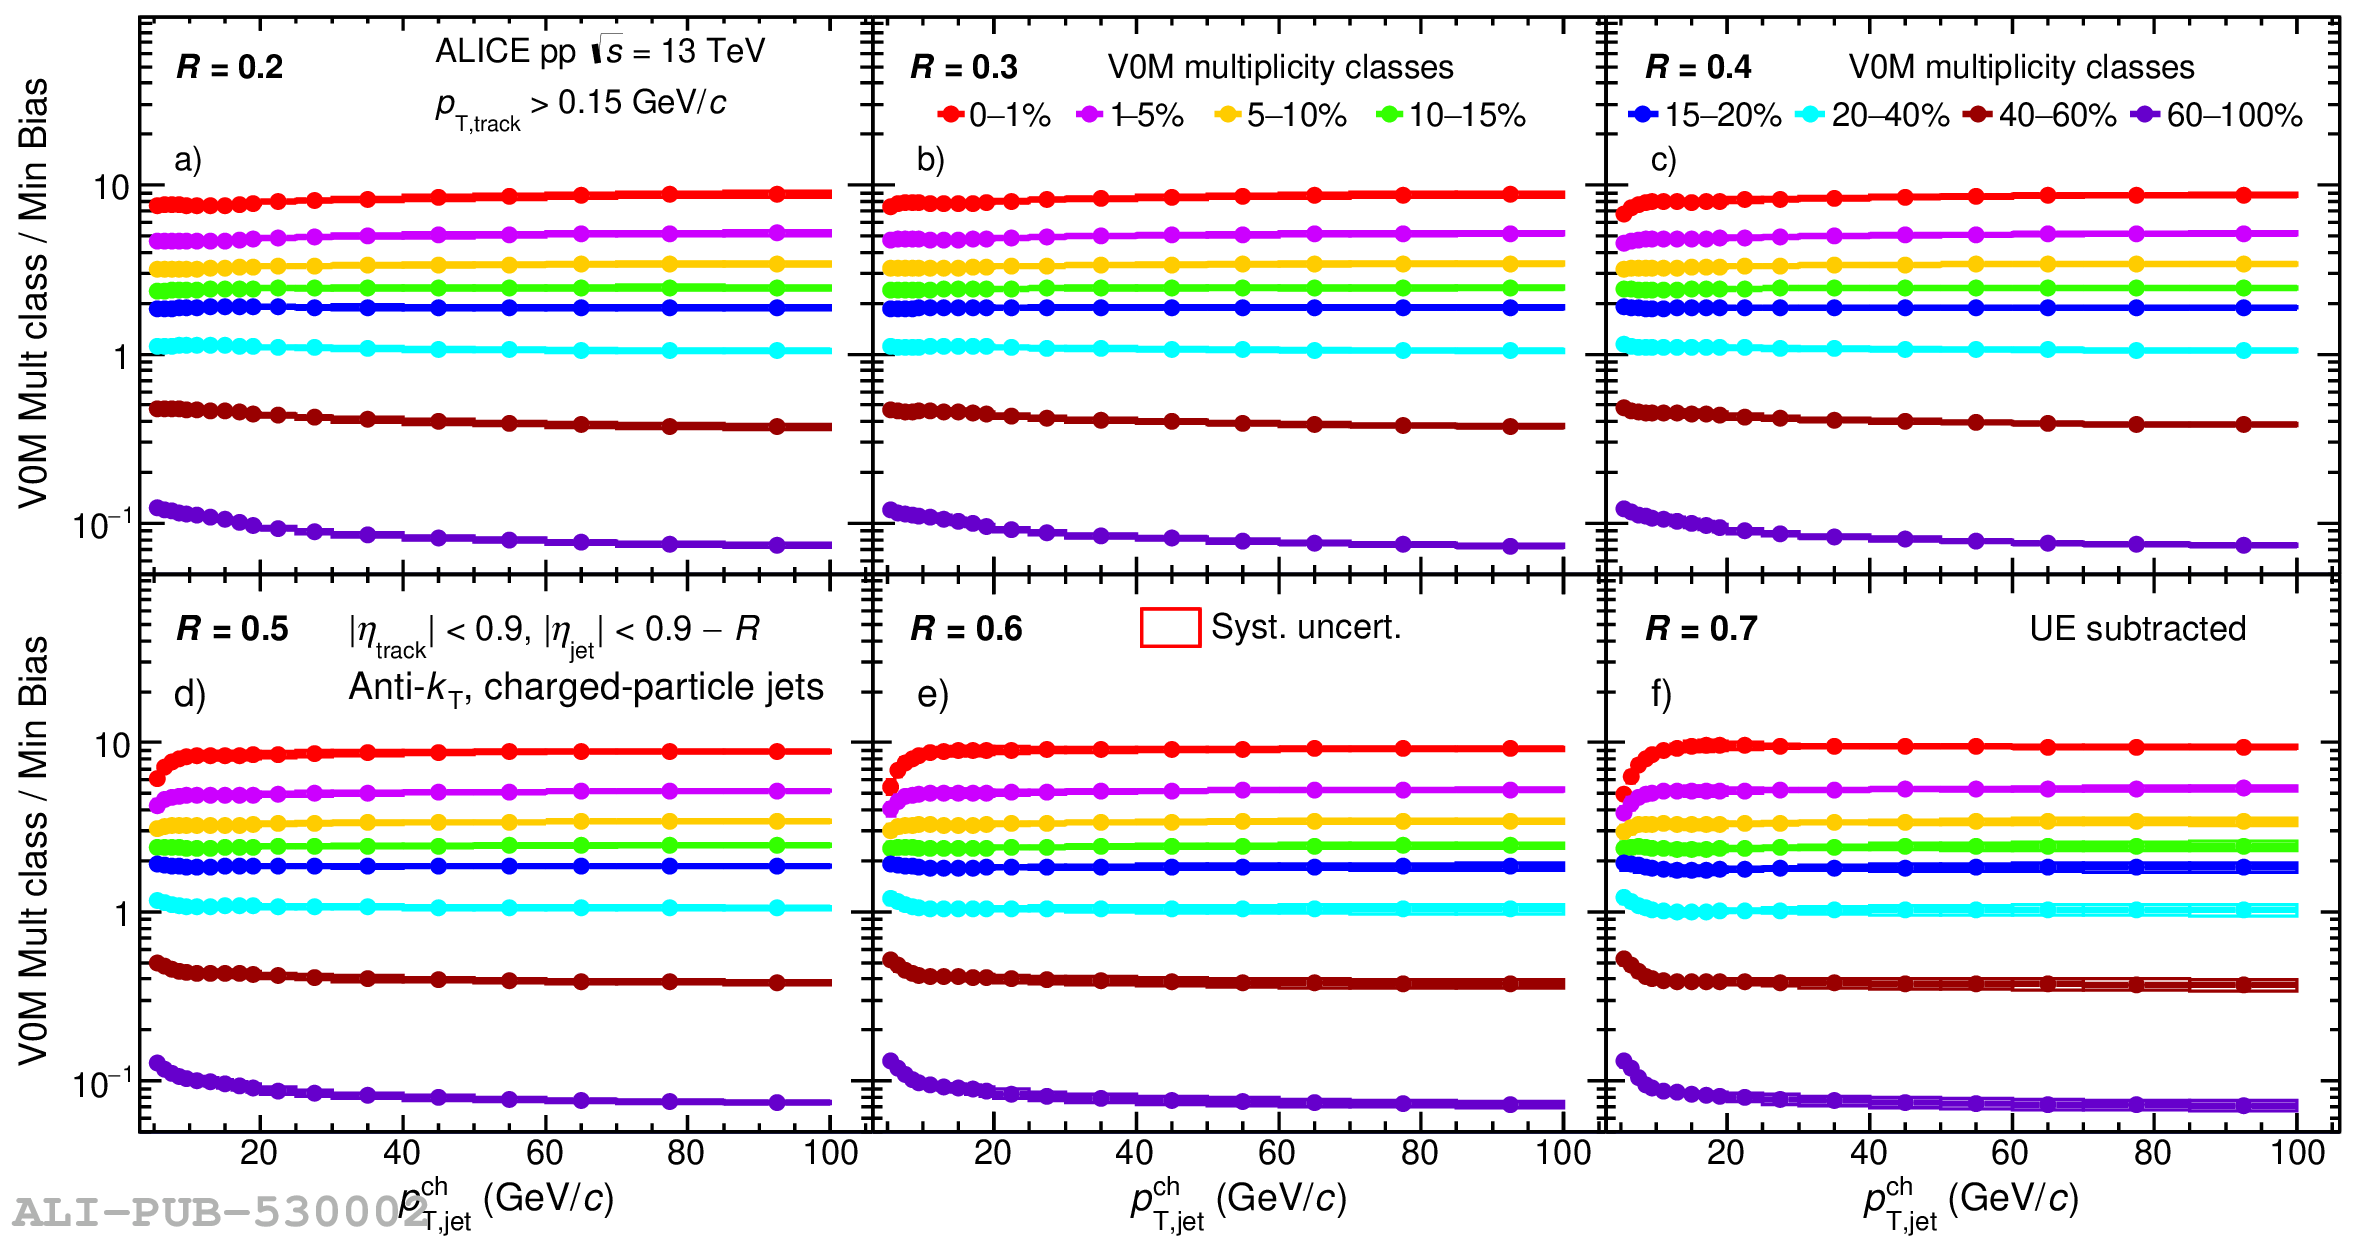
Ratio of charged-particle jet yield measured in different multiplicity classes with respect to that in MB events as a function of $p_{\rm T}$ for different resolution parameters $R$ from $0.2$ to $0.7$. Statistical and total systematic uncertainties are shown as vertical error bars and boxes around the data points, respectively.

Figure 9

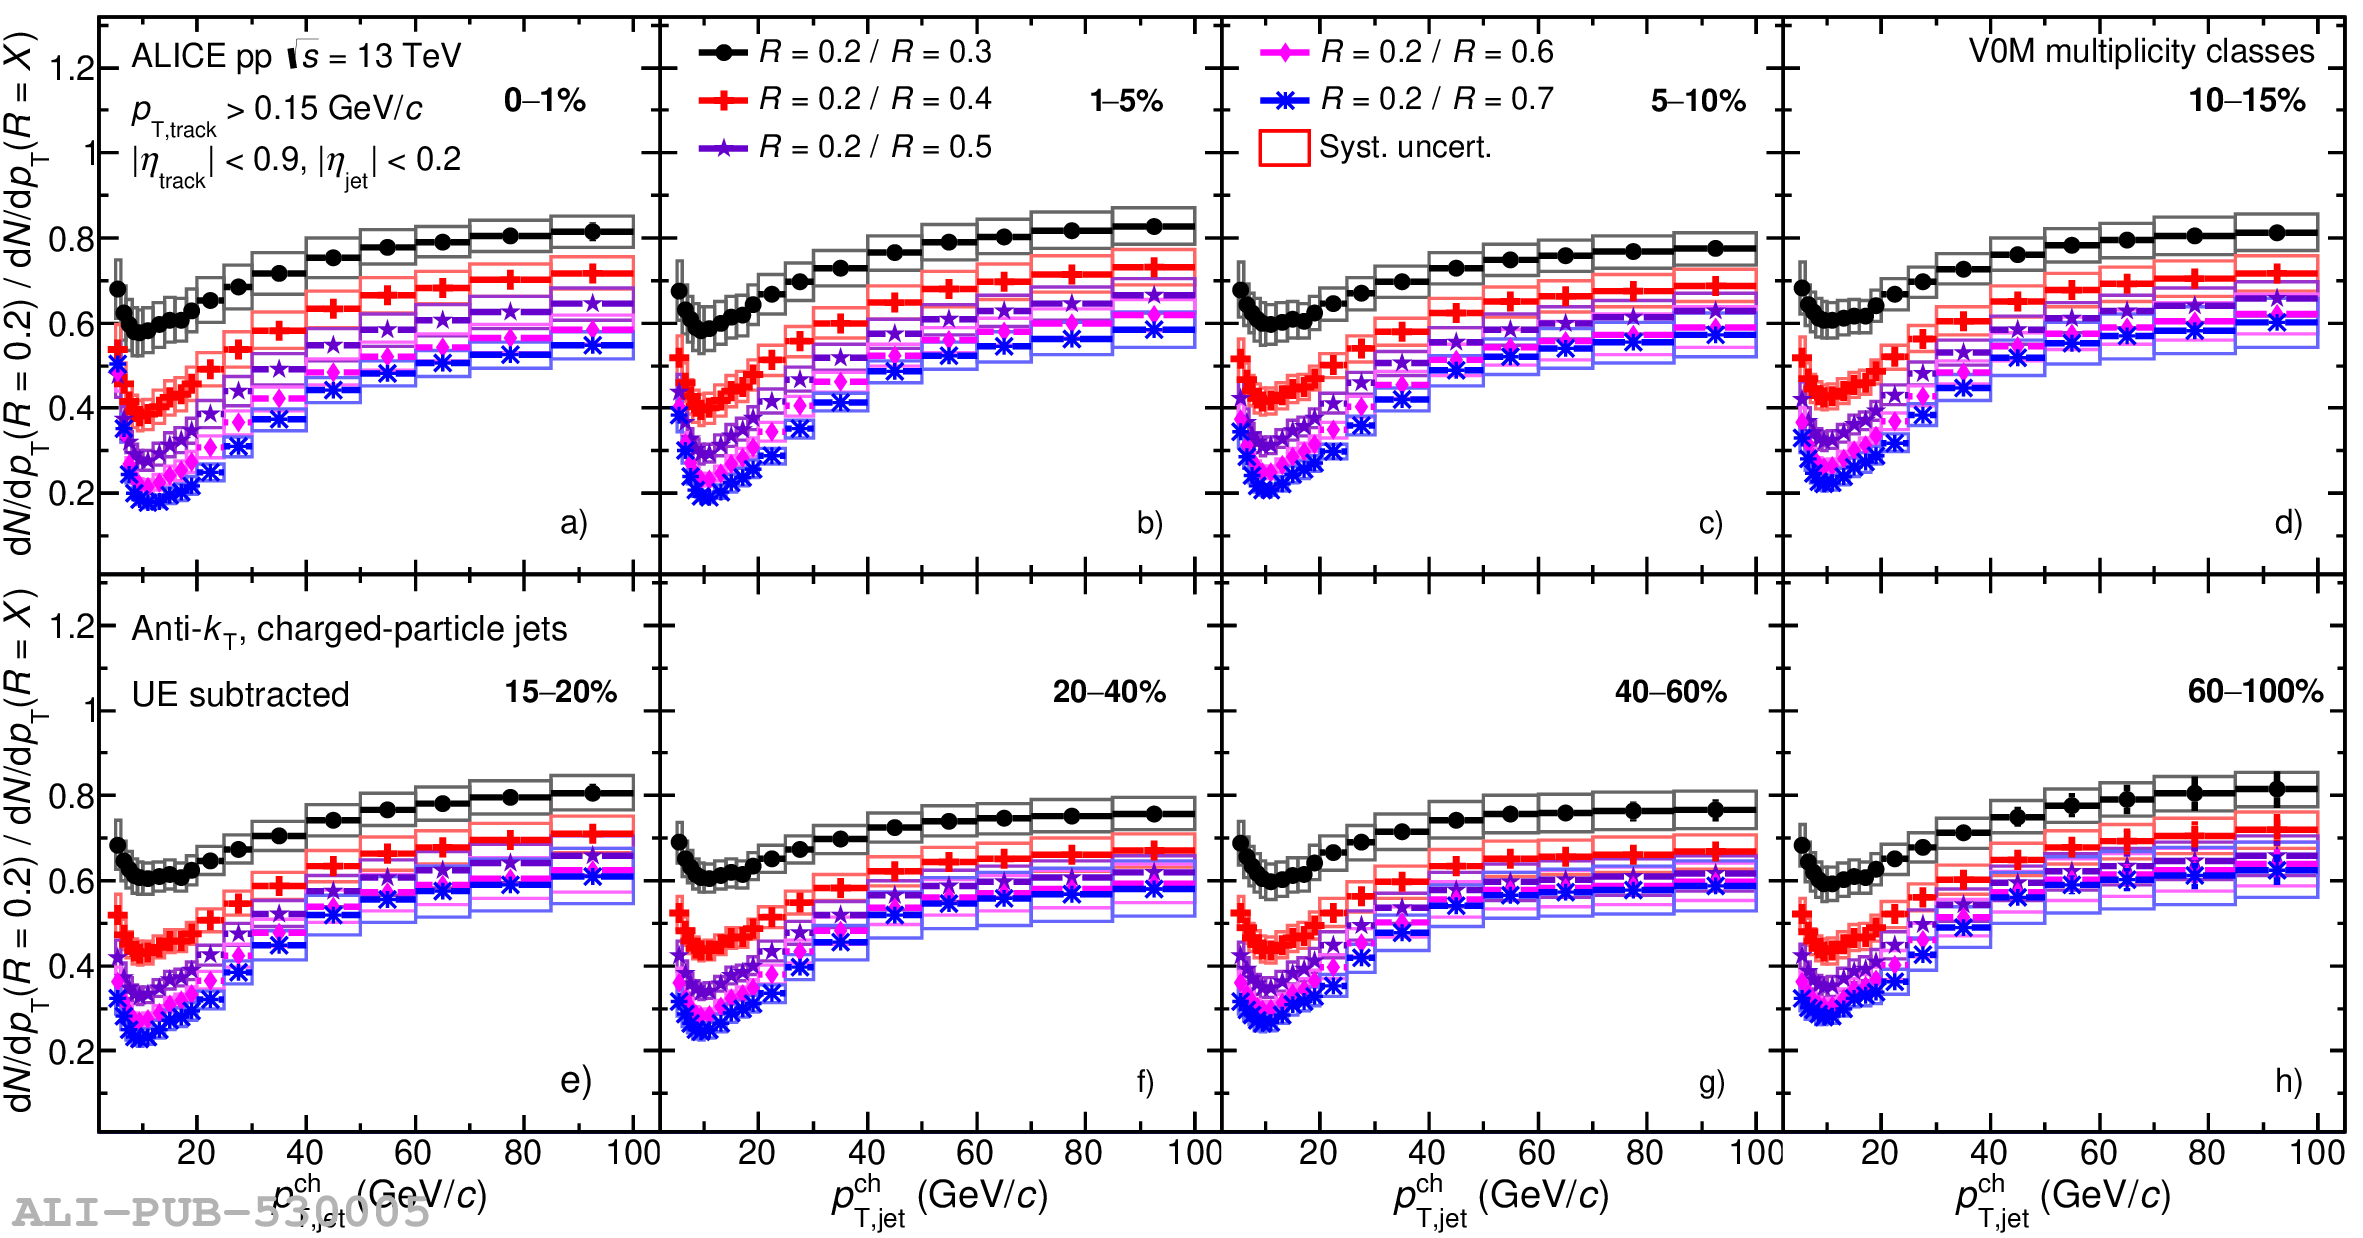
Ratios of charged-particle jet spectra with $R = 0.2$ to that with other jet resolution parameters $R$ from $0.3$ to $0.7$, shown in different V0M multiplicity classes. Statistical and systematic uncertainties are shown as vertical error bars and boxes around the data points, respectively.

Figure 10

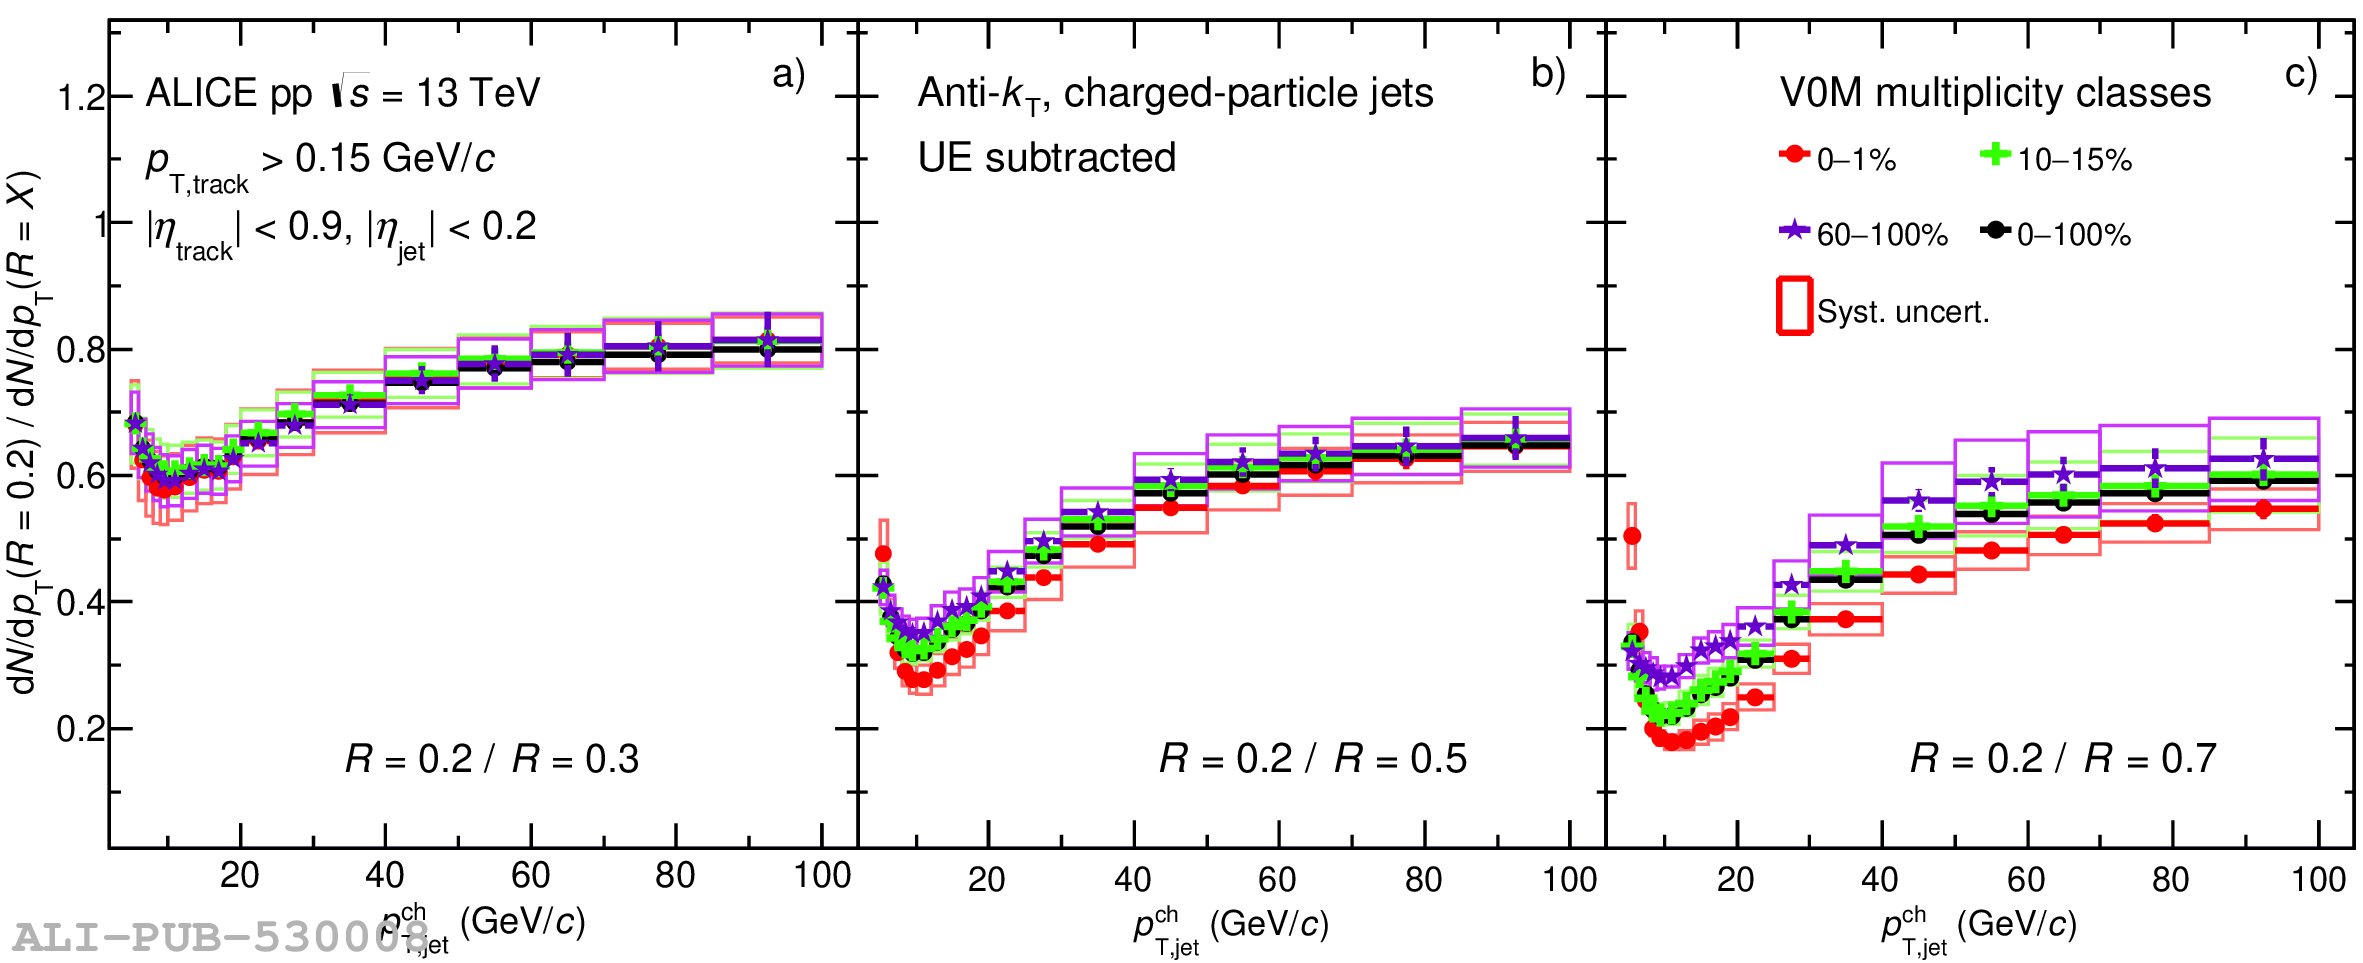
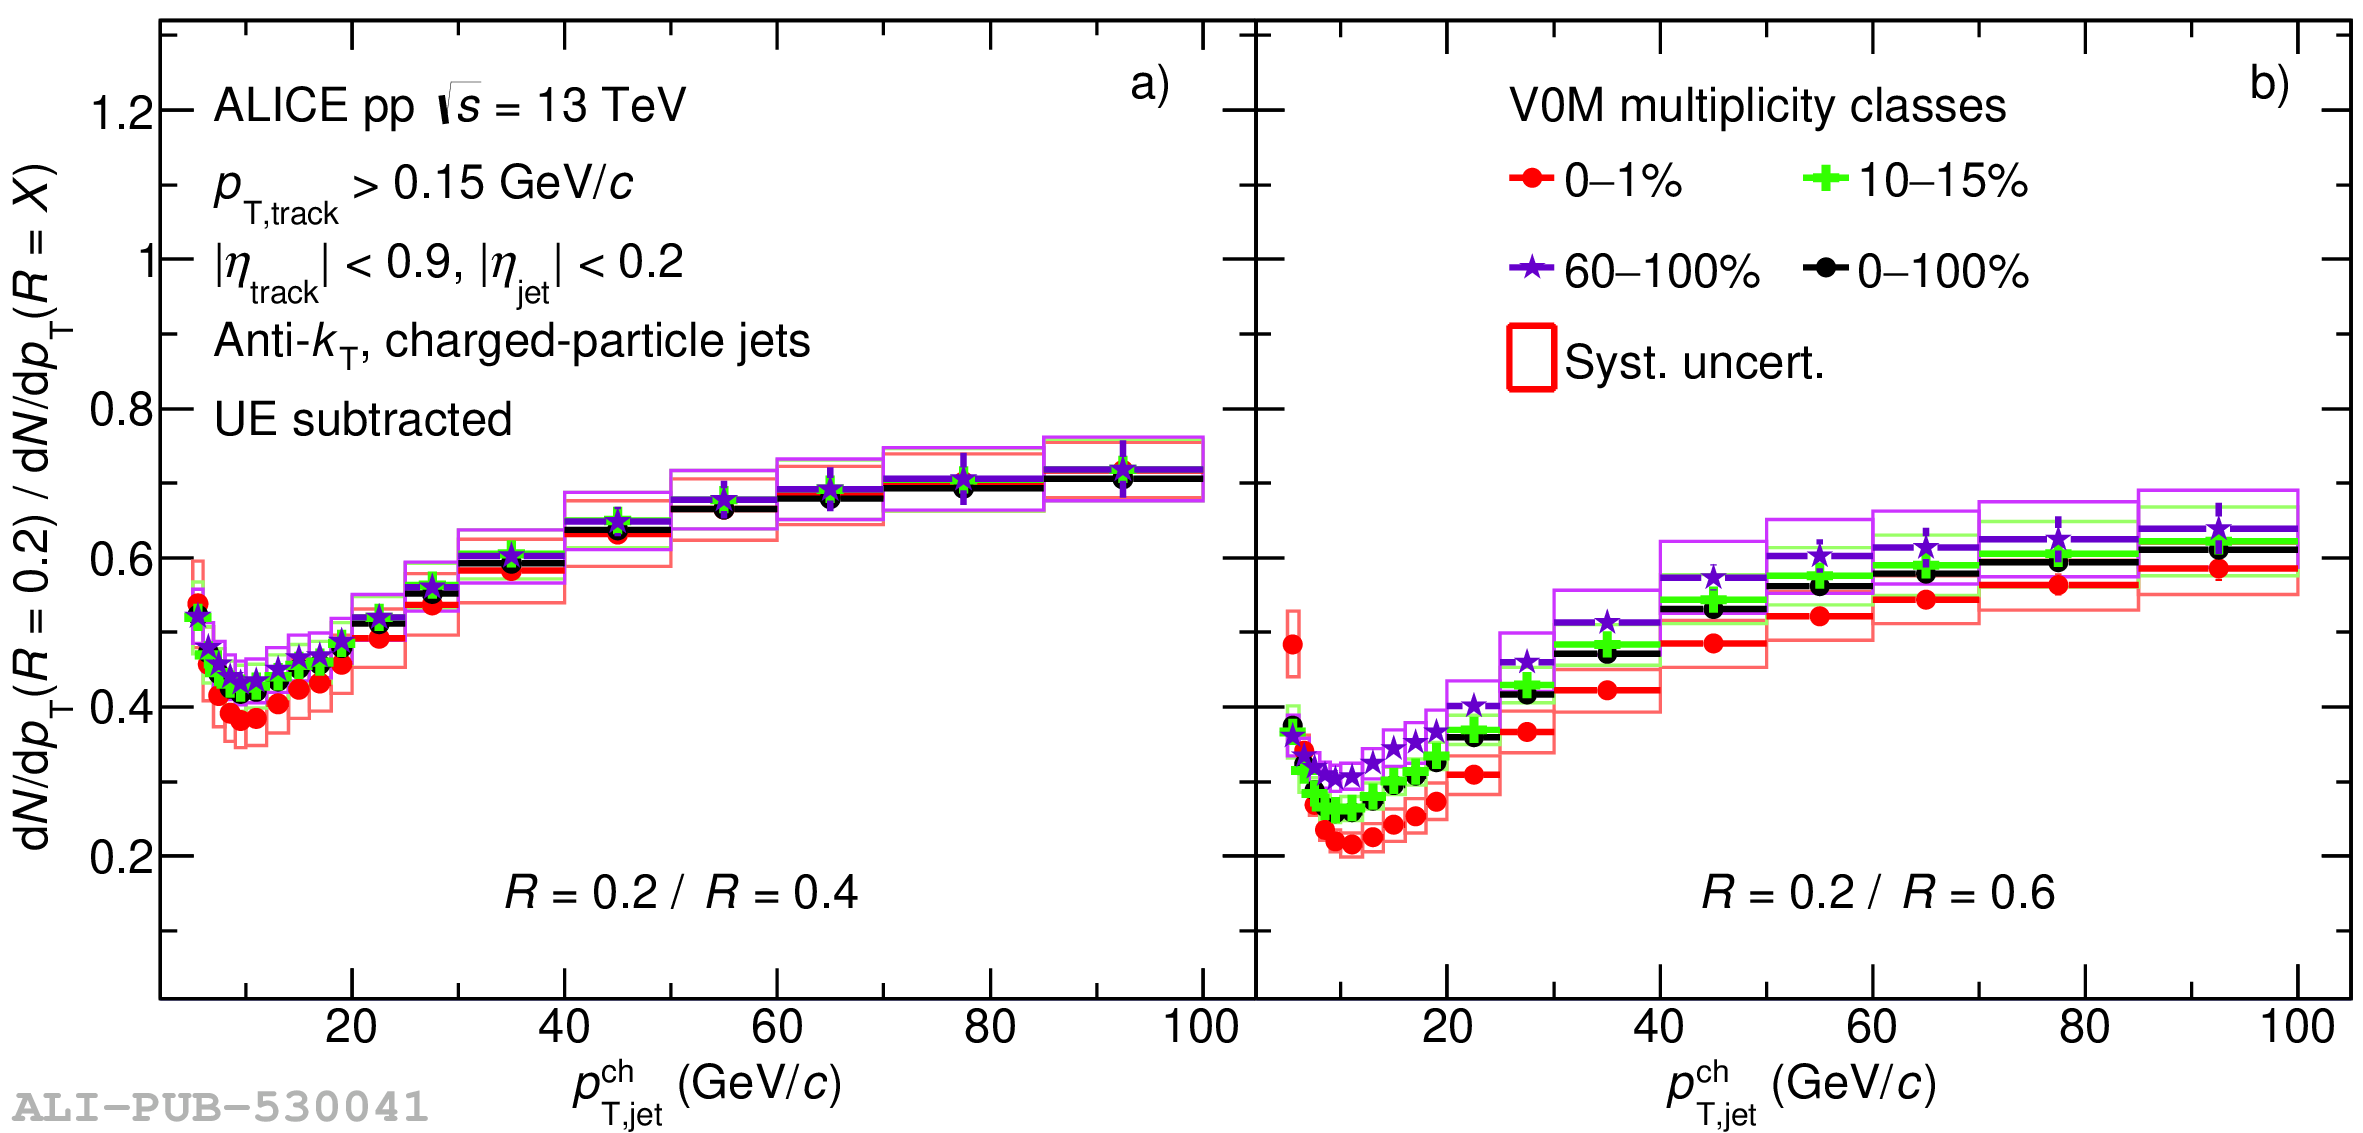
Comparison of jet spectra ratios of $R = 0.2$ to other radii $R = $ a) $0.3$, b) $0.5$, c) $0.7$ in MB events and in three multiplicity intervals (0--1\%, 10--15\% and 60--100\%). Statistical and systematic uncertainties are shown as vertical error bars and boxes around the data points, respectively. Results for other radii can be found in Appendix Fig. \ref{fig:MultJetCSRatioCompData02046}.

Figure 11

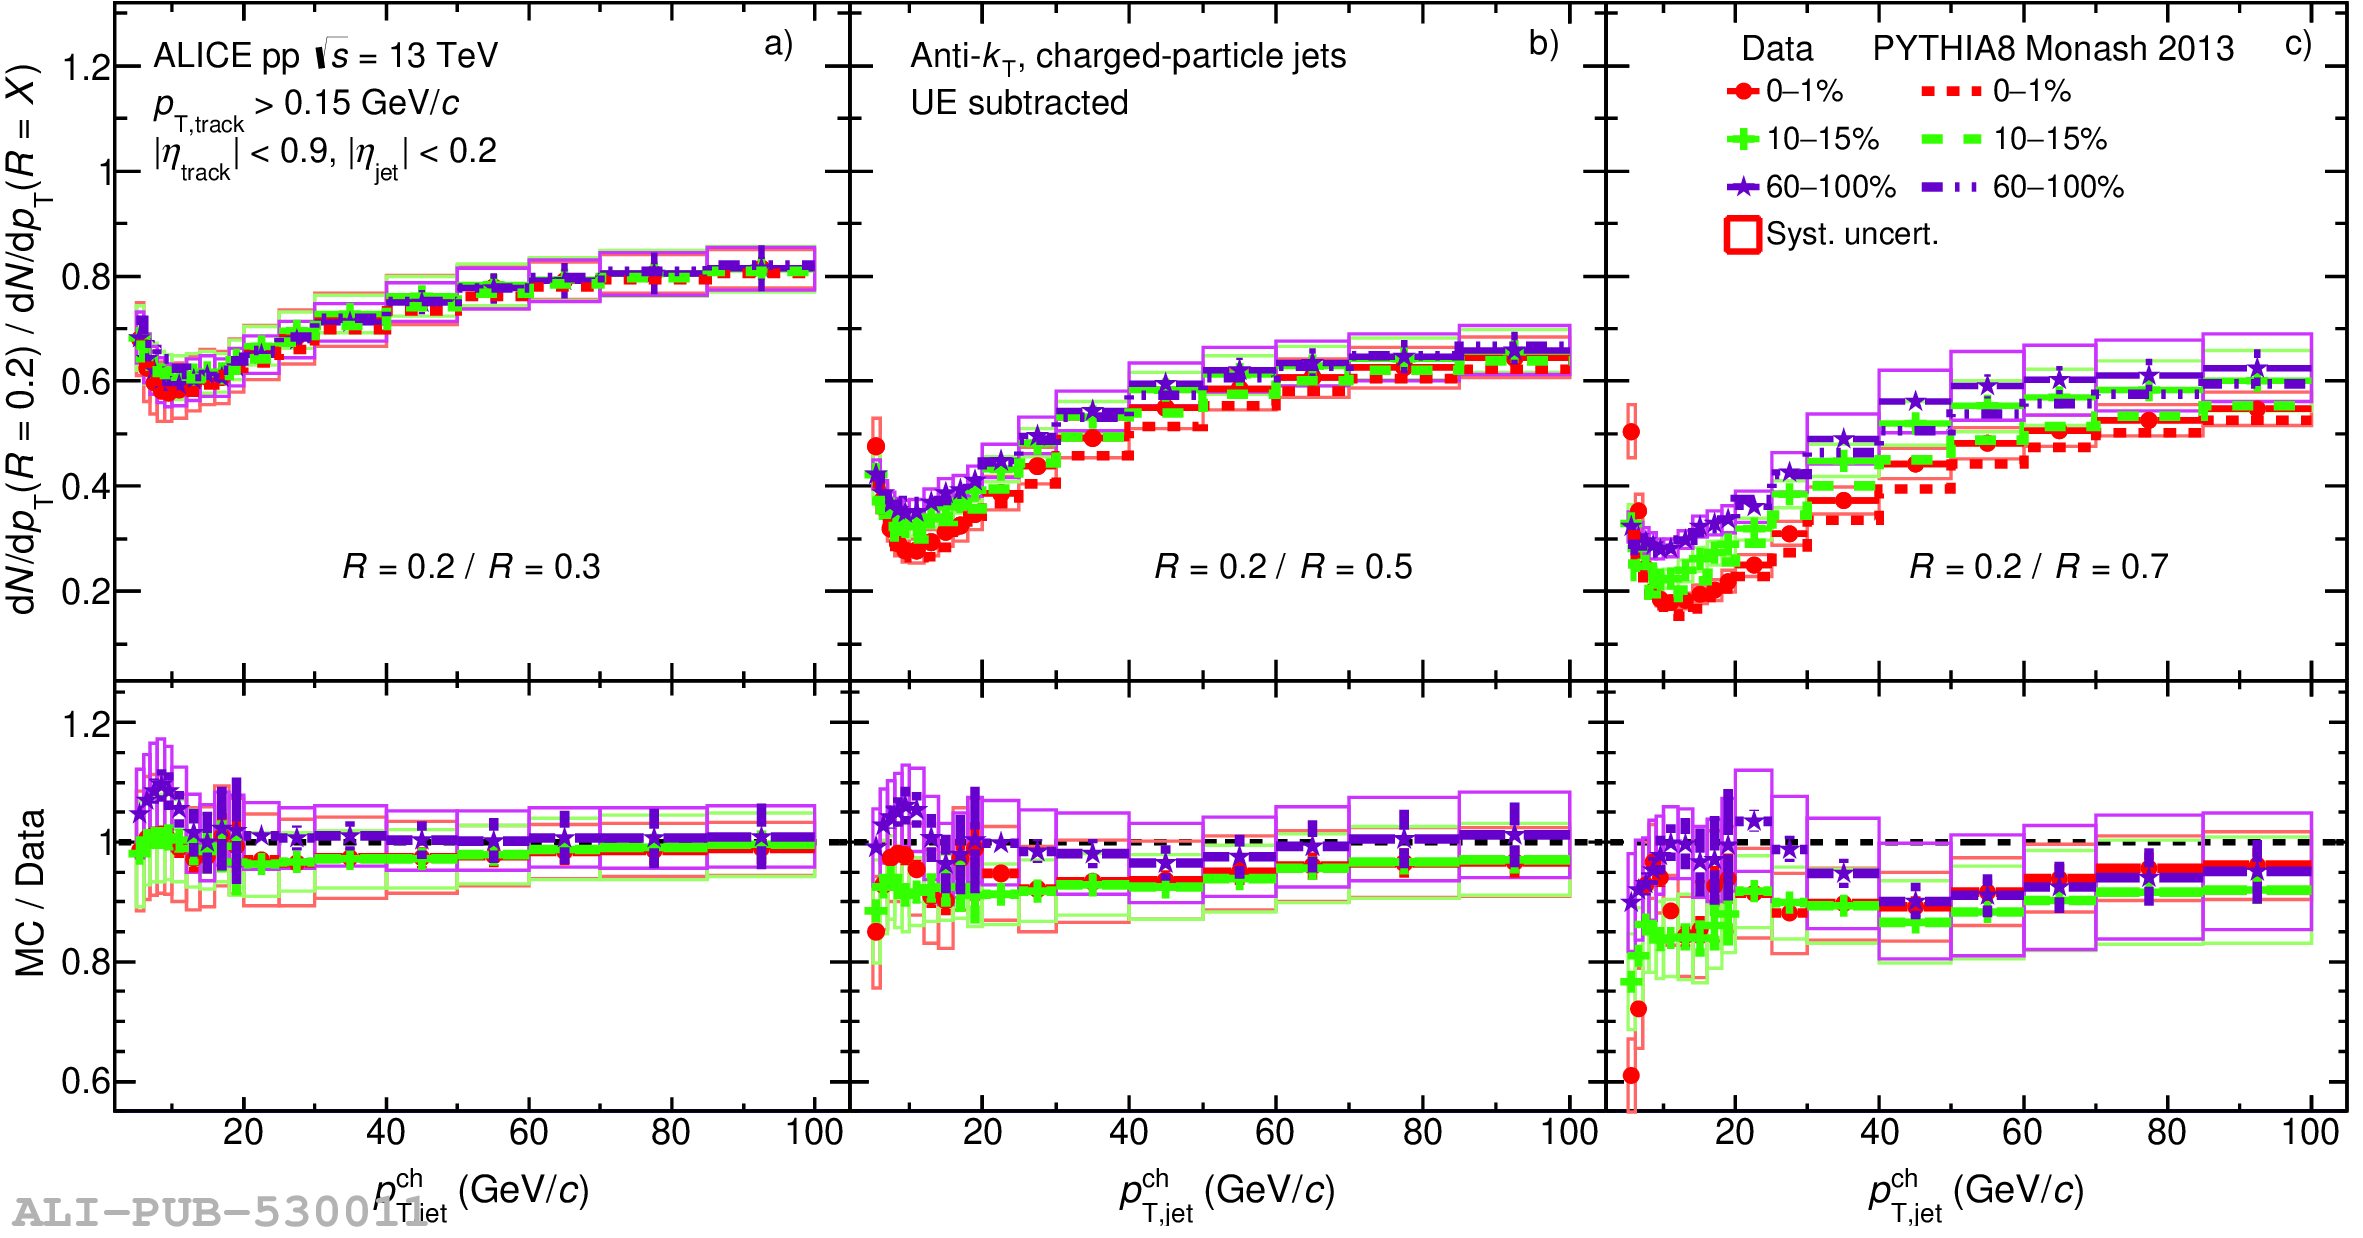
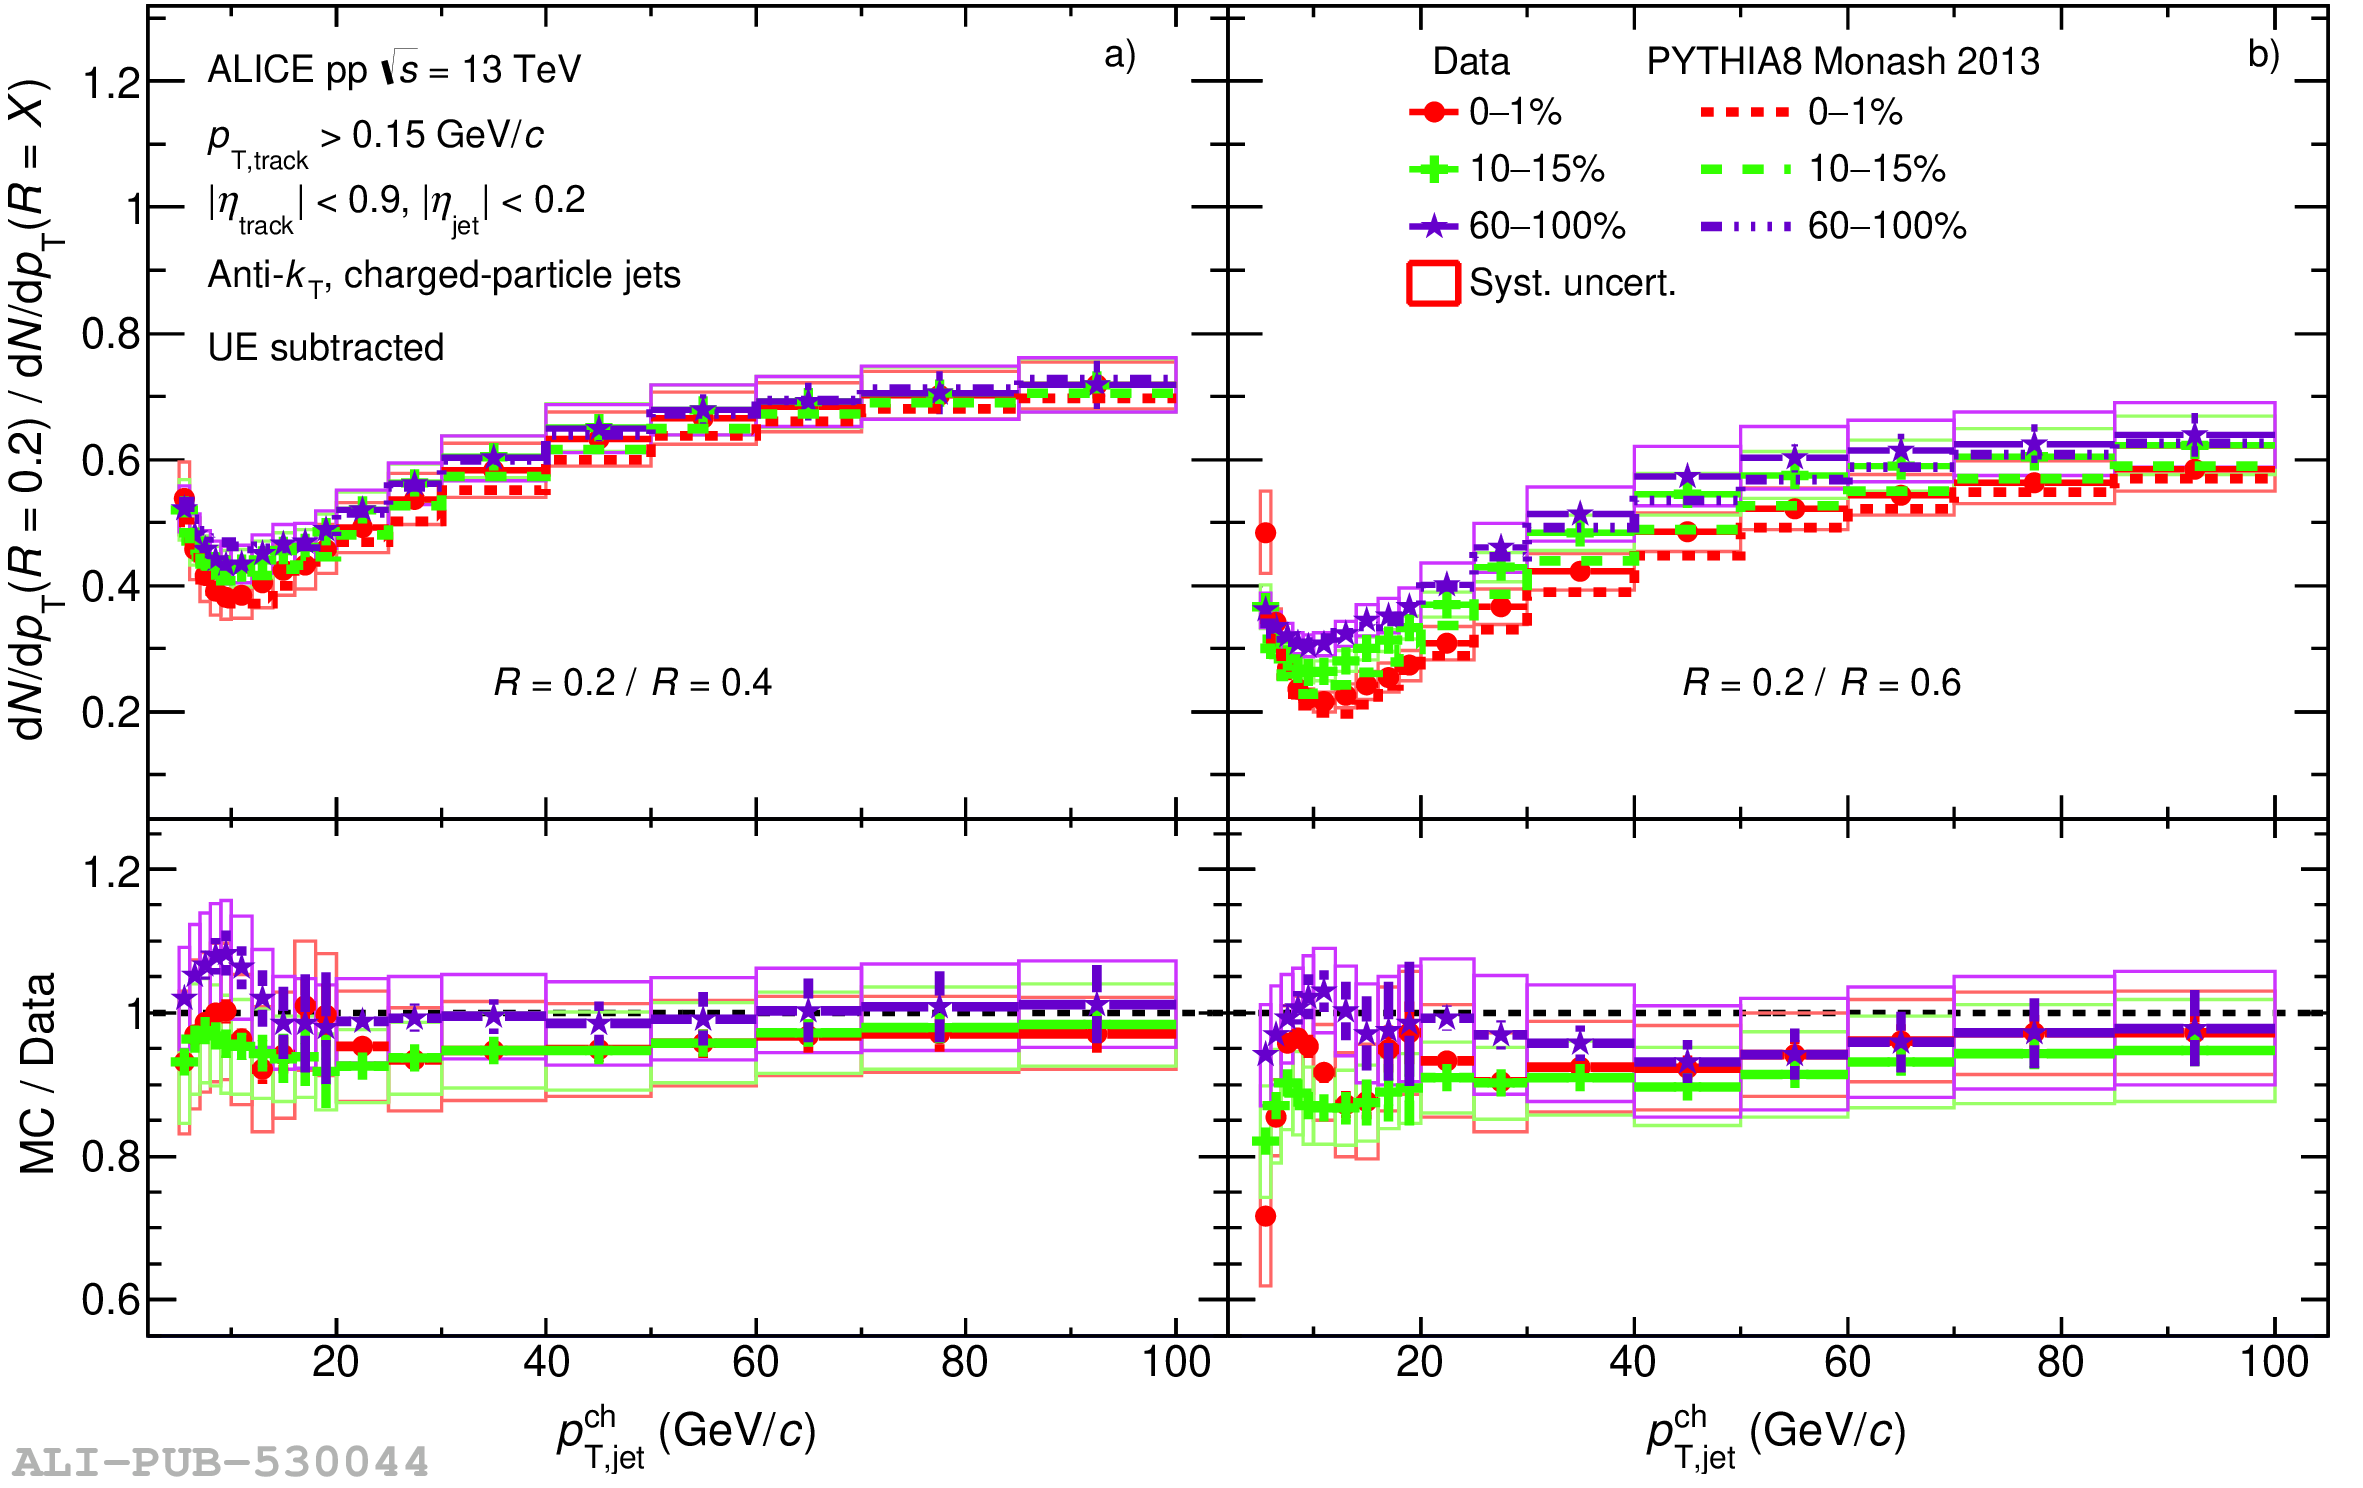
Comparison of jet spectra ratios of $R = 0.2$ to $R =$ a) $0.3$, b) $0.5$, c) $0.7$ in three multiplicity intervals (0--1\%, 10--15\% and 60--100\%) and compared with PYTHIA8 simulations. Statistical and systematic uncertainties are shown as vertical error bars and boxes around the data points, respectively Results for other radii can be found in Appendix Fig. \ref{fig:MultJetCSRatioCompMC02046}.

Figure 12

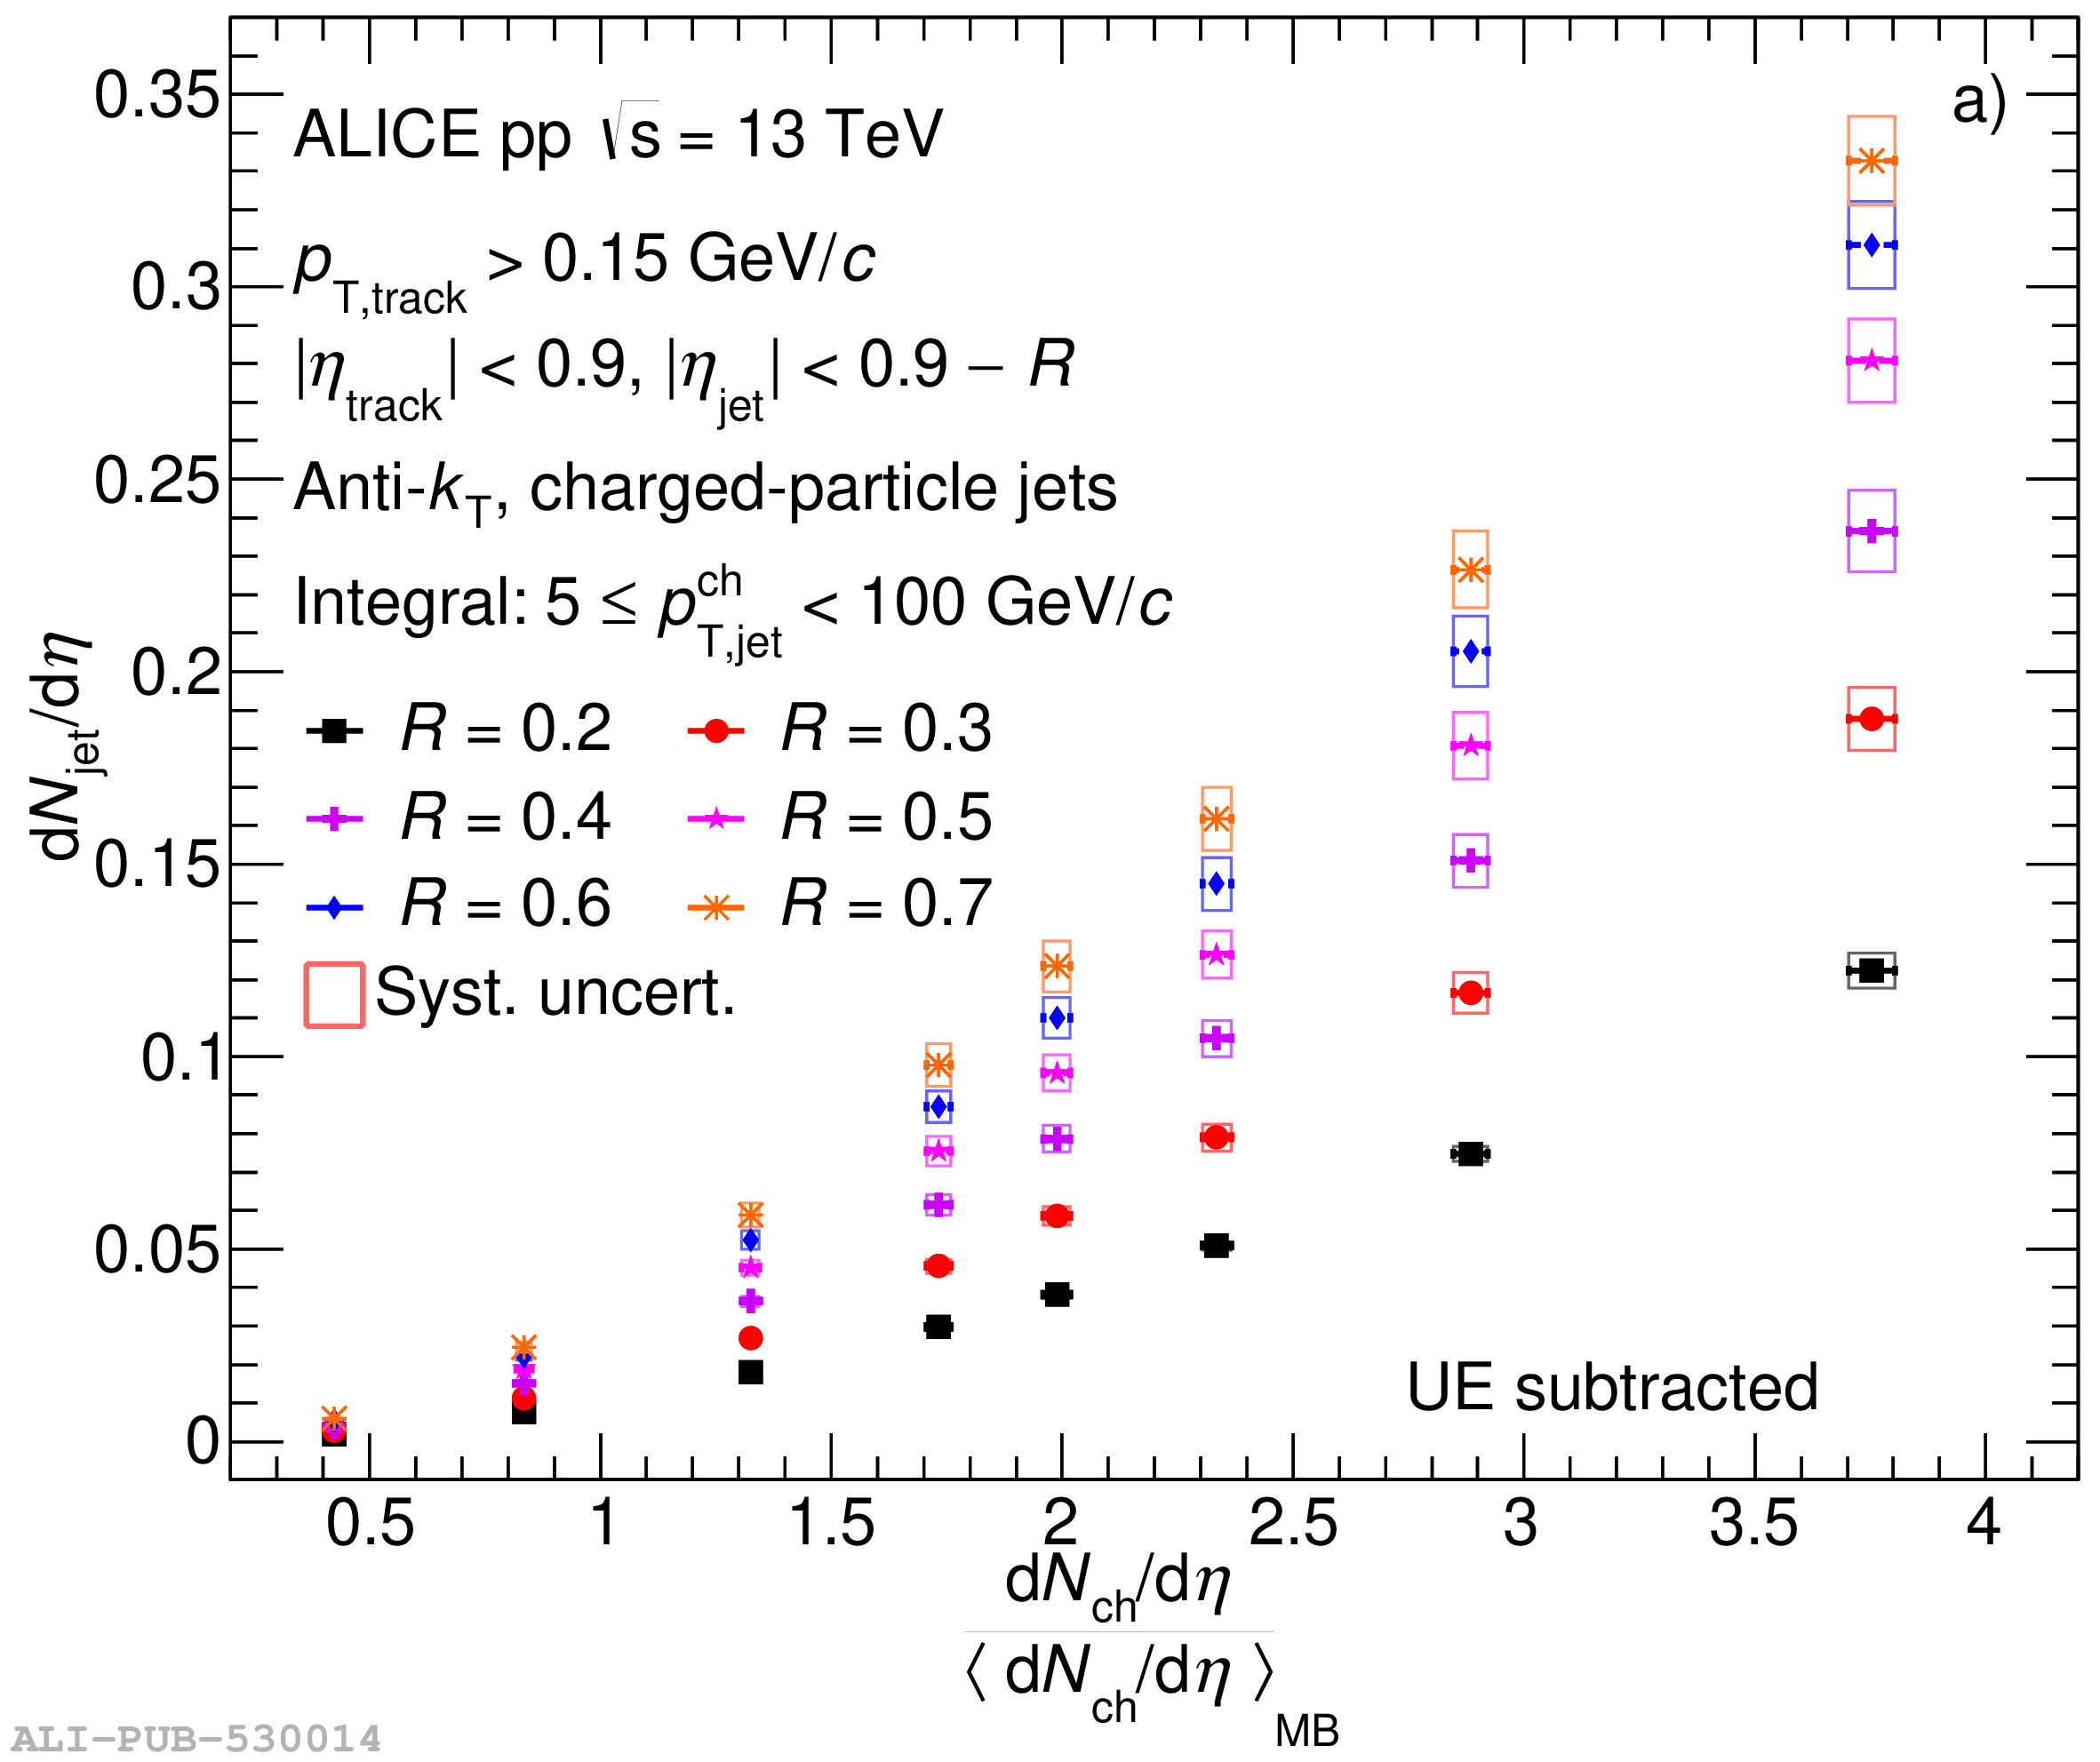
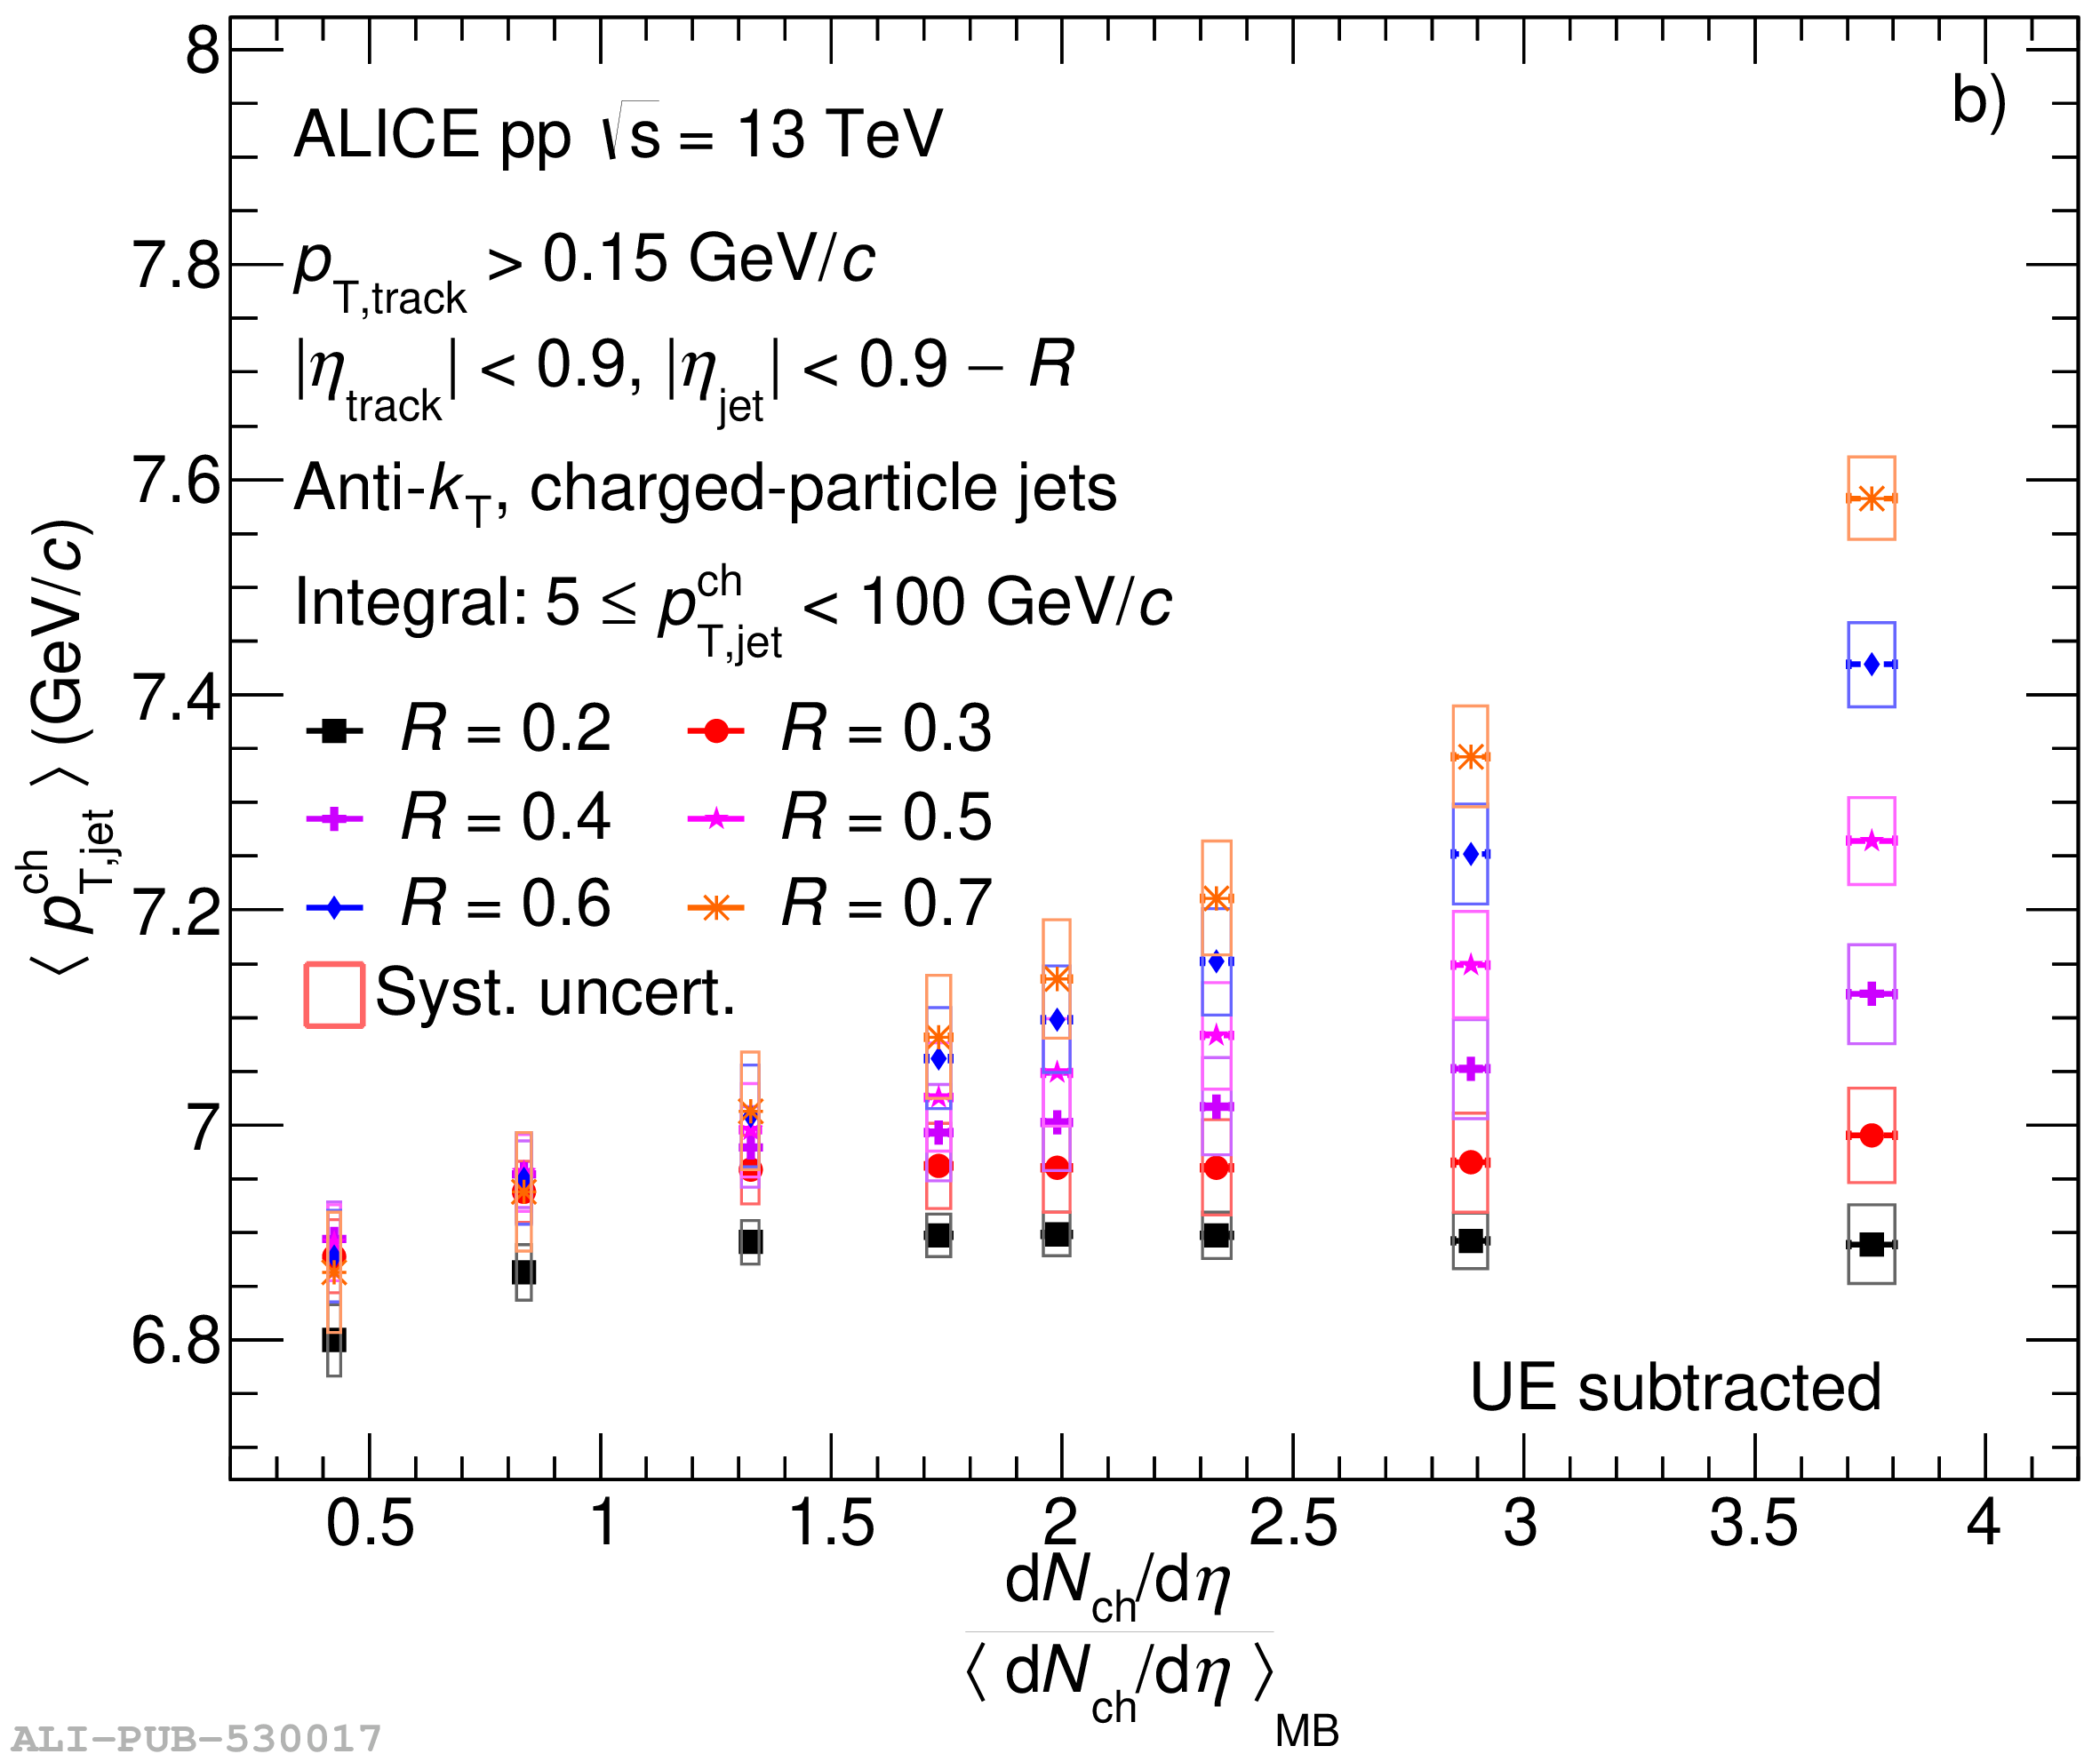
a) Integrated jet yields, and b) $\left \langle p_{\rm T} \right \rangle$ of jets with $5\leq p_{\rm T,jet}^{\rm ch}< 100\ {\rm GeV}/c$ as a function of self-normalised charged-particle multiplicity for different resolution parameters $R$ varied from $0.2$ to $0.7$, with the charged-particle multiplicities provided in Ref. . Statistical and systematic uncertainties are shown as vertical error bars and boxes around the data points, respectively.

Figure 13

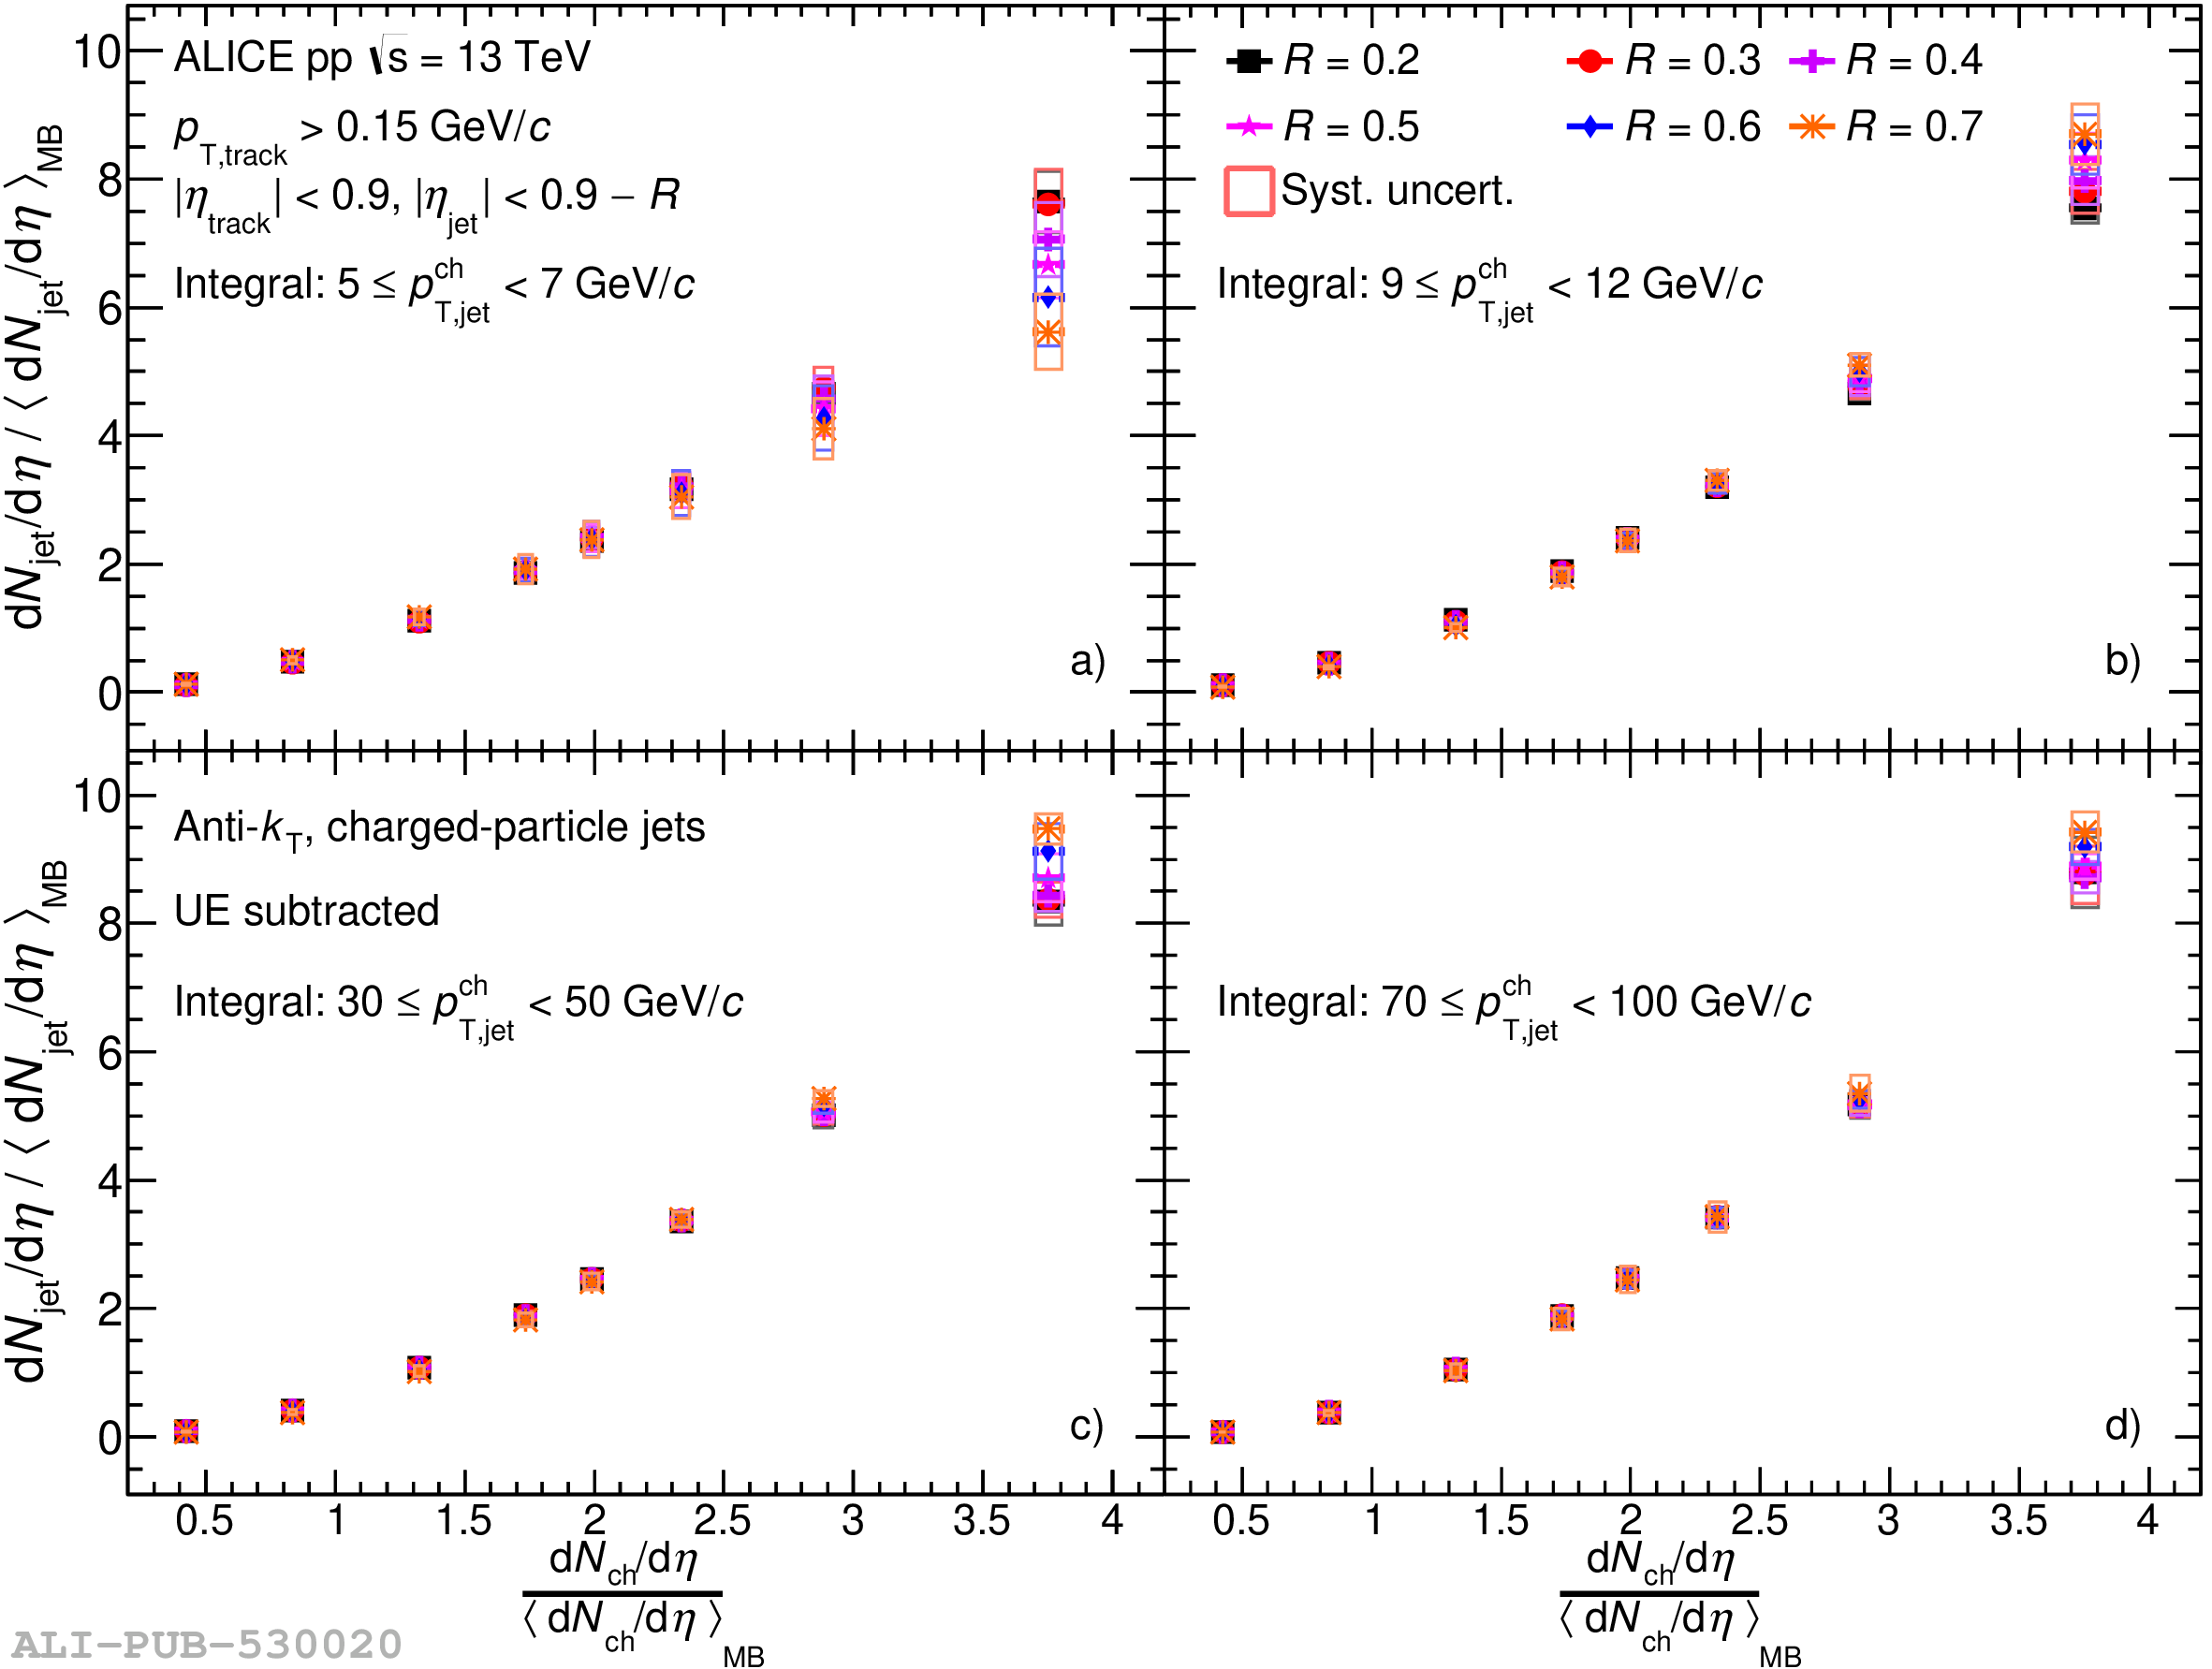
Self-normalised jet yields as a function of the self-normalised charged-particle multiplicity for different resolution parameters $R$ varied from $0.2$ to $0.7$ in different jet $p_{\rm T}$ intervals: a) $5\leq p_{\rm T,jet}^{\rm ch}< 7\ {\rm GeV}/c$, b) $9\leq p_{\rm T,jet}^{\rm ch}< 12\ {\rm GeV}/c$, c) $30\leq p_{\rm T,jet}^{\rm ch}< 50\ {\rm GeV}/c$, and d) $70\leq p_{\rm T,jet}^{\rm ch}< 100\ {\rm GeV}/c$. The charged-particle multiplicities are taken from Ref. . Statistical and systematic uncertainties are shown as vertical error bars and boxes around the data points, respectively.

Figure 14

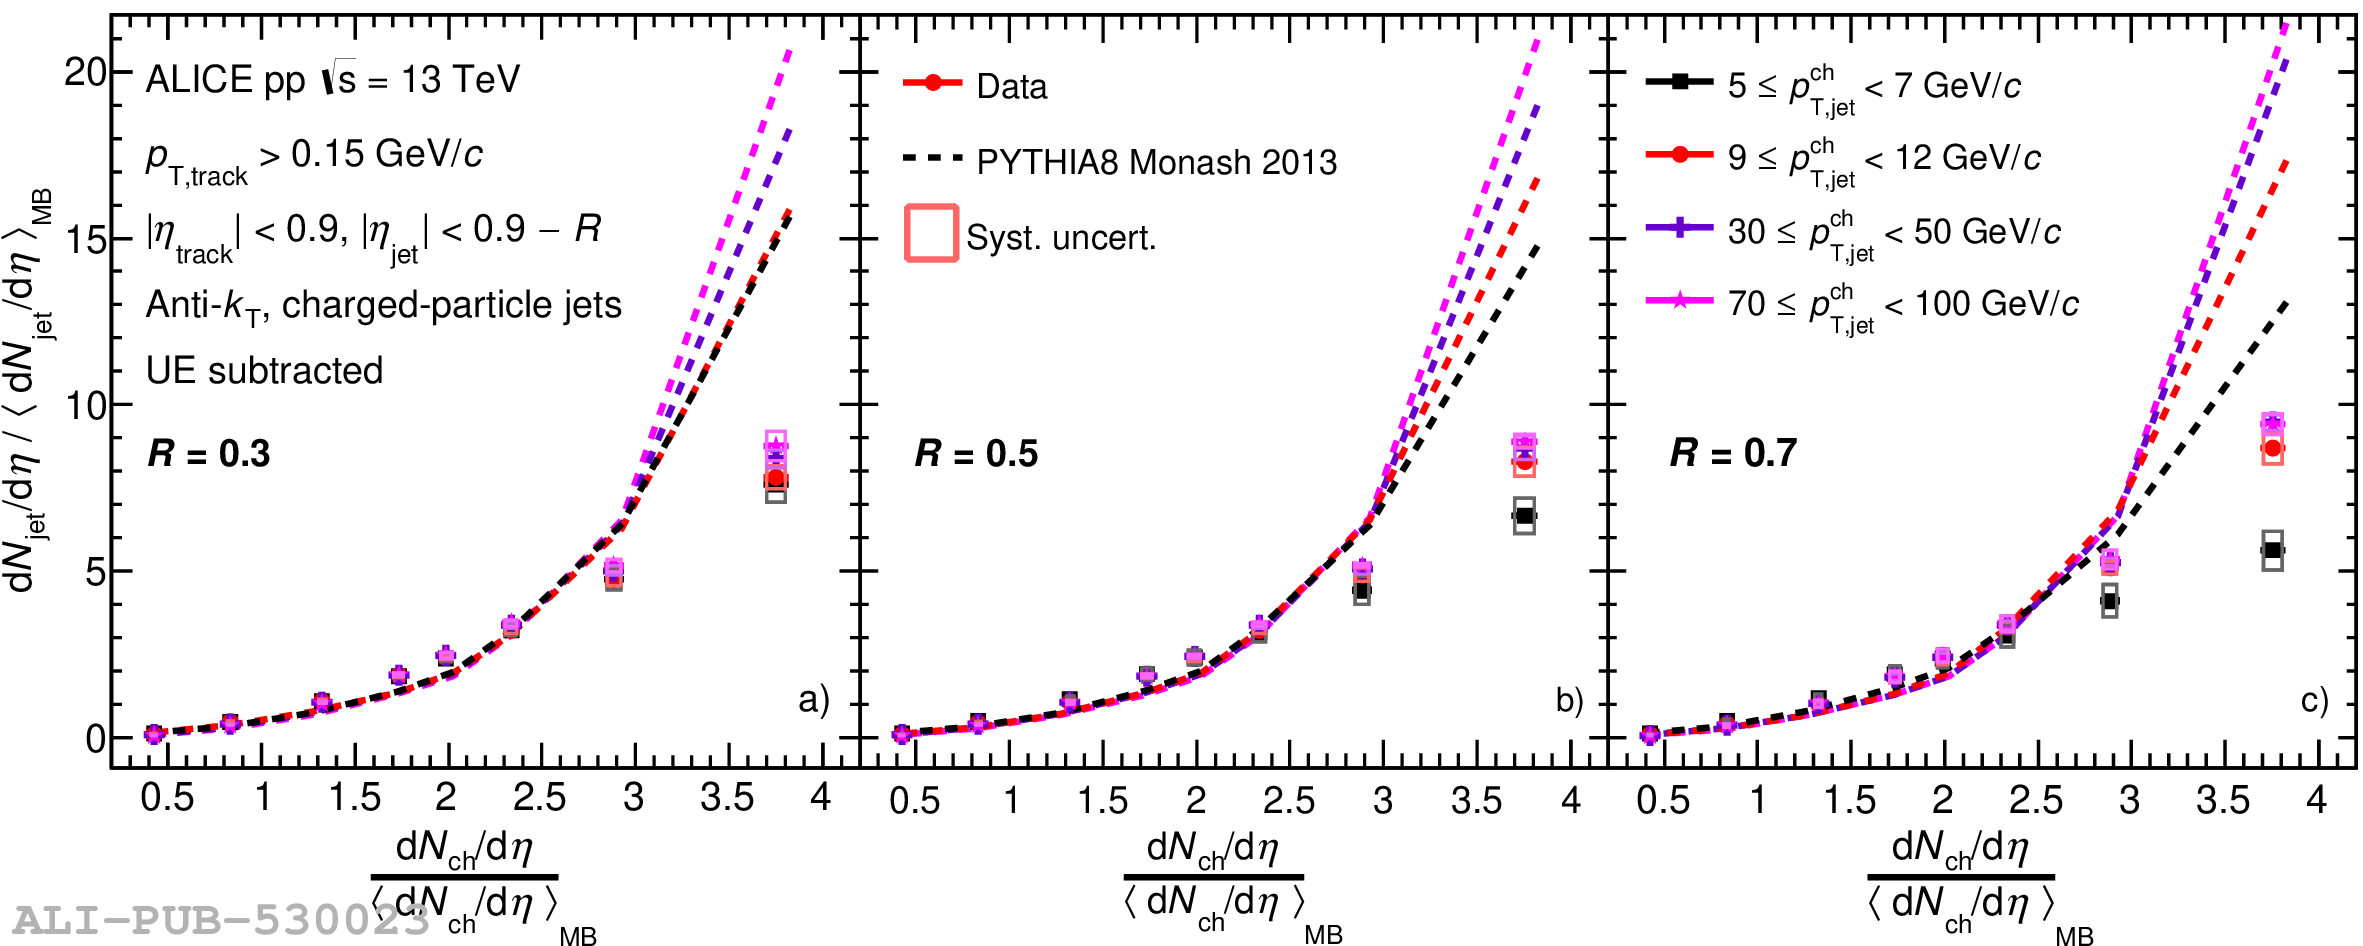
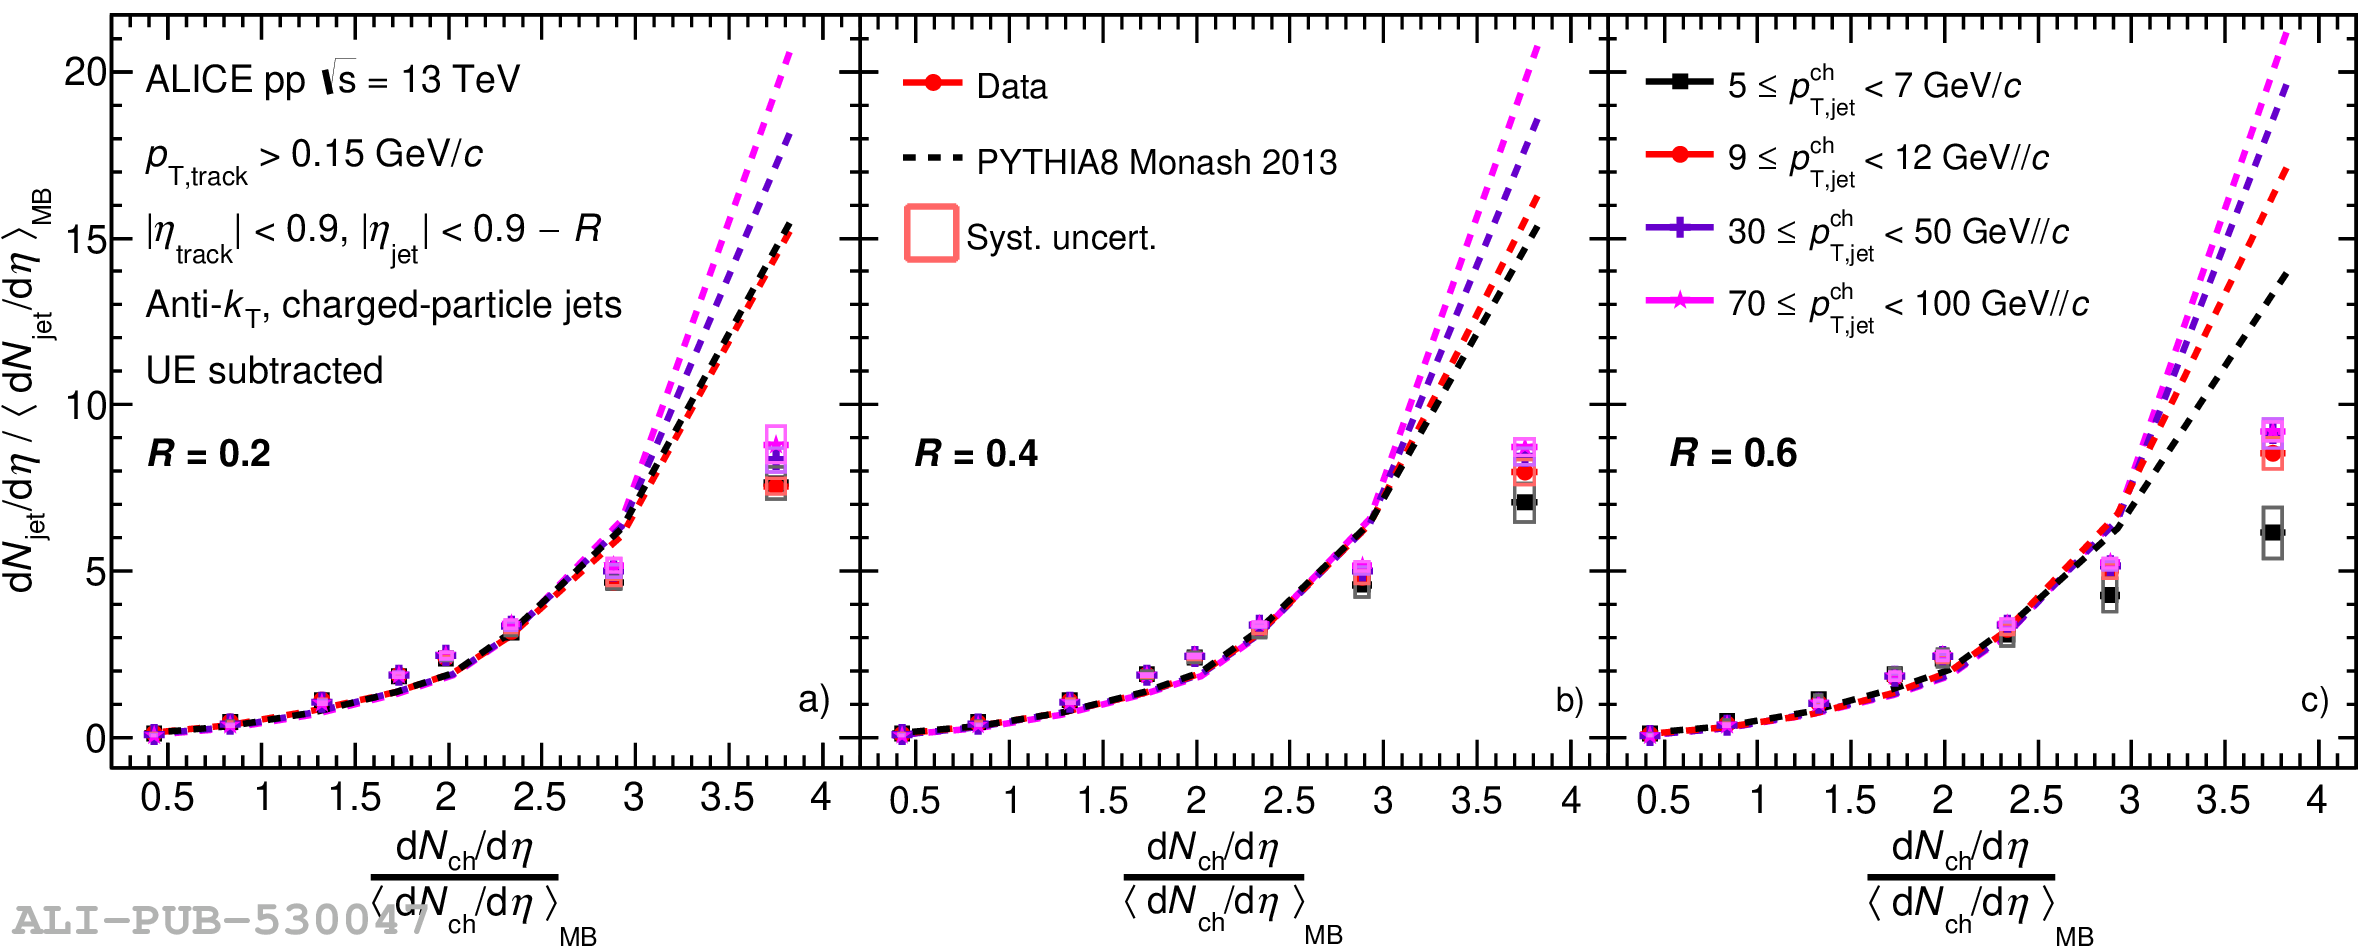
Comparison of self-normalised jet yields as a function of the self-normalised charged-particle multiplicity in four selected jet $\pt$ intervals ($5\leq p_{\rm T,jet}^{\rm ch}< 7\ {\rm GeV}/c$, $9\leq p_{\rm T,jet}^{\rm ch}< 12\ {\rm GeV}/c$, $30\leq p_{\rm T,jet}^{\rm ch}< 50\ {\rm GeV}/c$, and $70\leq p_{\rm T,jet}^{\rm ch}< 100\ {\rm GeV}/c$) for a given jet radii: a) $R = 0.3$, b) $R = 0.5$, c) $R = 0.7$ between data and PYTHIA8 predictions, with the charged-particle multiplicities provided in Ref. . Statistical and systematic uncertainties are shown as vertical error bars and boxes around the data points, respectively. Results for other radii can be found in Appendix Fig. \ref{fig:IntegralRatio_Pt0246}.

Figure A.1

Inclusive charged-particle jet cross sections in pp collisions at $\sqrt{s} =$ 13 TeV using the anti-$k_{\rm T}$ algorithm for different resolution parameters $R$ varied from $0.2$ to $0.7$, without UE subtraction. Statistical uncertainties are displayed as vertical error bars. The total systematic uncertainties are shown as solid boxes around the data points.

Figure A.2

Inclusive charged-particle jet cross sections in pp collisions at $\sqrt{s} = 13$ TeV without UE subtraction and compared to LO and NLO MC predictions with different resolution parameters $R$ varied from $0.2$ to $0.7$. The statistical uncertainties are displayed as vertical error bars. The systematic uncertainties on the data are indicated by shaded boxes in the top panels and shaded bands drawn around unity in the bottom panels. The red dashed lines in the ratio correspond to unity.

Figure A.3

Ratio of charged-particle jet cross section for resolution parameter $R = 0.2$ to other radii $R = X $, with $X$ ranging from $0.3$ to $0.7$, without UE subtraction, and the comparison of calculations from LO (PYTHIA) and NLO event generators (POWHEG+PYTHIA8). The systematic uncertainties of the cross section ratios from data are indicated by solid boxes around data points in the upper panels, and shaded bands around unity in the lower panels. No uncertainties are shown for theoretical predictions for better visibility.

Figure A.4

Comparison of charged-particle jet cross section ratios for $\sigma(R=0.2)/\sigma(R=0.4)$ and $\sigma(R=0.2)/\sigma(R=0.6)$ without UE subtraction in pp collisions at $\sqrt{s} = 13$ and $5.02$ $\mathrm{TeV}$ .

Figure A.5

Comparison of jet production ratios of $R = 0.2$ to a) $R = 0.4$, b) $R = 0.6$ in three multiplicity intervals (0--1\%, 10--15\% and 60--100\%) and compared with PYTHIA simulations. Statistical and systematic uncertainties are shown as vertical error bars and boxes around the data points, respectively.

Figure A.6

Comparison of jet production ratios of $R = 0.2$ to a) $R = 0.4$, b) $R = 0.6$ in three different multiplicity classes and compared with PYTHIA MC simulations. Statistical and the total systematic uncertainties are shown as vertical error bars and boxes around the data points, respectively.

Figure A.7

Comparison of self-normalised jet yields as a function of the self-normalised charged-particle multiplicity in four selected jet $\pt$ intervals ($5\leq p_{\rm T,jet}^{\rm ch}< 7\ {\rm GeV}/c$, $9\leq p_{\rm T,jet}^{\rm ch}< 12\ {\rm GeV}/c$, $30\leq p_{\rm T,jet}^{\rm ch}< 50\ {\rm GeV}/c$, and $70\leq p_{\rm T,jet}^{\rm ch}< 100\ {\rm GeV}/c$) for a given jet radii: a) $R = 0.2$, b) $R = 0.4$, c) $R = 0.6$ between data and PYTHIA8 predictions. The charged-particle multiplicities are taken from Ref. . Statistical and systematic uncertainties are shown as vertical error bars and boxes around the data points, respectively.