Collective behavior has been observed in high-energy heavy-ion collisions for several decades. Collectivity is driven by the high particle multiplicities that are produced in these collisions. At the CERN Large Hadron Collider (LHC), features of collectivity have also been seen in high-multiplicity proton-proton collisions that can attain particle multiplicities comparable to peripheral Pb-Pb collisions. One of the possible signatures of collective behavior is the decrease of femtoscopic radii extracted from pion and kaon pairs emitted from high-multiplicity collisions with increasing pair transverse momentum. This decrease can be described in terms of an approximate transverse mass scaling. In the present work, femtoscopic analyses are carried out by the ALICE Collaboration on charged pion and kaon pairs produced in pp collisions at $\sqrt{s}=13$ TeV from the LHC to study possible collectivity in pp collisions. The event-shape analysis method based on transverse sphericity is used to select for spherical versus jet-like events, and the effects of this selection on the femtoscopic radii for both charged pion and kaon pairs are studied. This is the first time this selection method has been applied to charged kaon pairs. An approximate transverse-mass scaling of the radii is found in all multiplicity ranges studied when the difference in the Lorentz boost for pions and kaons is taken into account. This observation does not support the hypothesis of collective expansion of hot and dense matter that should only occur in high-multiplicity events. A possible alternate explanation of the present results is based on a scenario of common emission conditions for pions and kaons in pp collisions for the multiplicity ranges studied.
Phys. Rev. C 109, 024915 (2024)
HEP Data
e-Print: arXiv:2310.07509 | PDF | inSPIRE
CERN-EP-2023-229
Figure group
Figure 1
The experimental probability $P$ of having events of different transverse sphericity $S_{\rm T}$ in the given raw multiplicity $N_{\rm trk}$ intervals: (1--18), (19--30), and ($>30$). There are no corrections applied for the efficiency of the sphericity selection. Only statistical uncertainties are shown and are smaller than the marker size. | 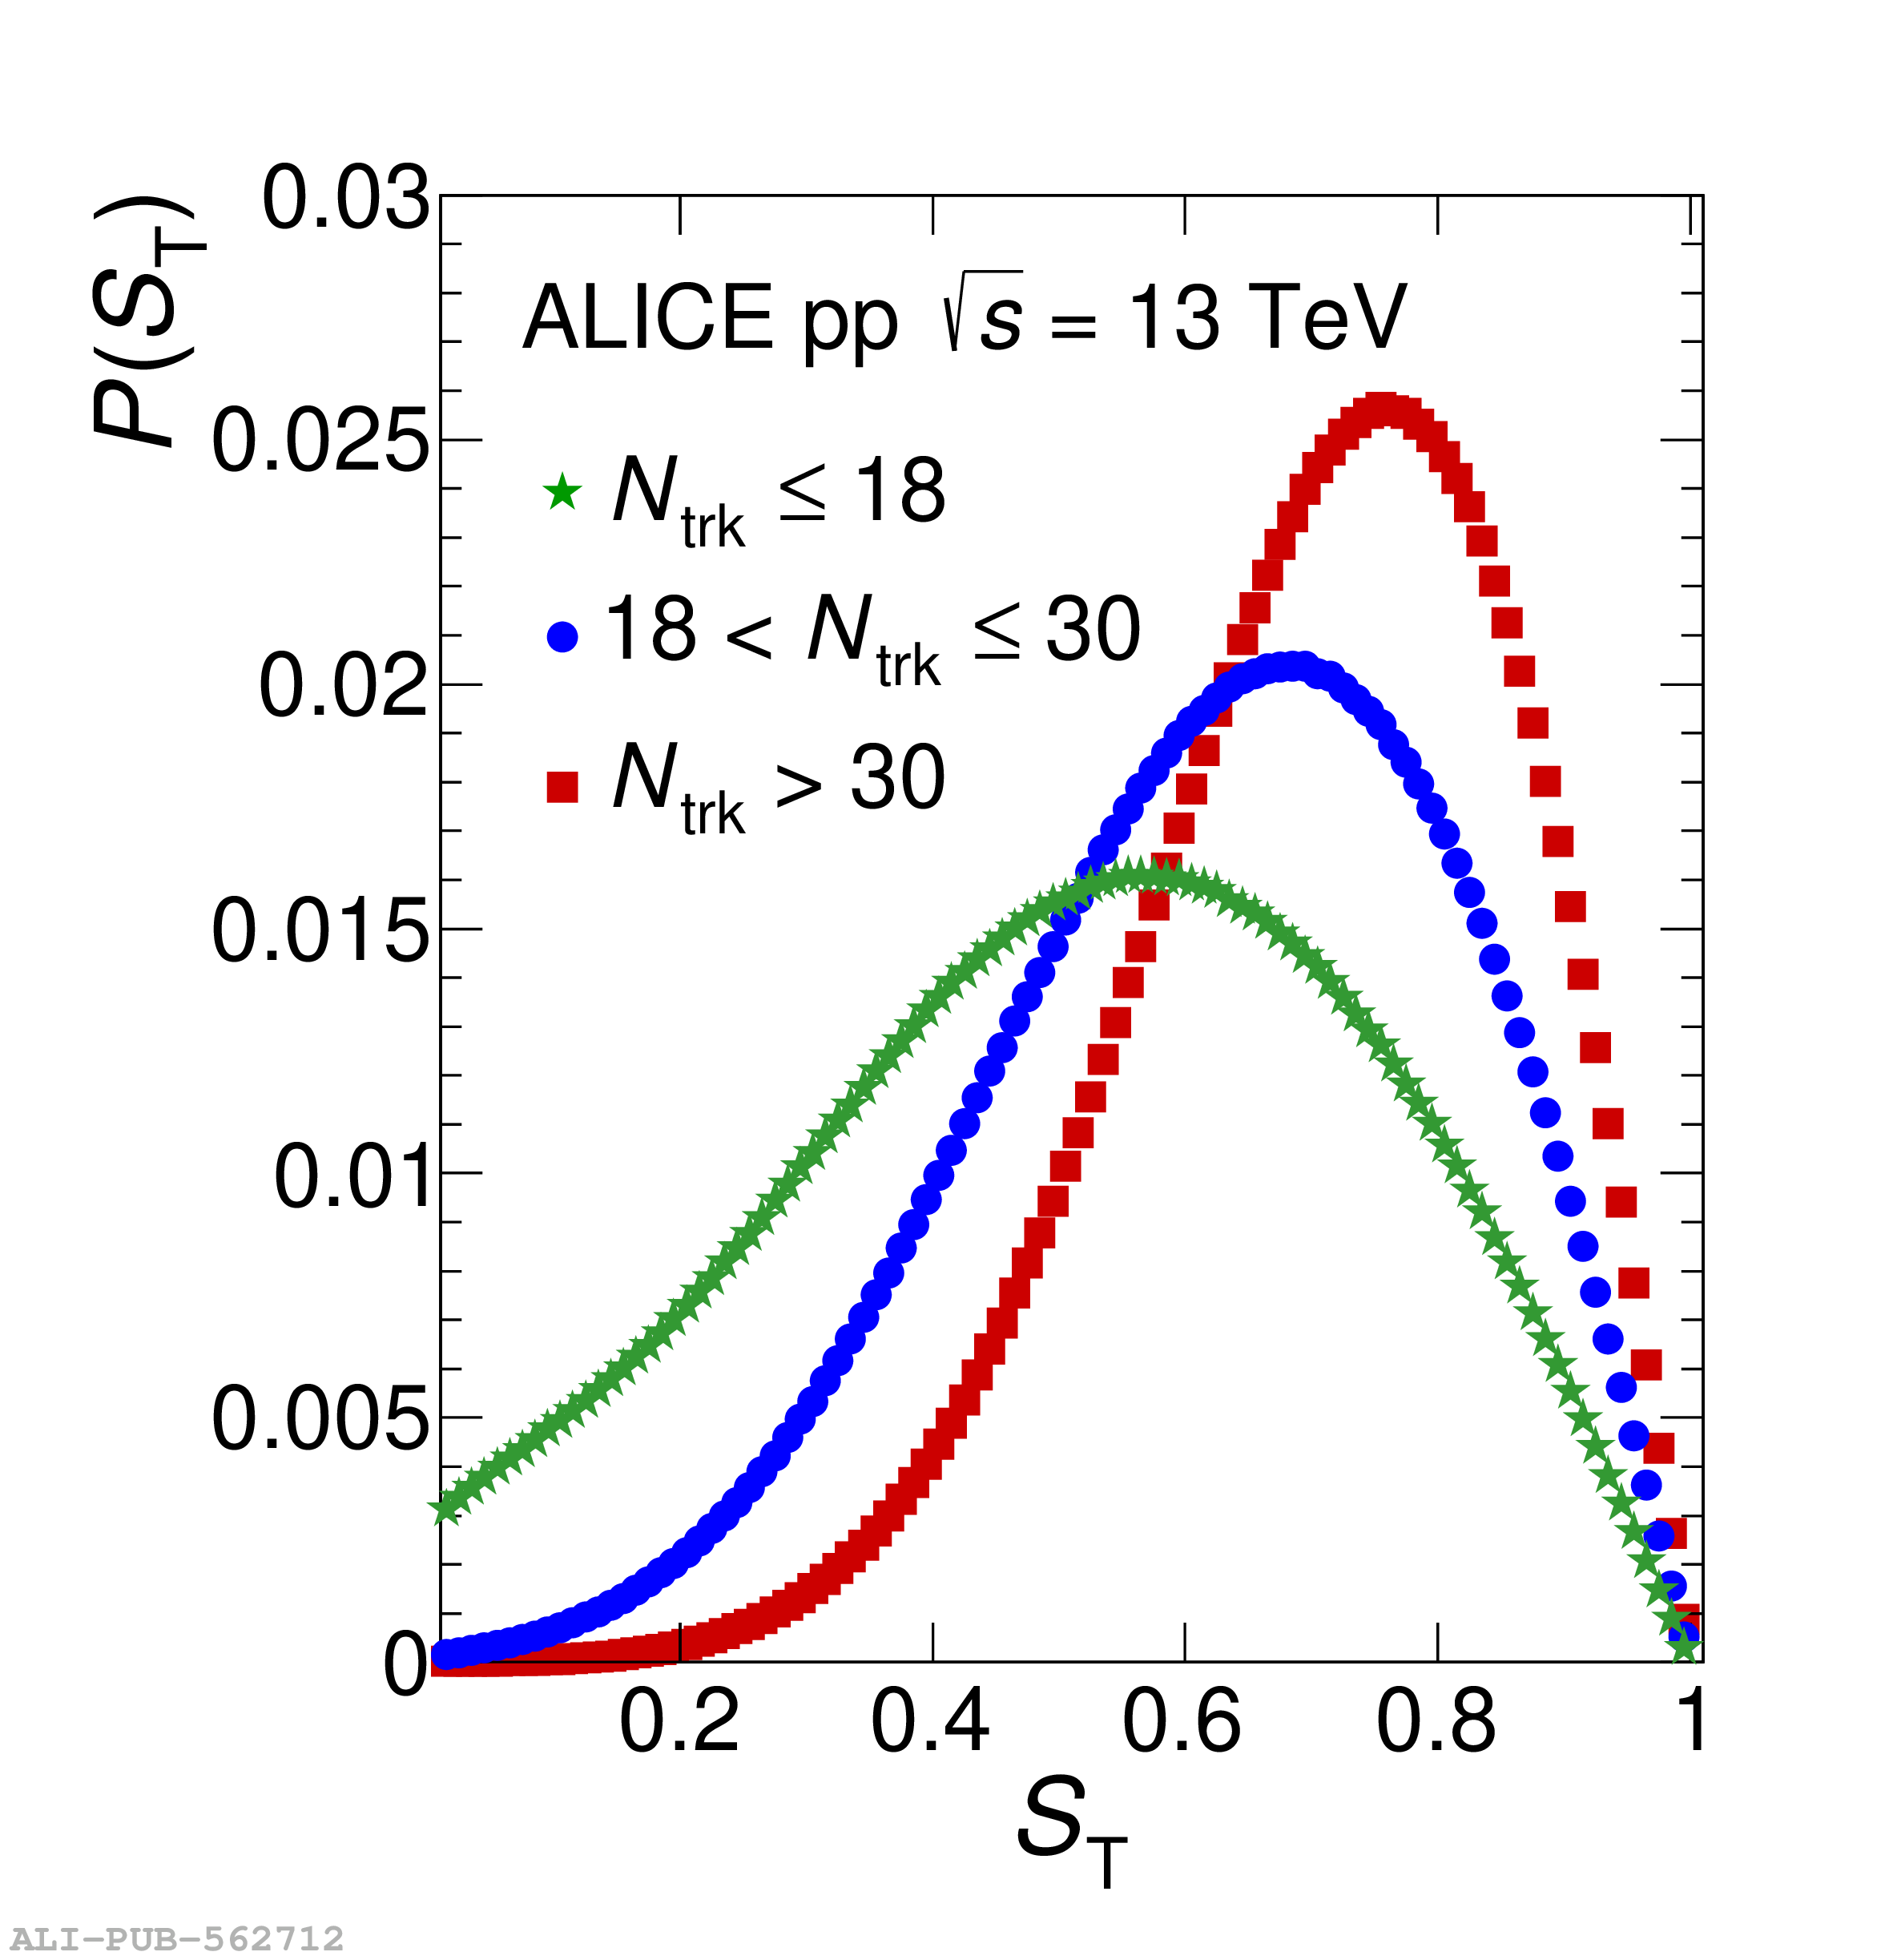 |
Figure 2
The pion raw experimental distribution of the azimuthal angle difference $\Delta\varphi$ between the trigger and the associated particles for $S_{\rm T}> 0.7$ (red circles), $S_{\rm T}< 0.3$ (blue squares), and $S_{\rm T}$ (0,1) (green stars) compared with MC PYTHIA 8 calculations shown with the corresponding open markers. The calculations include particle transport through the ALICE detector using the GEANT 3 transport package. The statistical uncertainties are smaller than the marker size. | 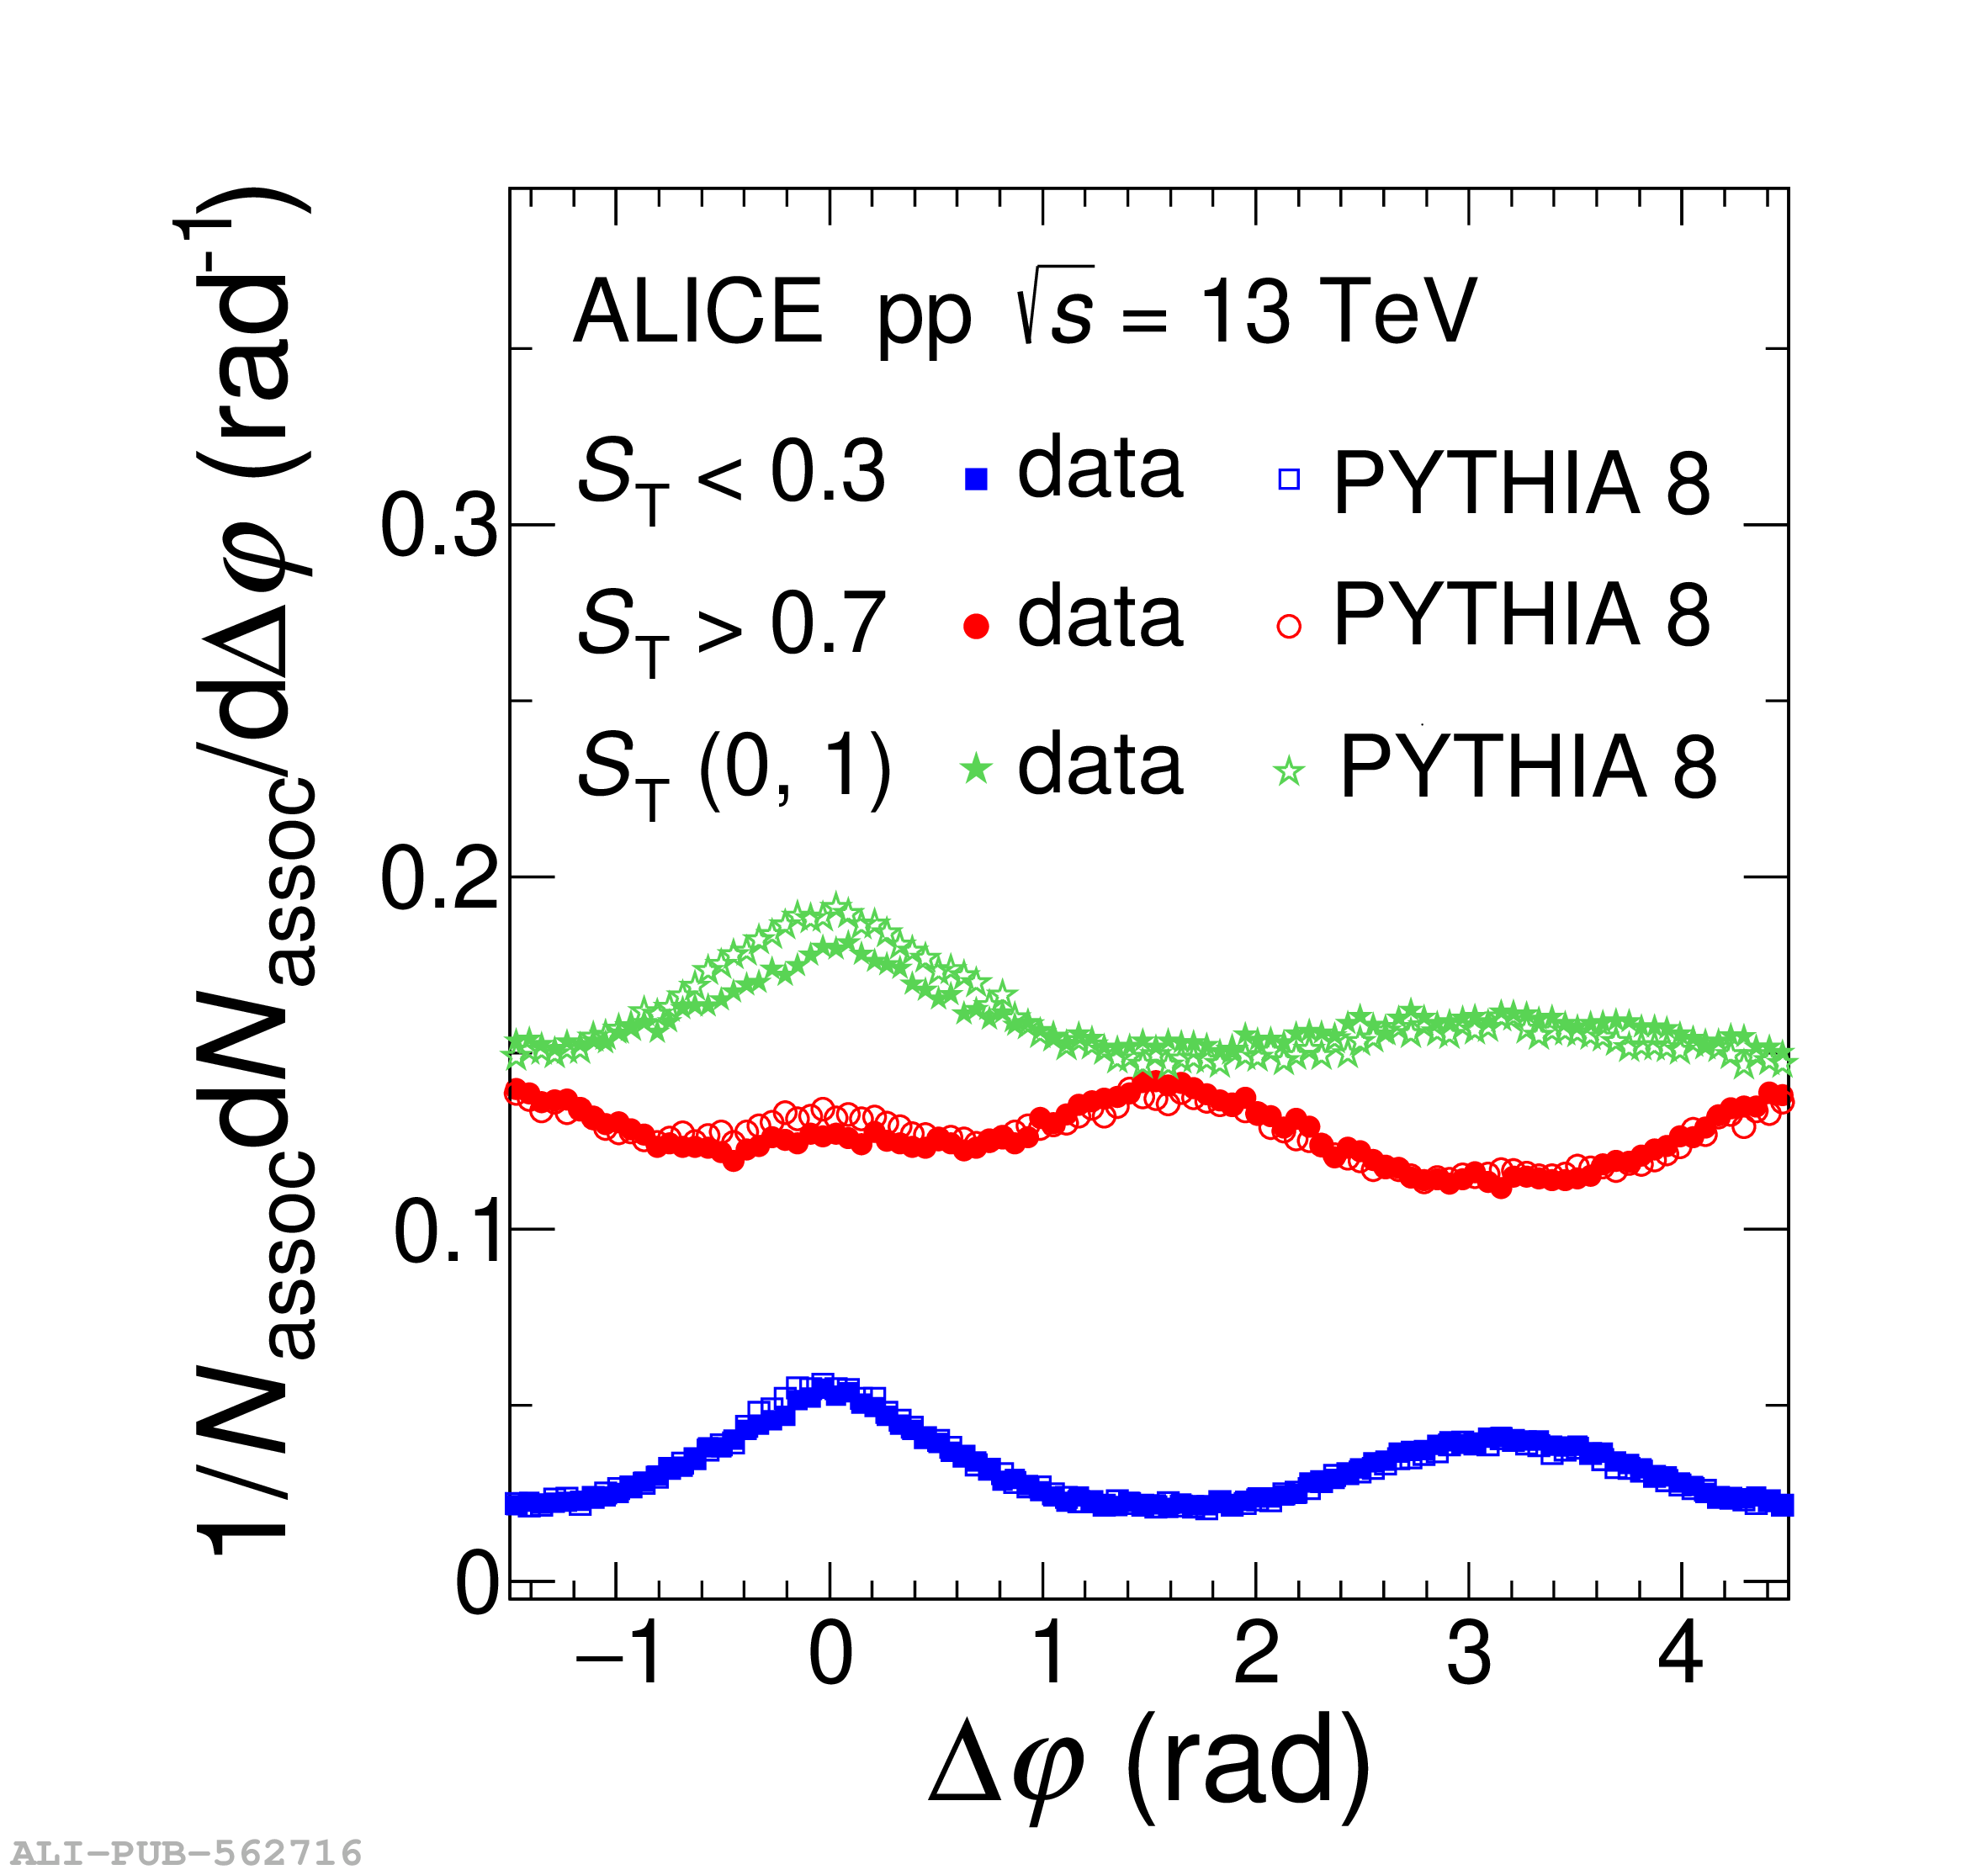 |
Figure 3
The $\pi^\pm\pi^\pm$ experimental correlation functions (green solid circles) as function of the invariant pair relative momentum $q_\mathrm{inv}$ in pp collisions at $\sqrt{s}=13$ TeV for the raw multiplicity $N_{\rm trk}$ intervals of (1--18), (19--30), and ($>30$) in the (0.15--0.3), (0.3--0.5), (0.5--0.7), (0.7--0.9), and (0.9--1.2) GeV$/c$ $k_{\rm T}$ intervals. A sphericity selection of $S_{\rm T} > 0.7$ is applied. The data are compared with PYTHIA 8 calculations, shown by blue crosses. The error bars represent the statistical uncertainties, while the systematic uncertainties are negligible. | 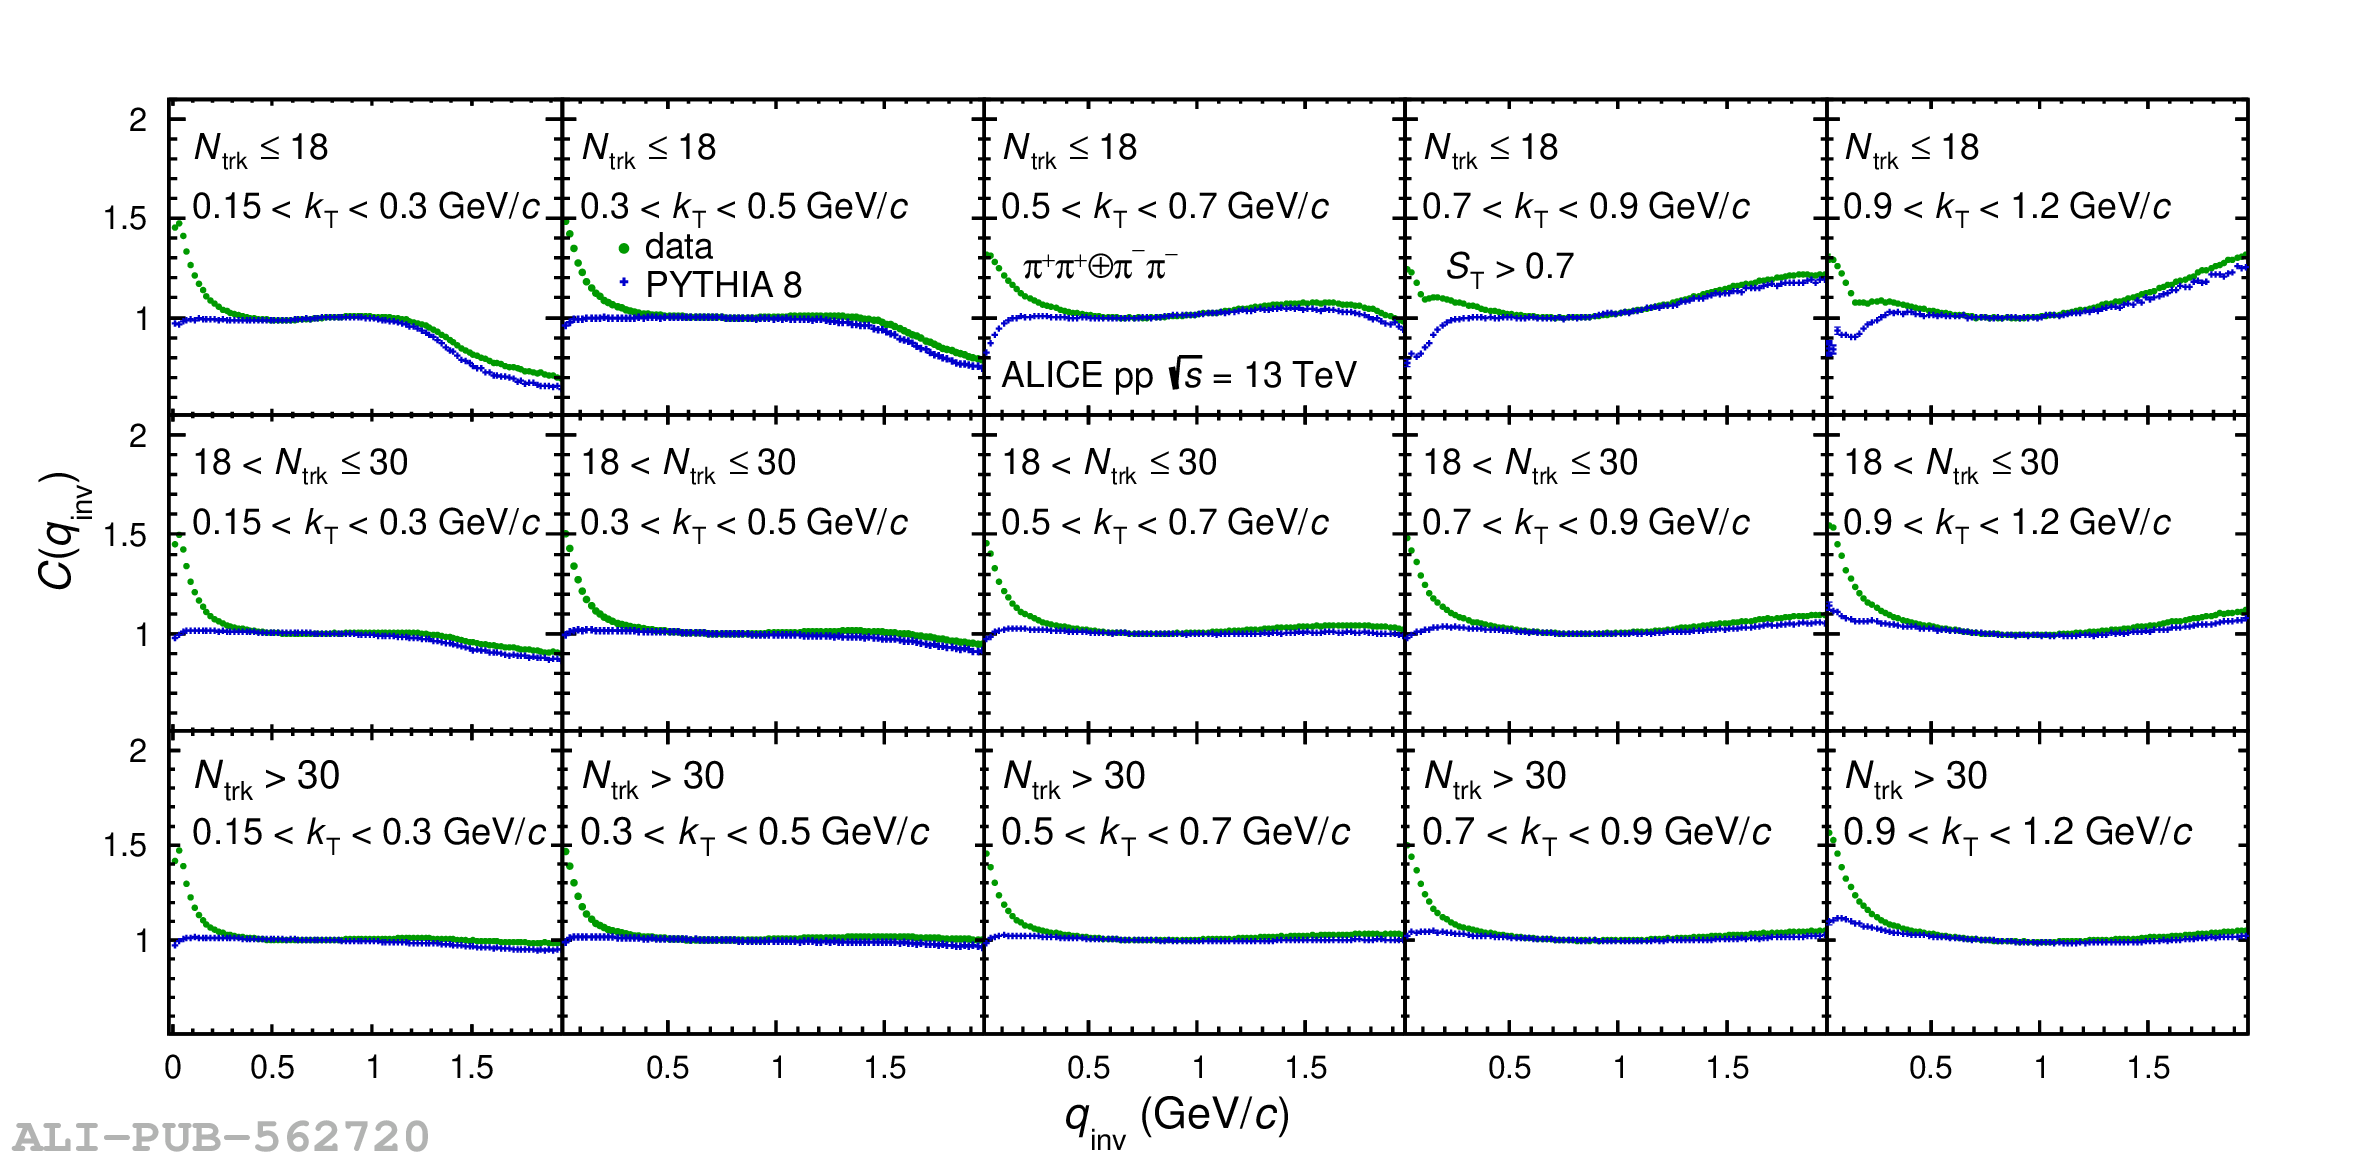 |
Figure 4
The $\pi^\pm\pi^\pm$ experimental correlation functions (green solid circles) as function of the invariant pair relative momentum $q_\mathrm{inv}$ in pp collisions at $\sqrt{s}=13$ TeV for the raw multiplicity $N_{\rm trk}$ intervals of (1--18), (19--30), and ($>30$) in the (0.15--0.3) GeV/$c$, (0.3--0.5) GeV/$c$, (0.5--0.7) GeV$/c$, (0.7--0.9) GeV$/c$ and (0.9--1.2) GeV$/c$ $k_{\rm T}$ intervals. A sphericity selection of $S_{\rm T} < 0.3$ is applied. The data are compared with PYTHIA 8 calculations shown by blue crosses. The error bars represent the statistical uncertainties, while the systematic uncertainties are negligible. | 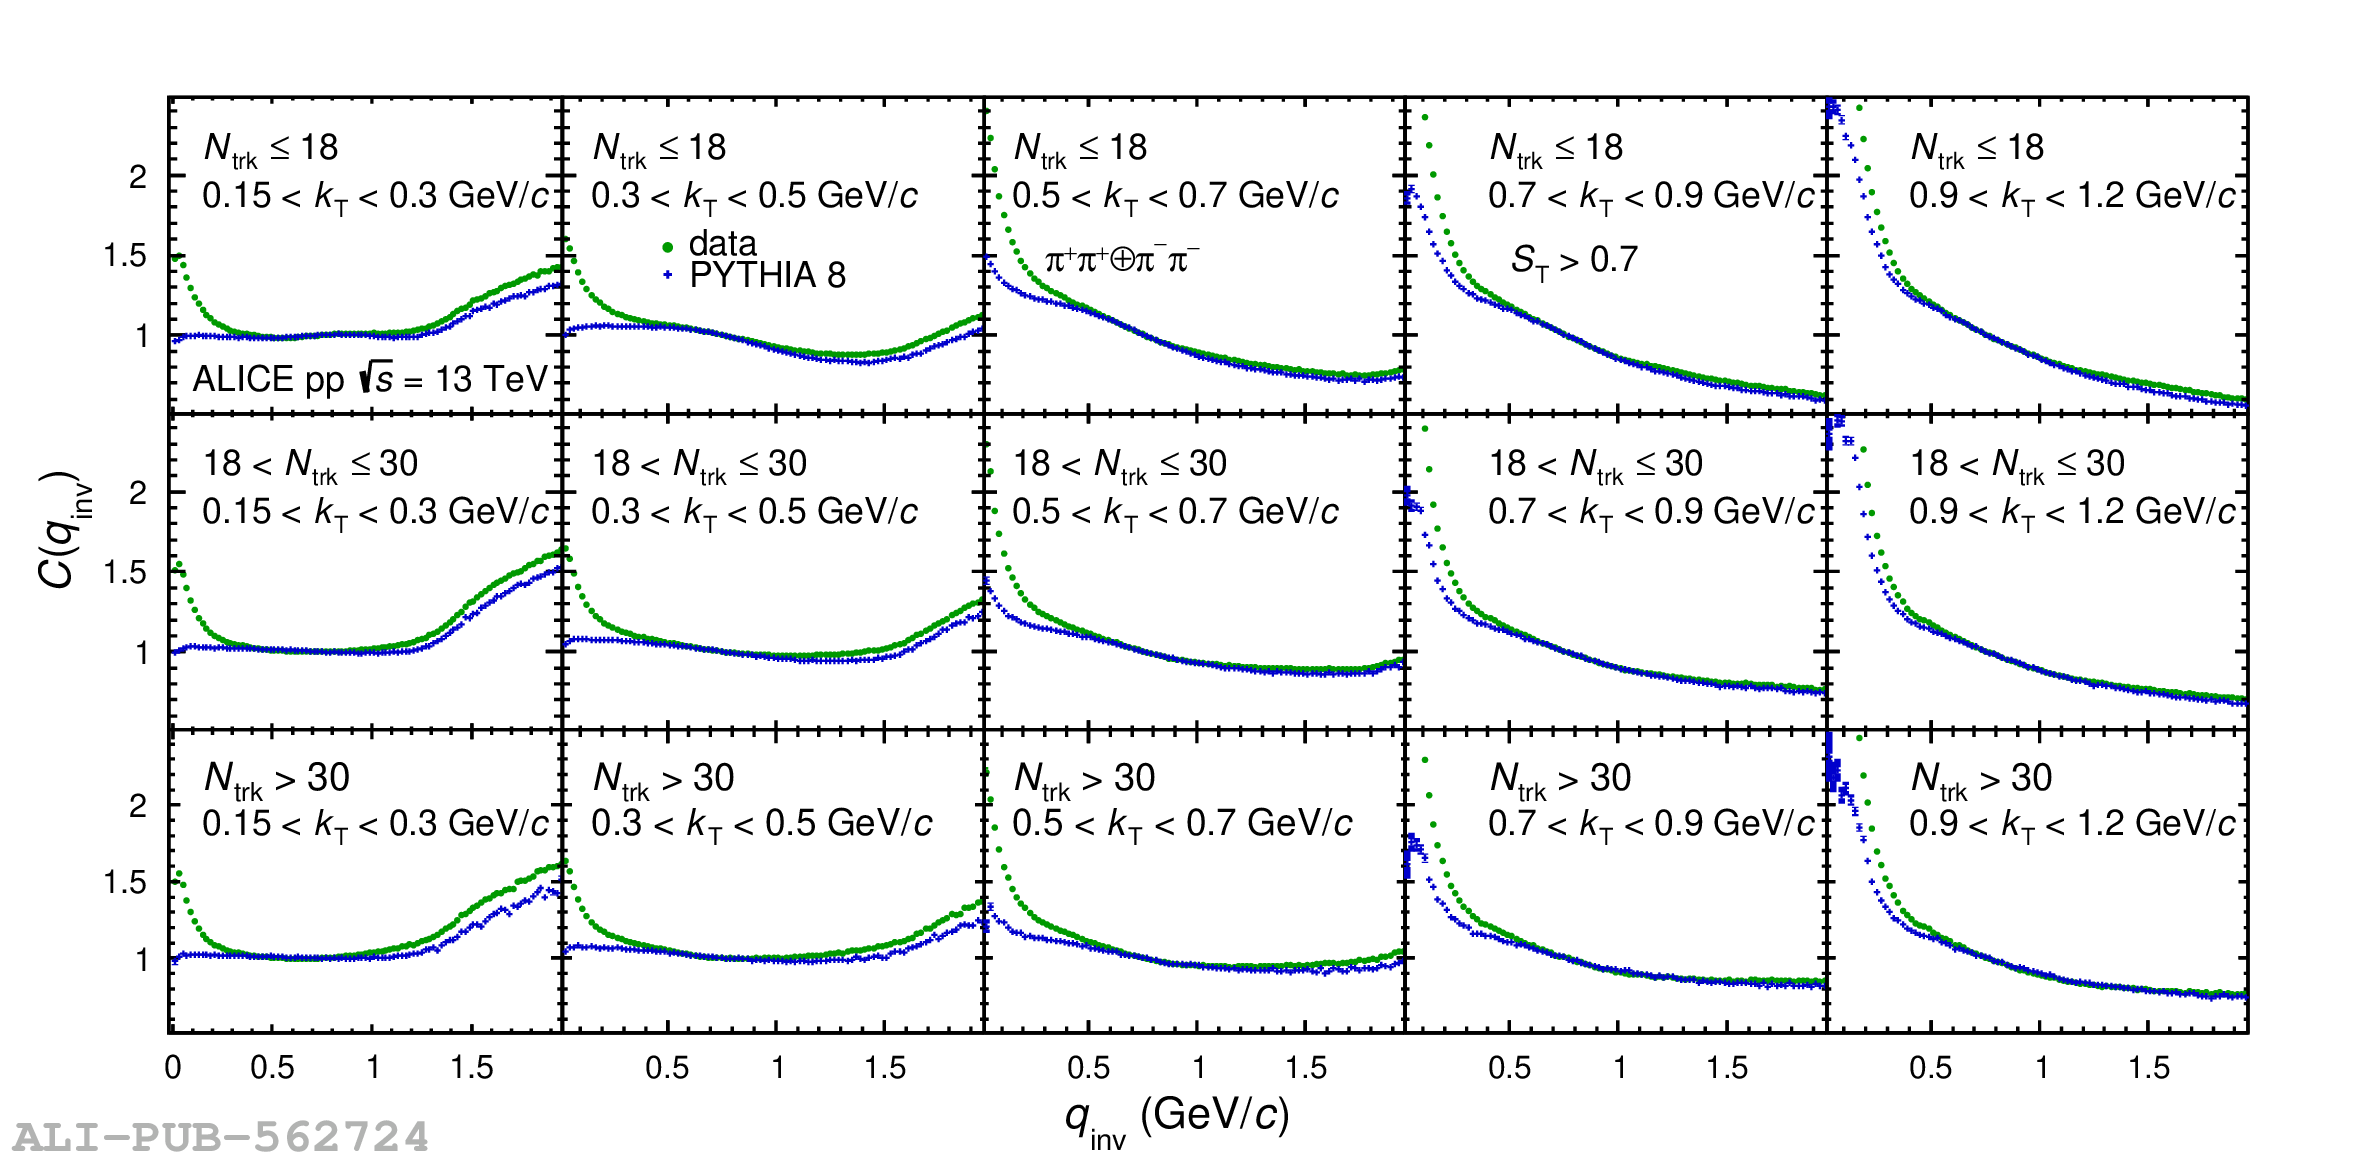 |
Figure 5
The K$^{\pm}$K$^{\pm}$ experimental correlation functions (green solid circles) as function of the invariant pair relative momentum $q_\mathrm{\rm inv}$ in pp collisions at $\sqrt{s}=13$ TeV for the raw multiplicity $N_{\rm trk}$ intervals of (1--18), (19--30), and ($>30$) in the (0.15--0.5) GeV$/c$ and (0.5--1.2) GeV$/c$ $k_{\rm T}$ intervals. A sphericity selection of $S_{\rm T} > 0.7$ is applied. The data are compared with PYTHIA 8 calculations shown by blue crosses. The PYTHIA 8 calculations are approximated with a second-order polynomial (red curves). The error bars represent the statistical uncertainties, while the systematic uncertainties are negligible. | 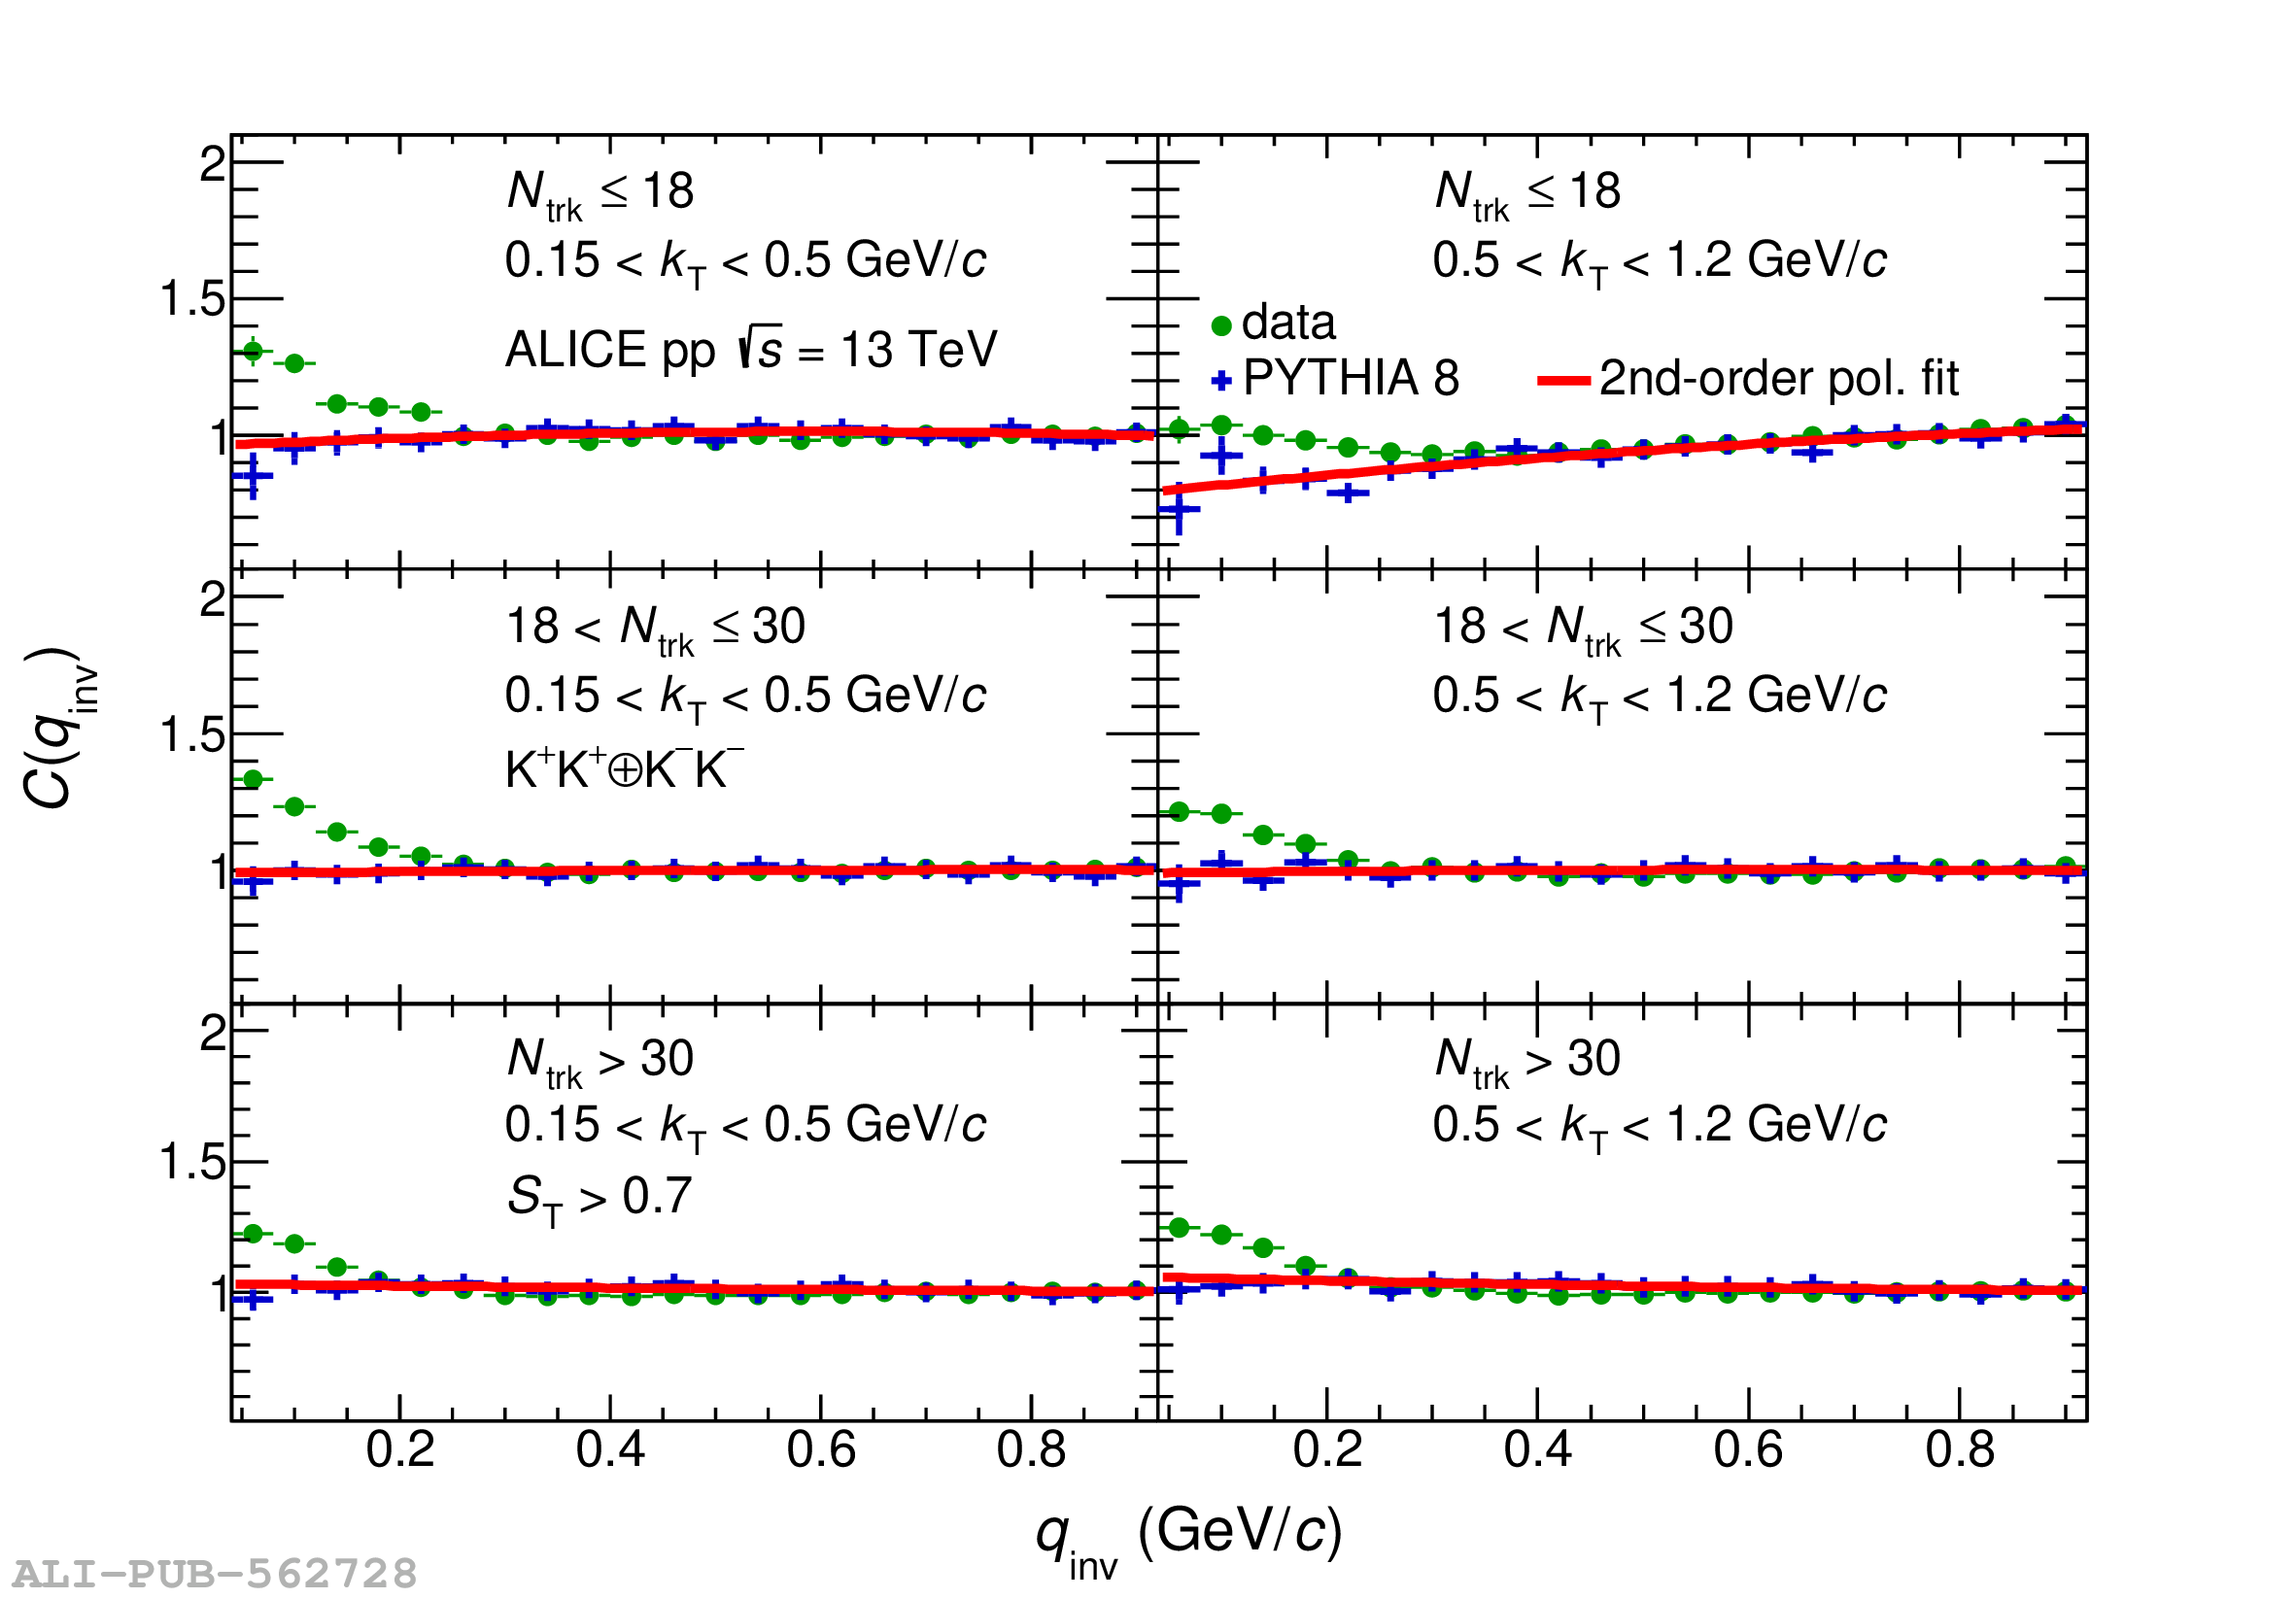 |
Figure 6
The K$^{\pm}$K$^{\pm}$ experimental correlation functions (green solid circles) as function of the invariant pair relative momentum $q_\mathrm{\rm inv}$ in pp collisions at $\sqrt{s}=13$ TeV for the raw multiplicity $N_{\rm trk}$ intervals of (1--18), (19--30), and ($>30$) in the (0.15--0.5) GeV$/c$ and (0.5--1.2) GeV$/c$ $k_{\rm T}$ intervals. A sphericity selection of $S_{\rm T} < 0.3$ is applied. The data are compared with PYTHIA 8 calculations, shown by blue crosses and approximated with a second-order polynomial (red curves). The error bars represent the statistical uncertainties, while the systematic uncertainties are negligible. | 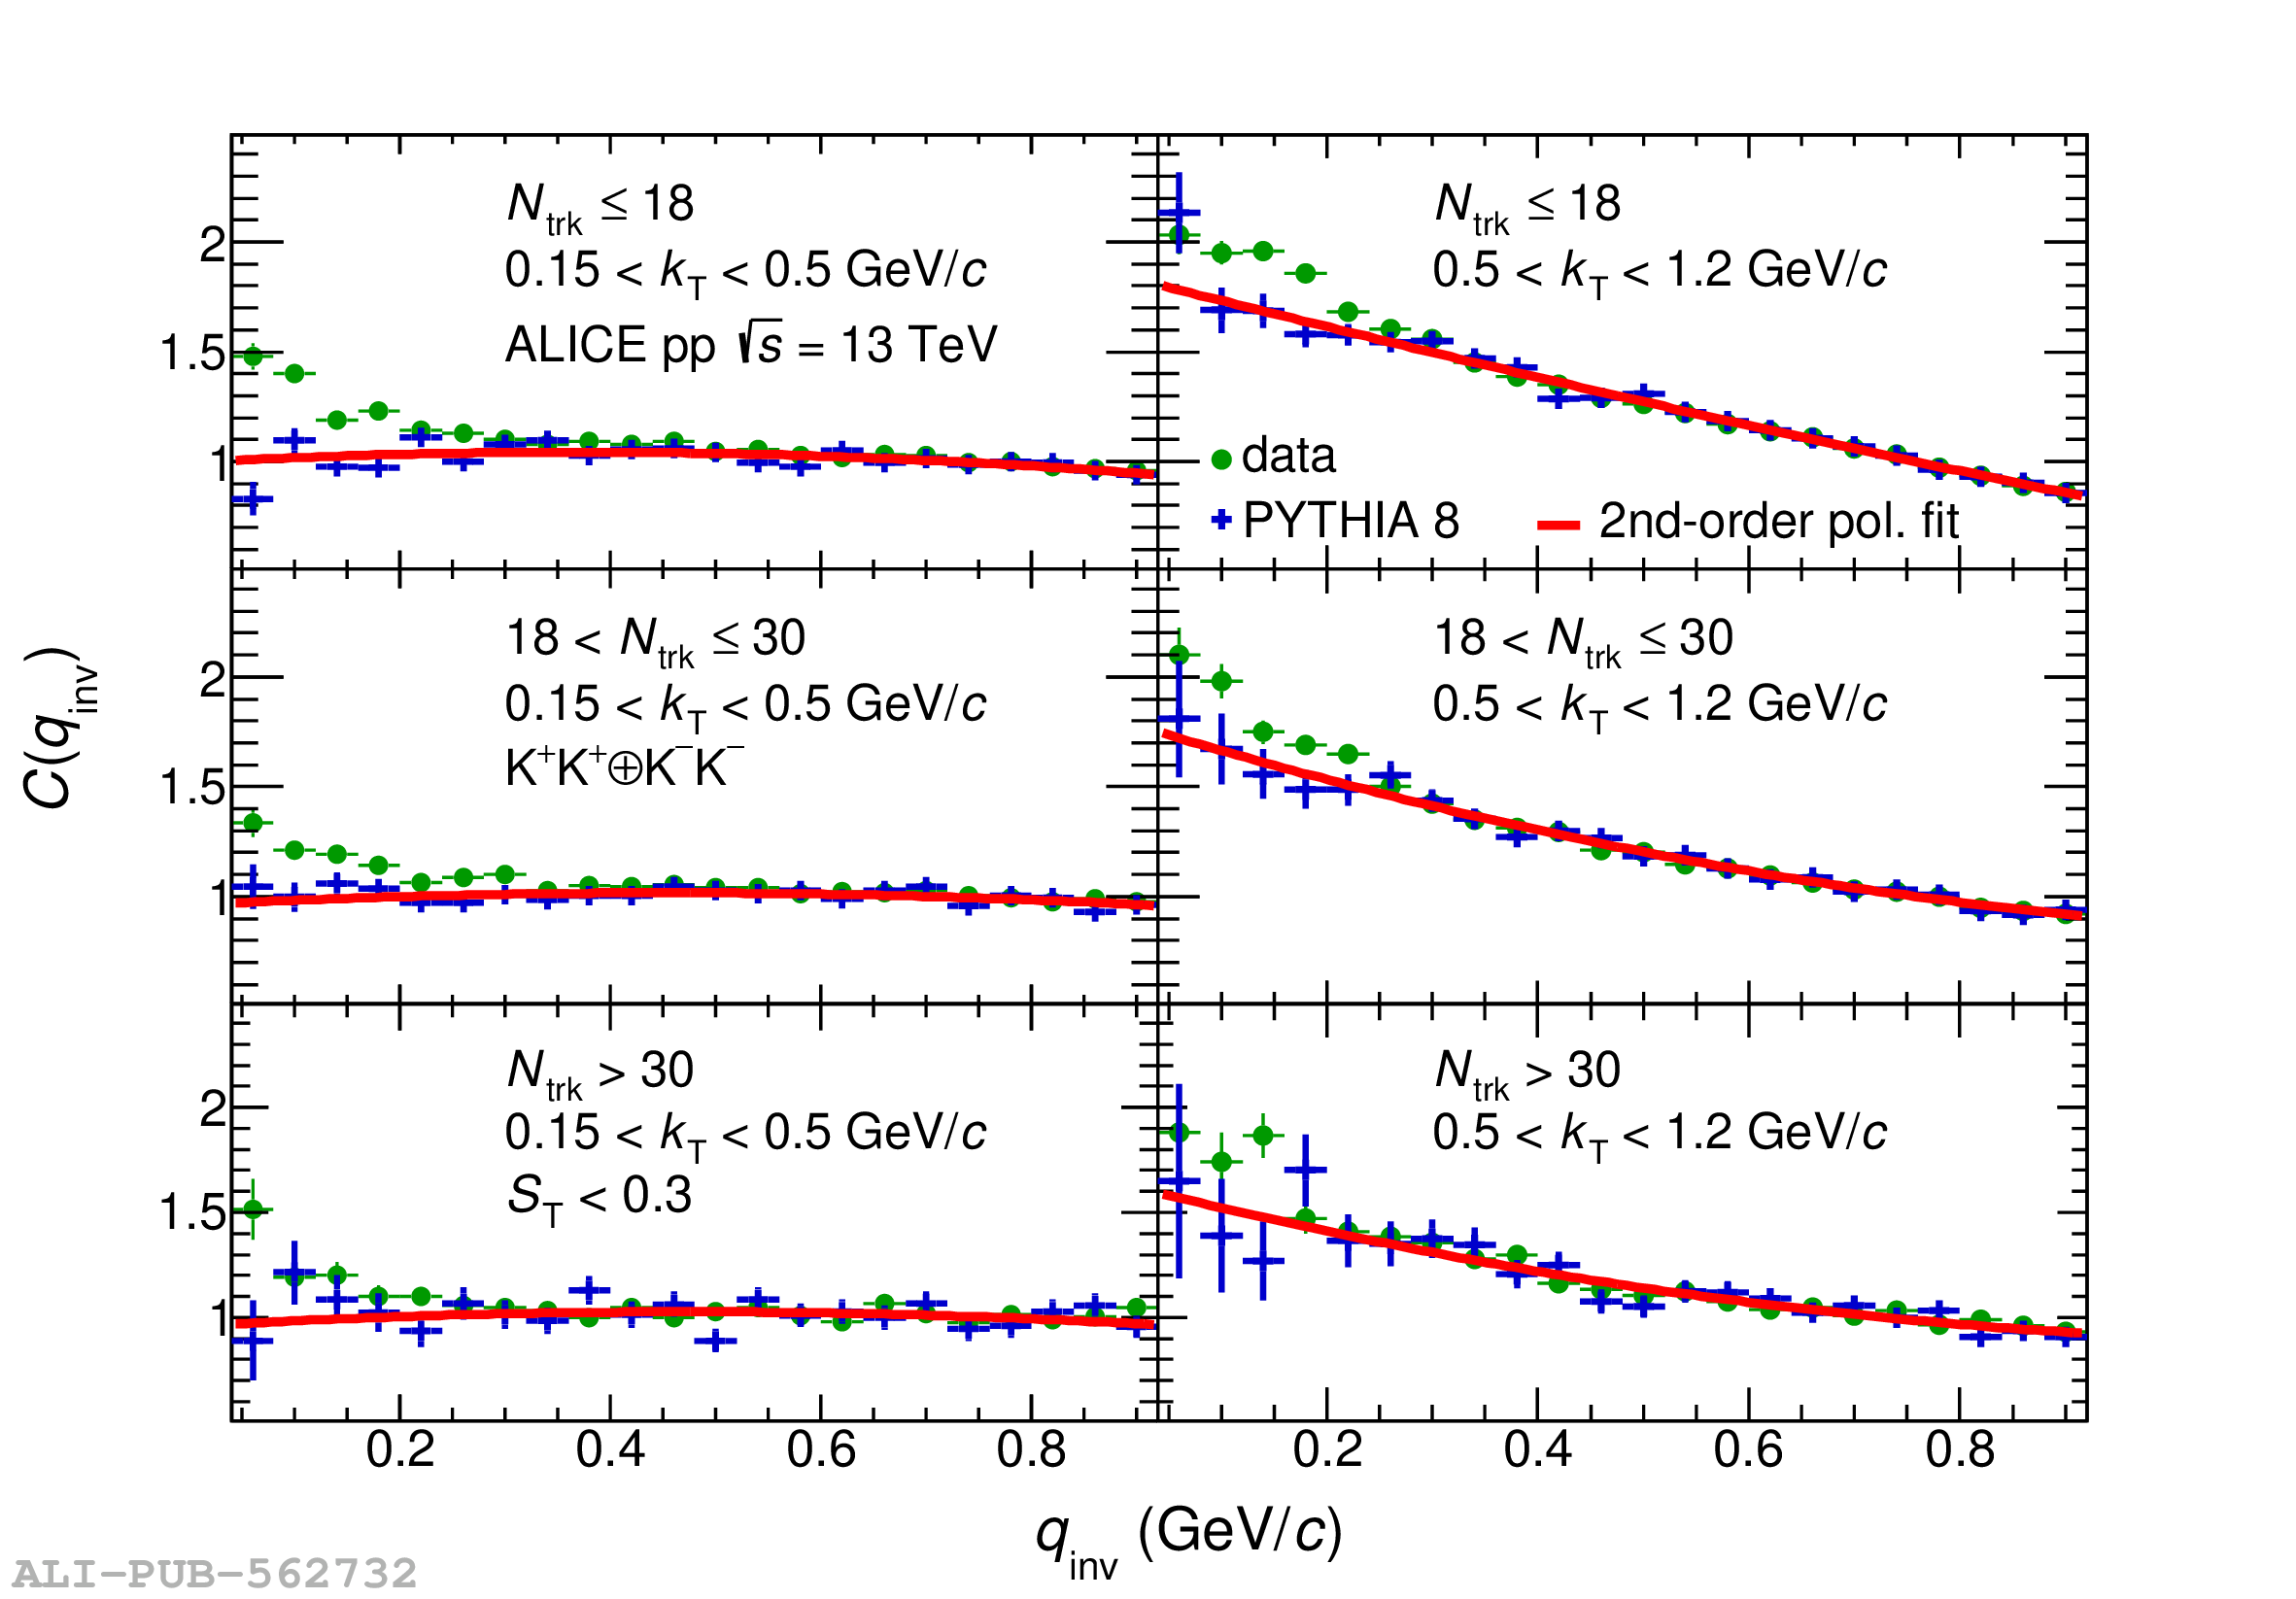 |
Figure 7
Examples of the pion CFs fitted with the Gaussian Eq. (5) (dotted line) and the exponential (solid line) Bowler--Sinyukov Eq. (7) formulas for spherical (left panel) and jet-like (right panel) events Only statistical uncertainties are shown. Systematic uncertainties are negligible. | 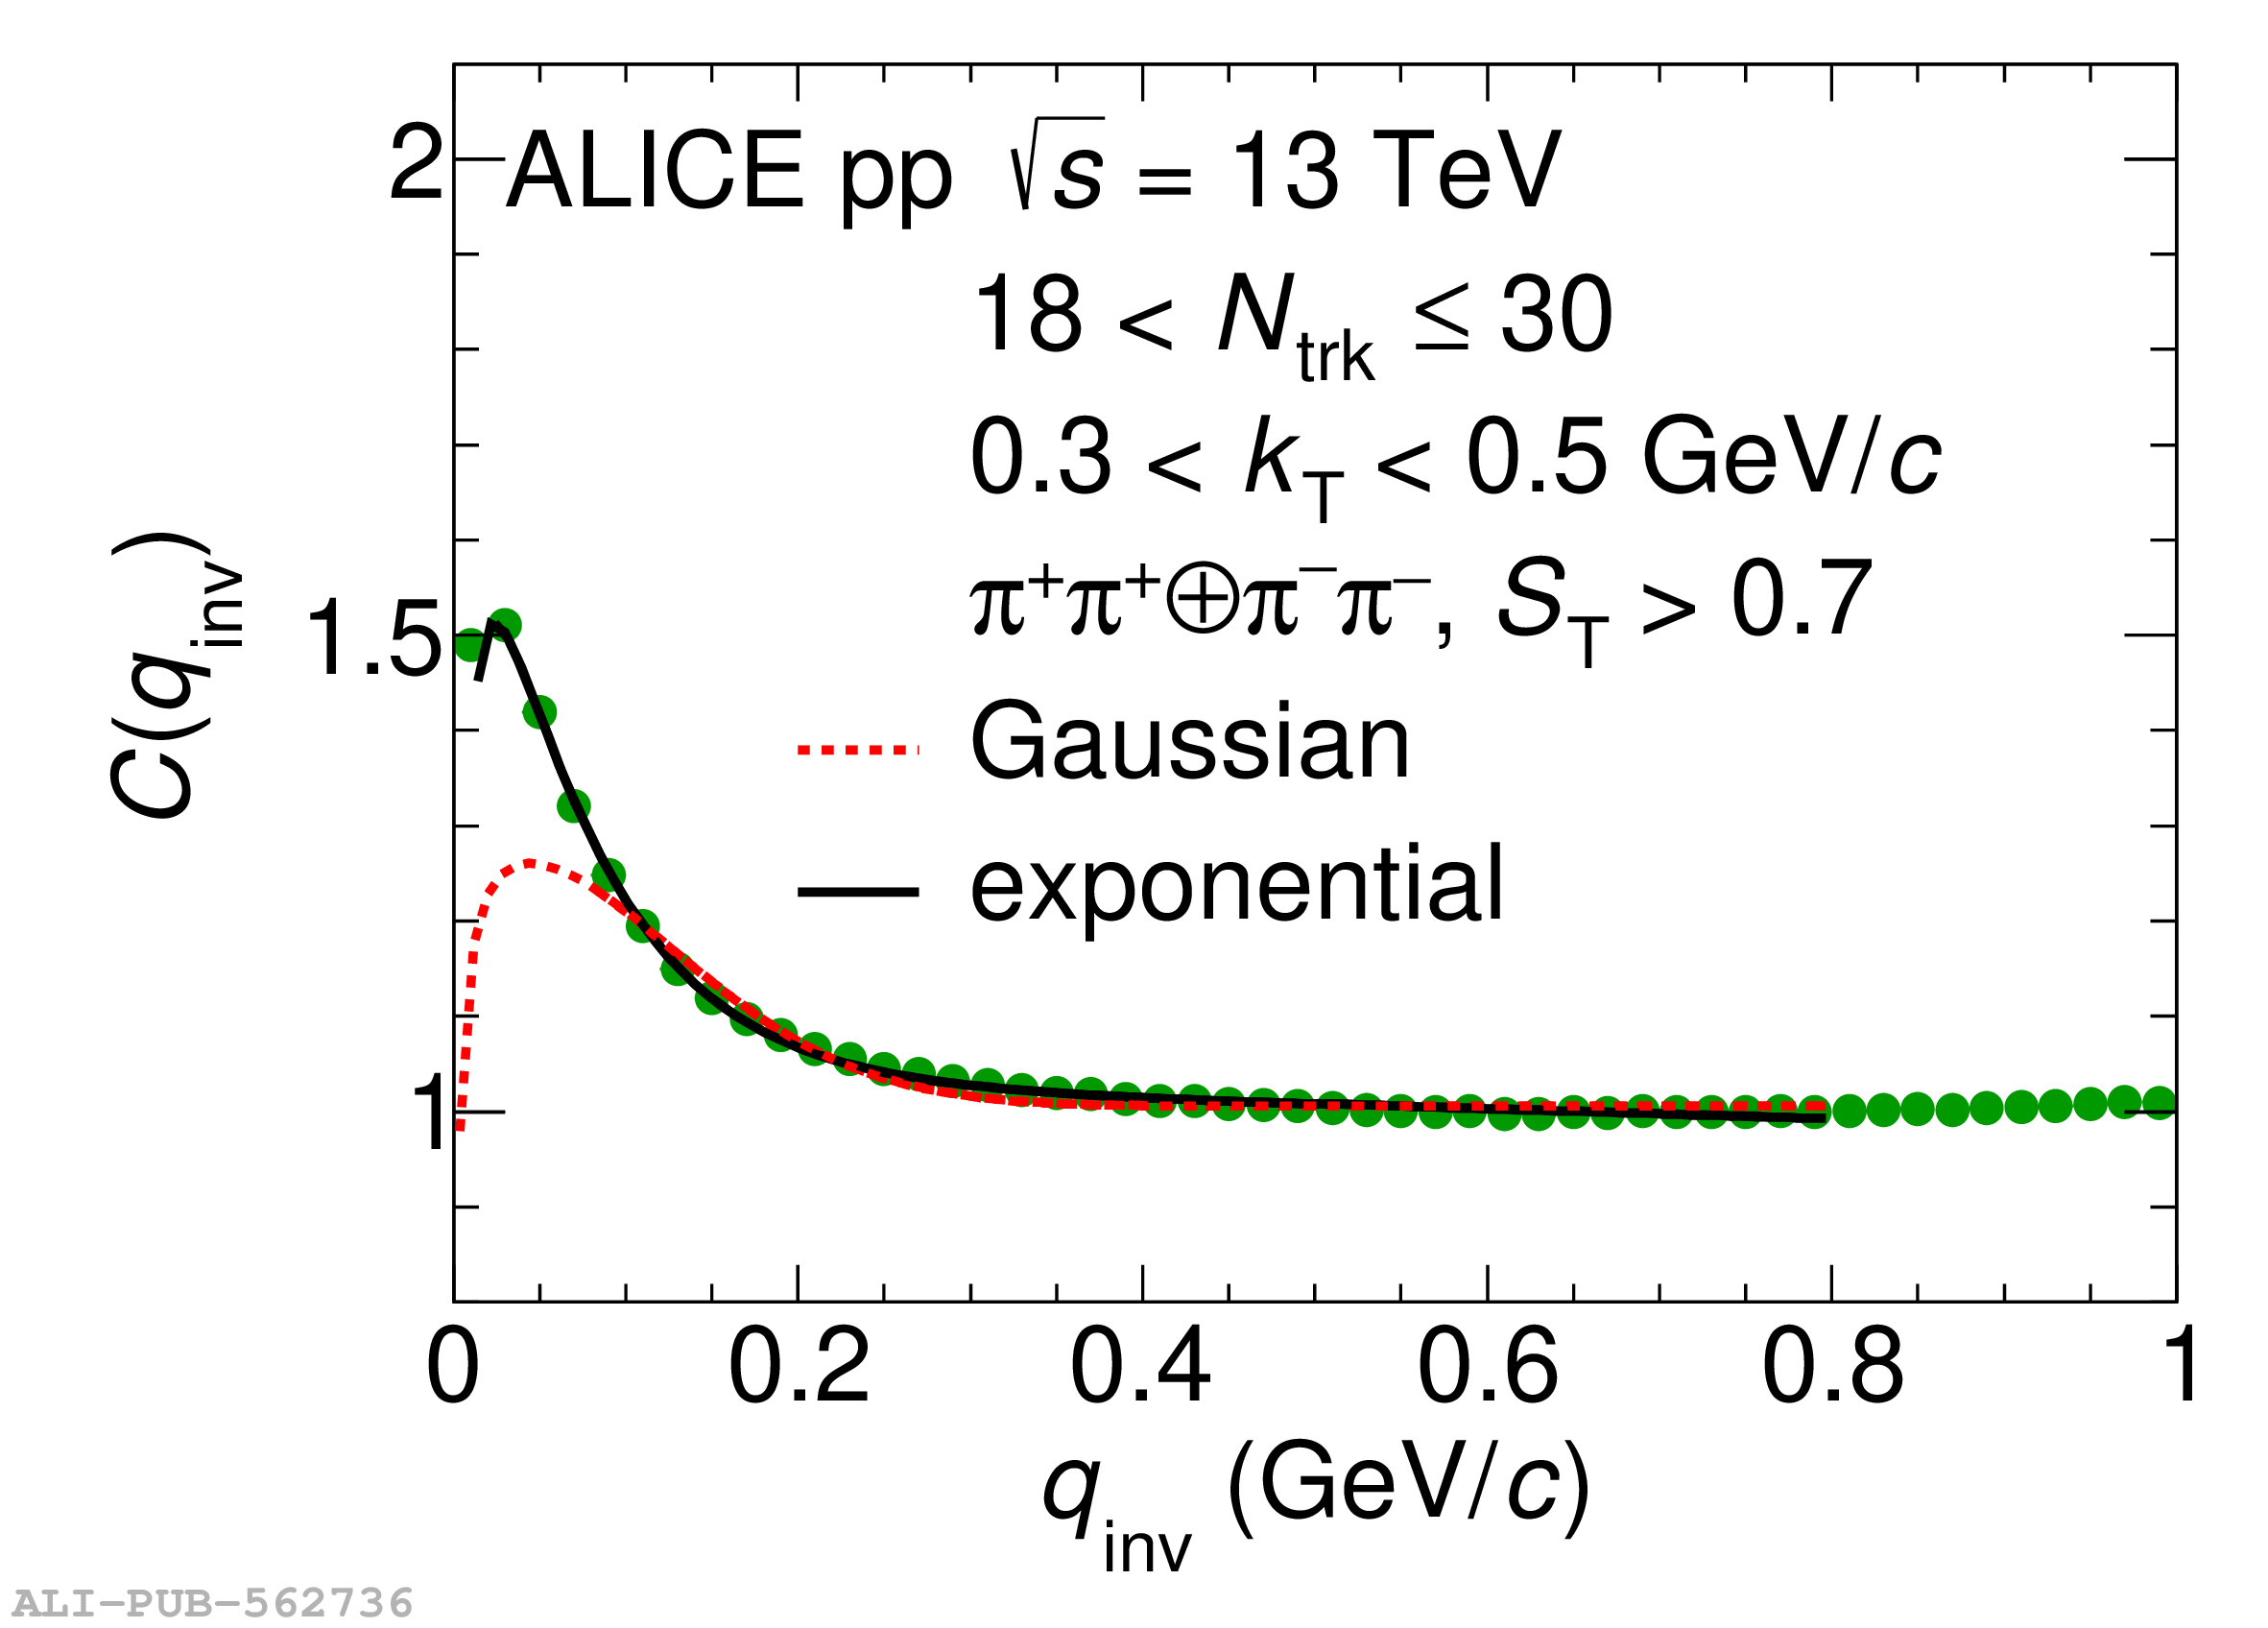 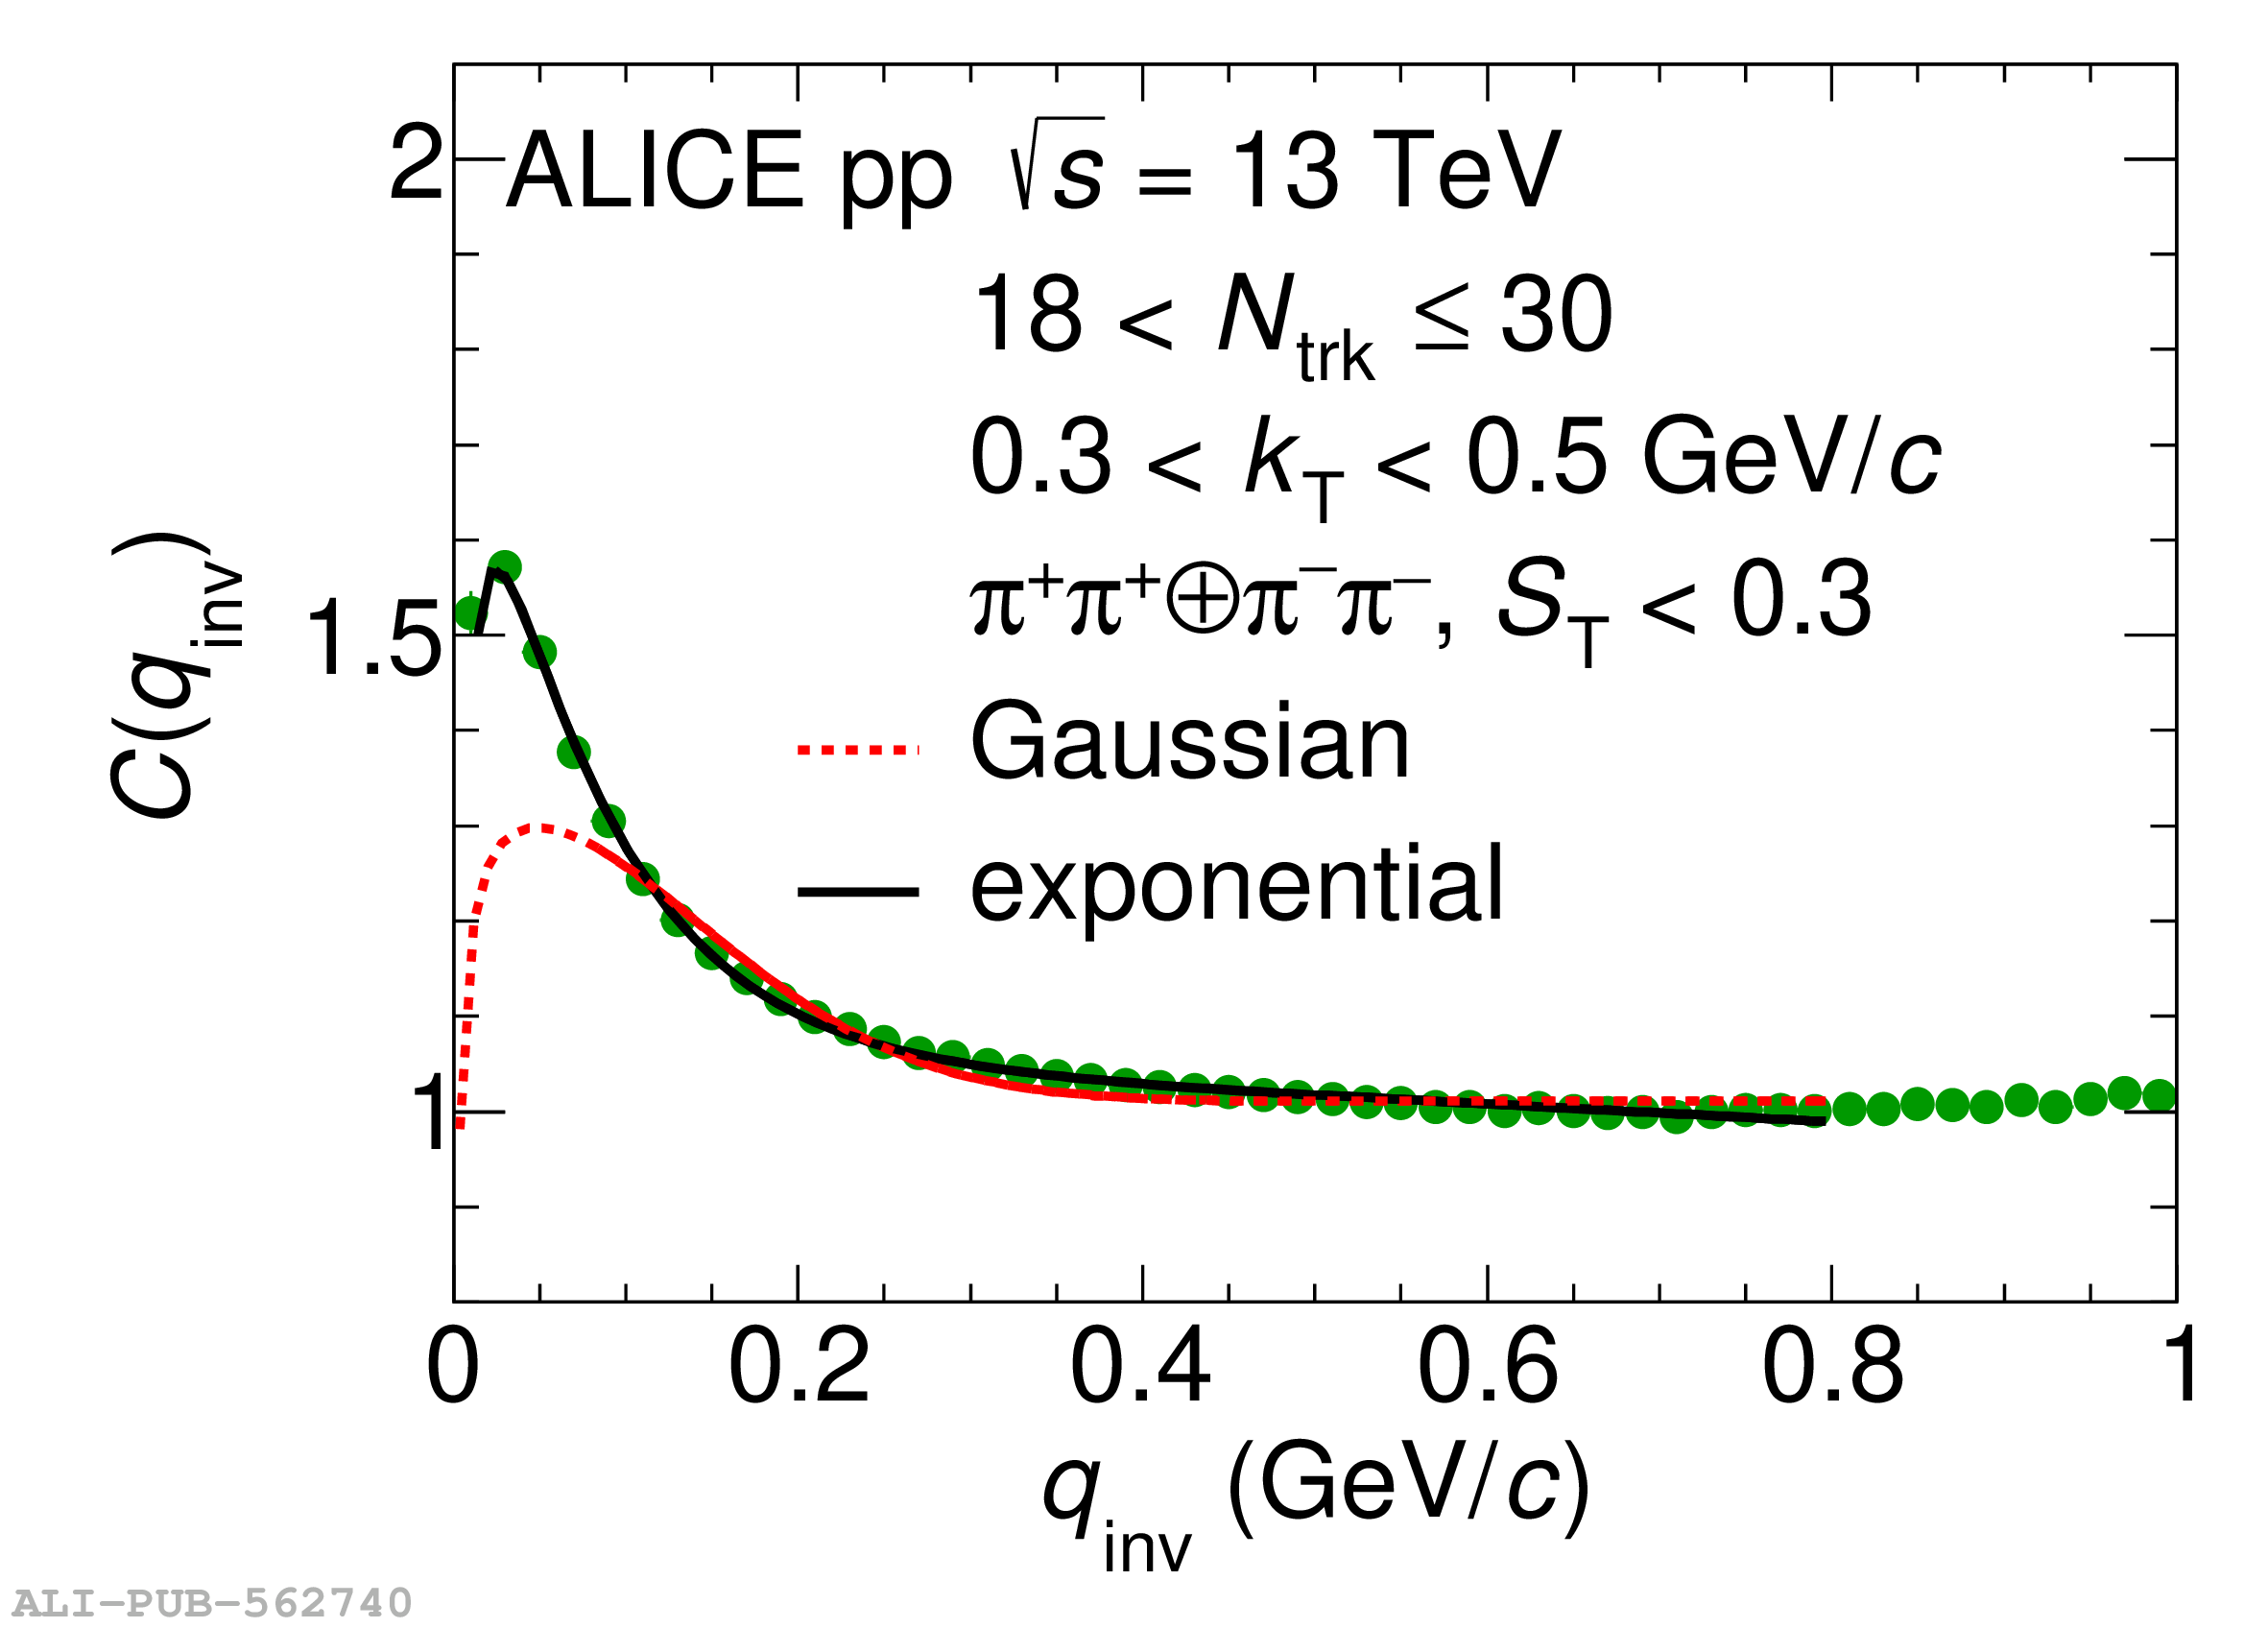 |
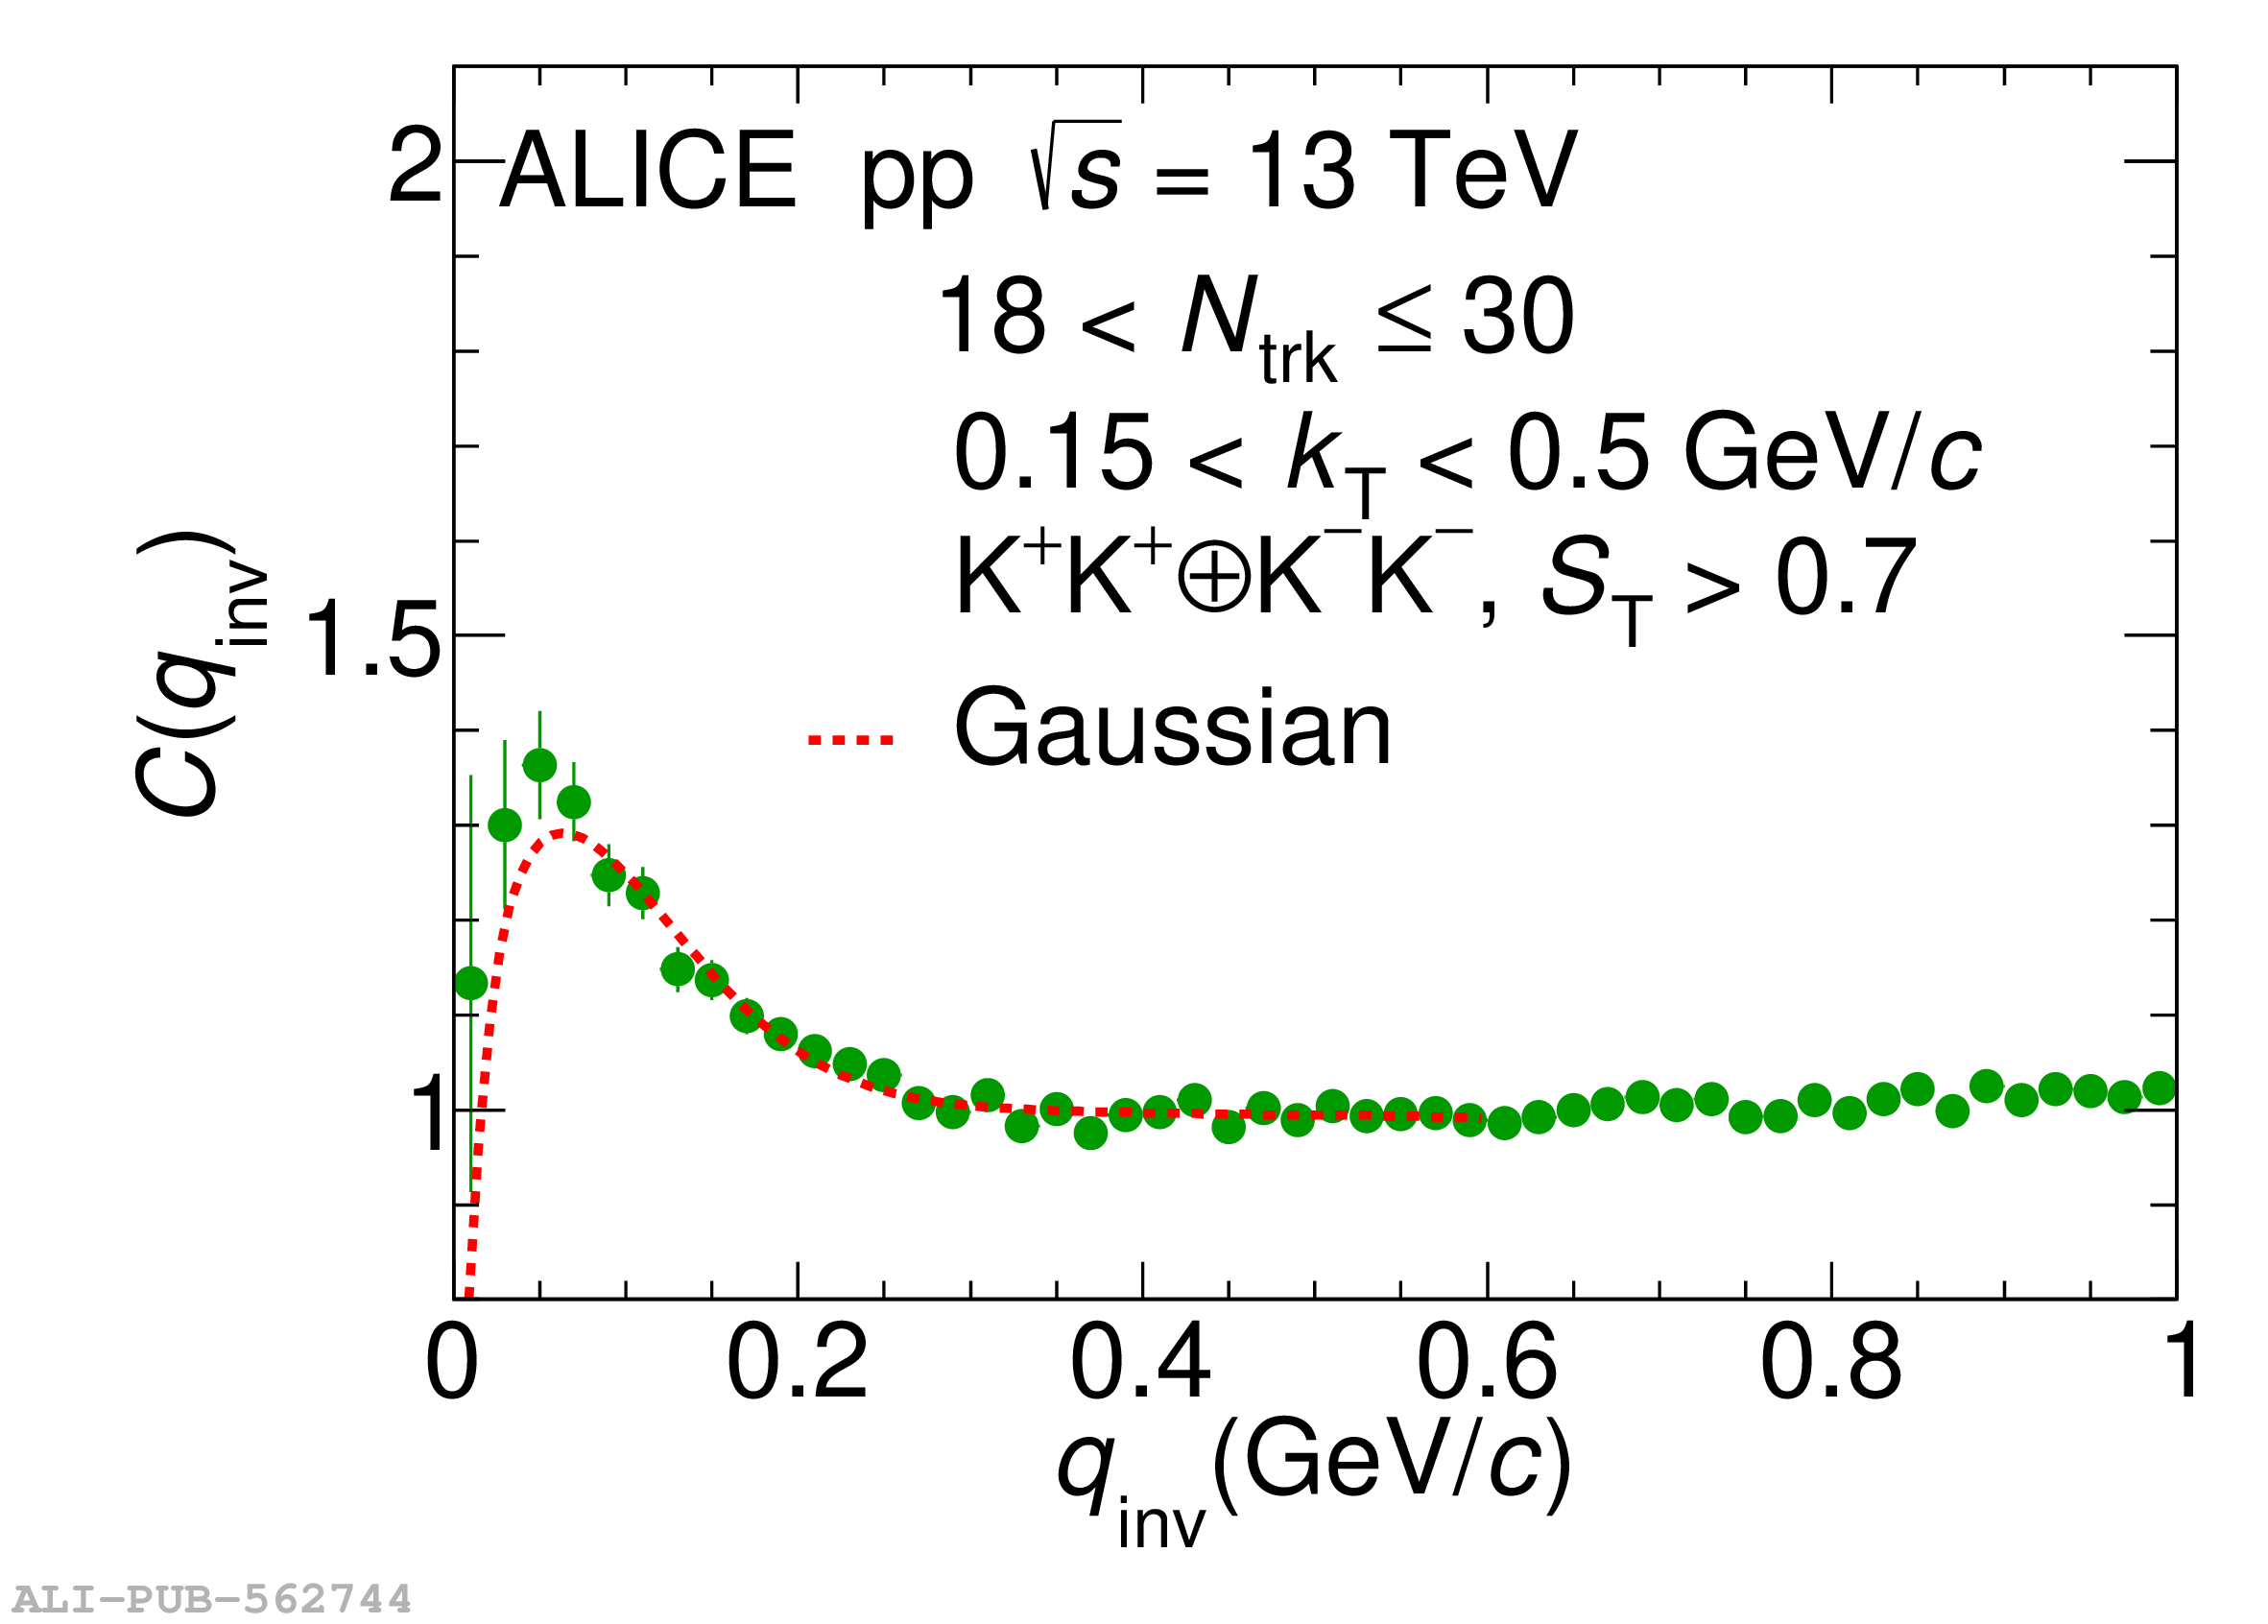
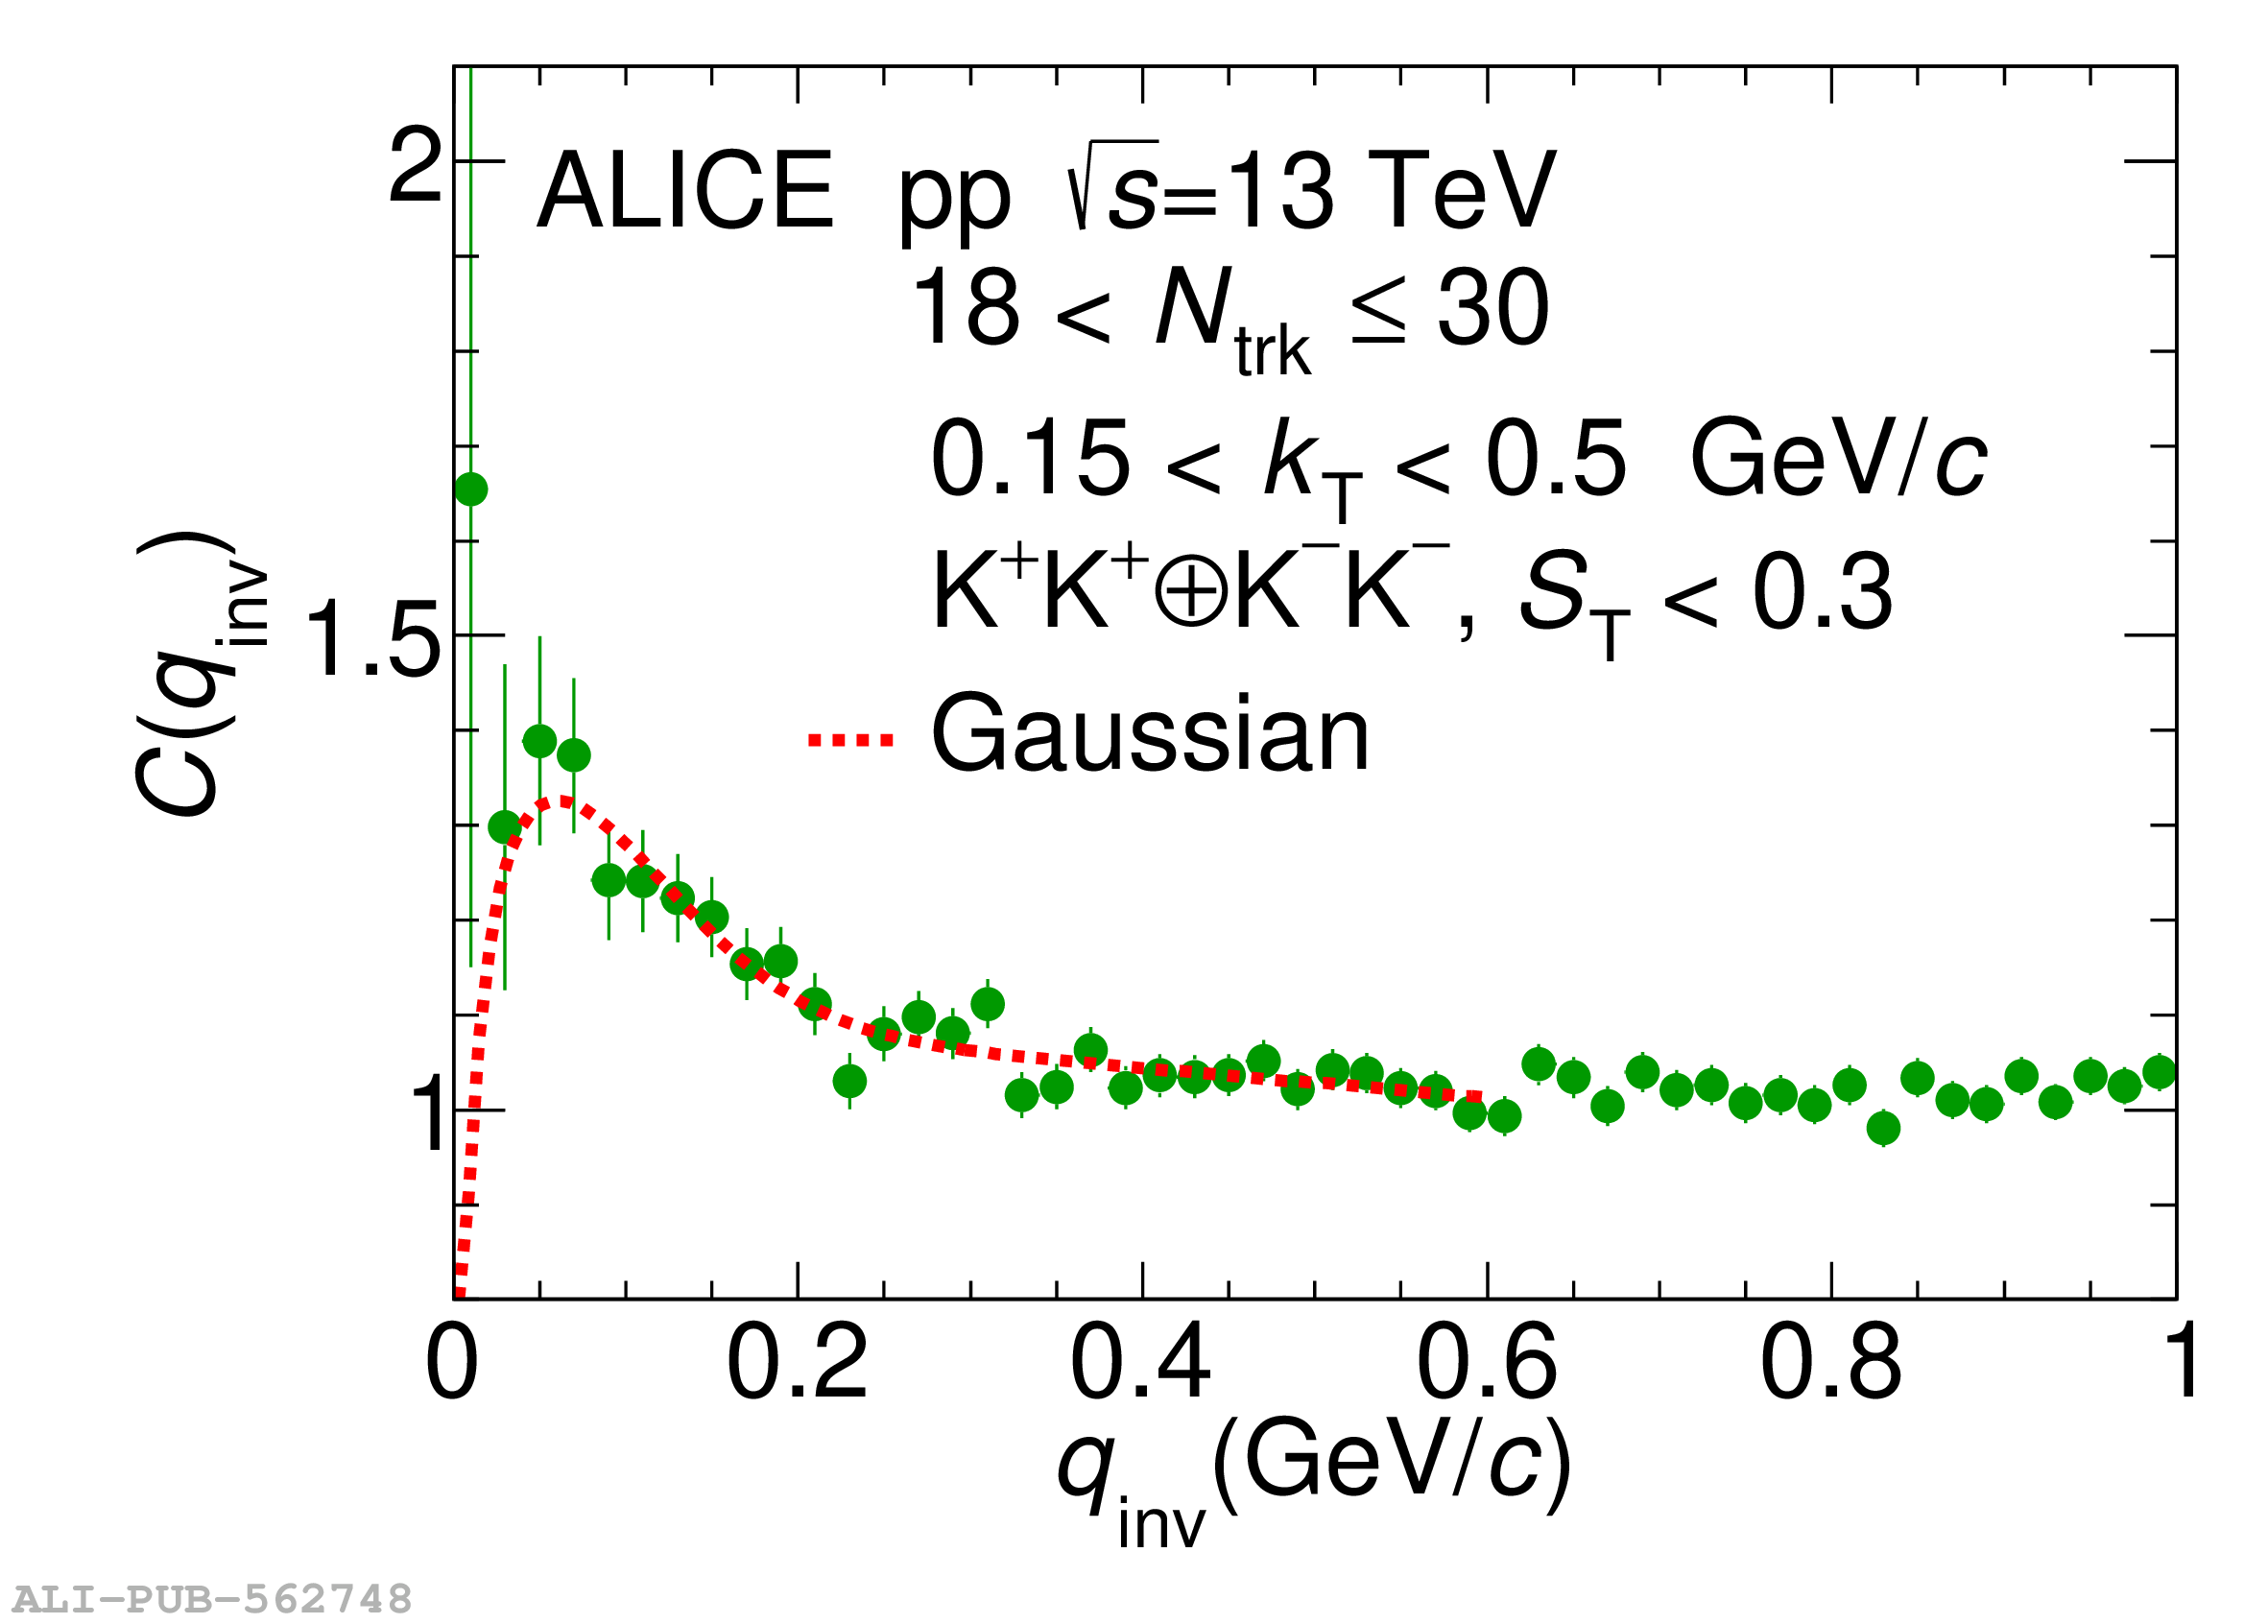
Figure 9
The Gaussian pion (blue circles) and kaon (green crosses) radii for spherical ($S_{\rm T}>0.7$) and jet-like ($S_{\rm T}<0.3$) events as function of the average pair transverse mass $m_{\rm T}$ for different multiplicity intervals. The lines approximating the pion and kaon radii by the linear function of Eq. (10) are shown for spherical events by dotted blue and green lines, respectively, and for jet-like events by dotted-dashed lines. The lines for combined fit for pion and kaon points are shown by black solid and dashed lines for spherical and jet-like events, respectively. Statistical (bars) and systematic (boxes) uncertainties are shown. | 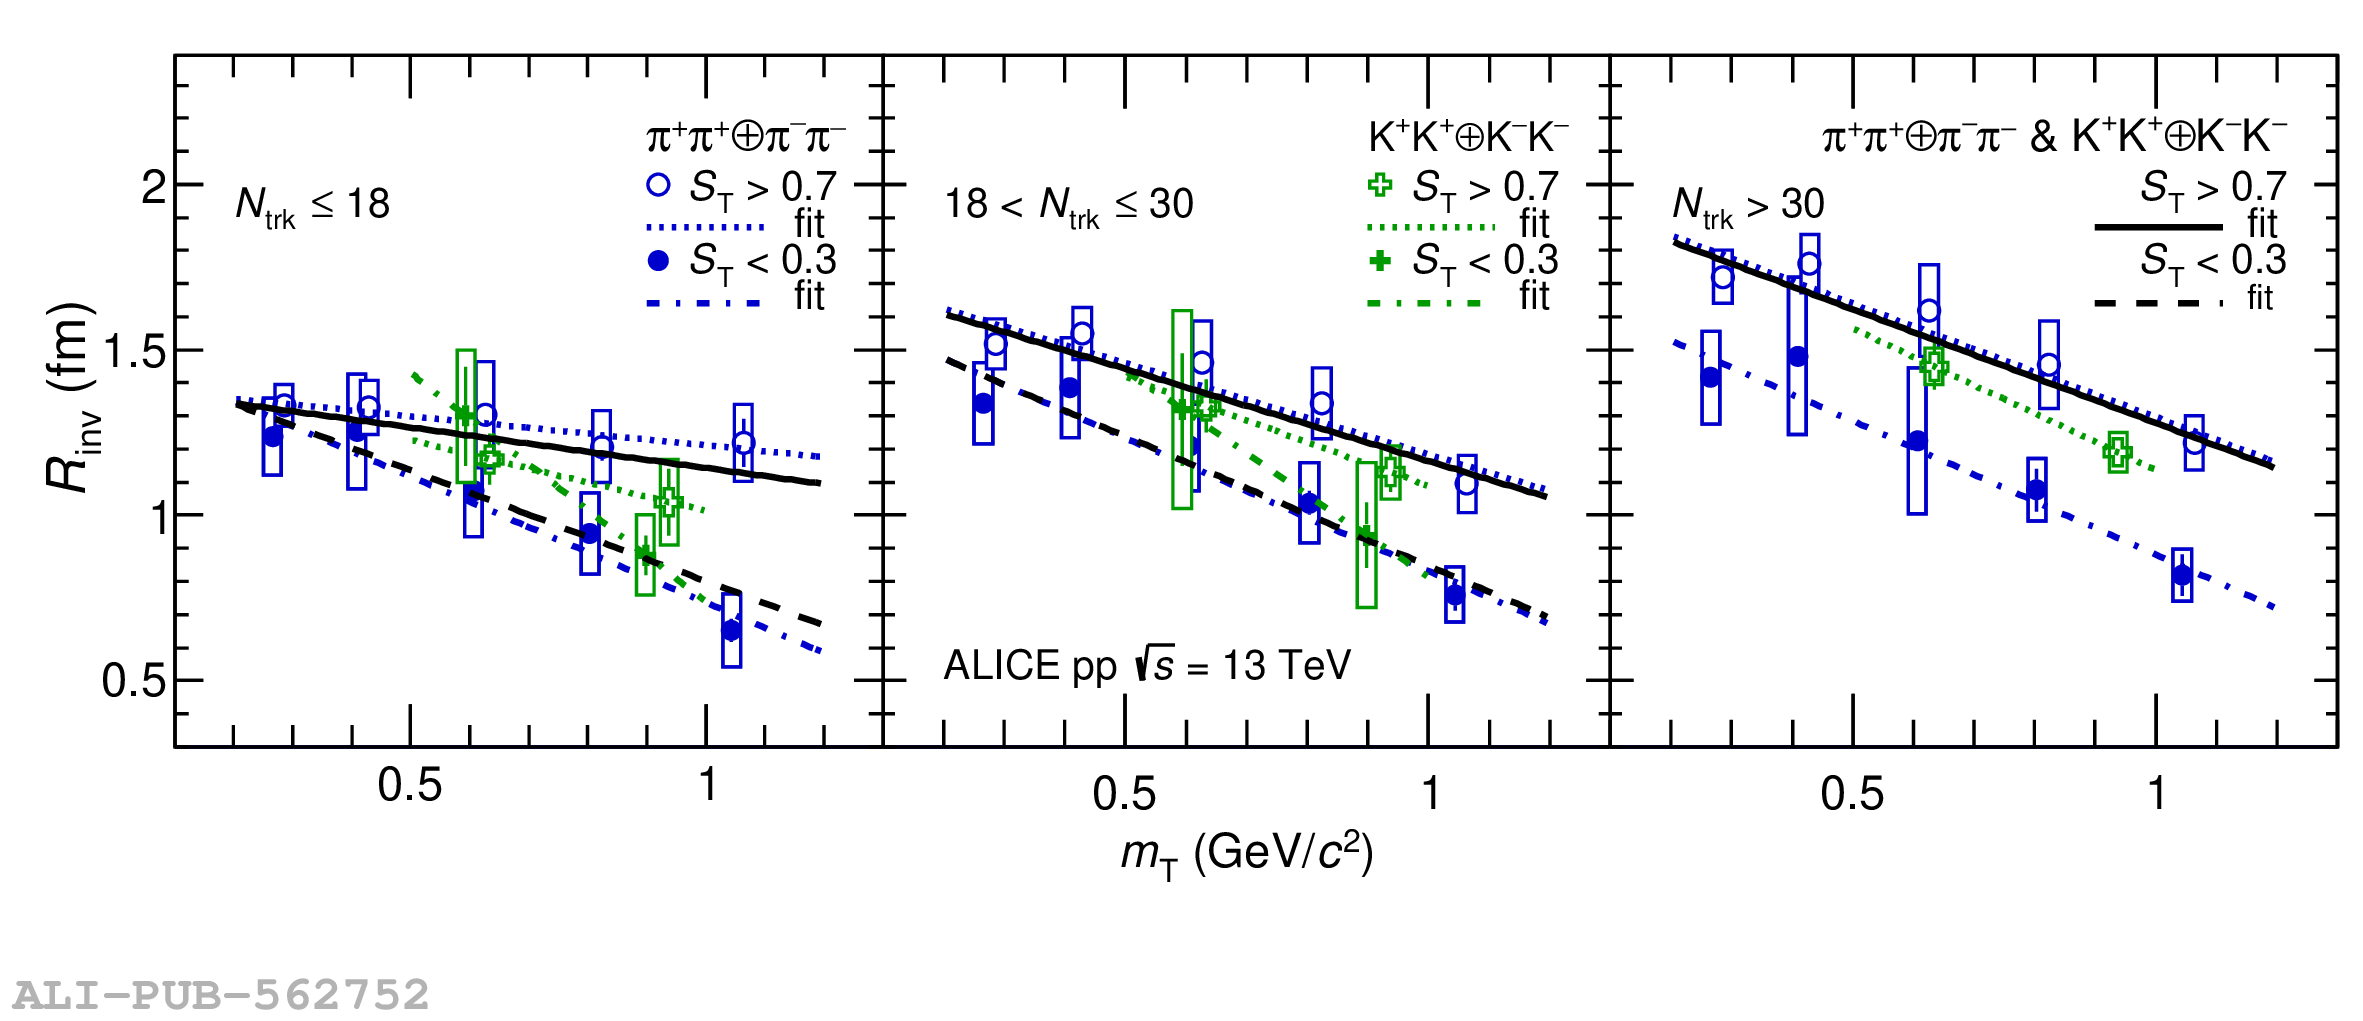 |
Figure 10
The Gaussian pion (blue circles) and kaon (green crosses) radii for spherical ($S_{\rm T}>0.7$) and jet-like ($S_{\rm T}<0.3$) events corrected for the Lorenz boost with factor in Eq. (11) as function of the average pair transverse mass $m_{\rm T}$ for different multiplicity intervals. The lines approximating the pion and kaon radii by the linear function of Eq. (10) are shown for spherical events by dotted blue and green lines, respectively, and for jet-like events by dotted-dashed lines. The lines for combined fit for pion and kaon points are shown by black solid and dashed lines for spherical and jet-like events, respectively. Statistical (bars) and systematic (boxes) uncertainties are shown. | 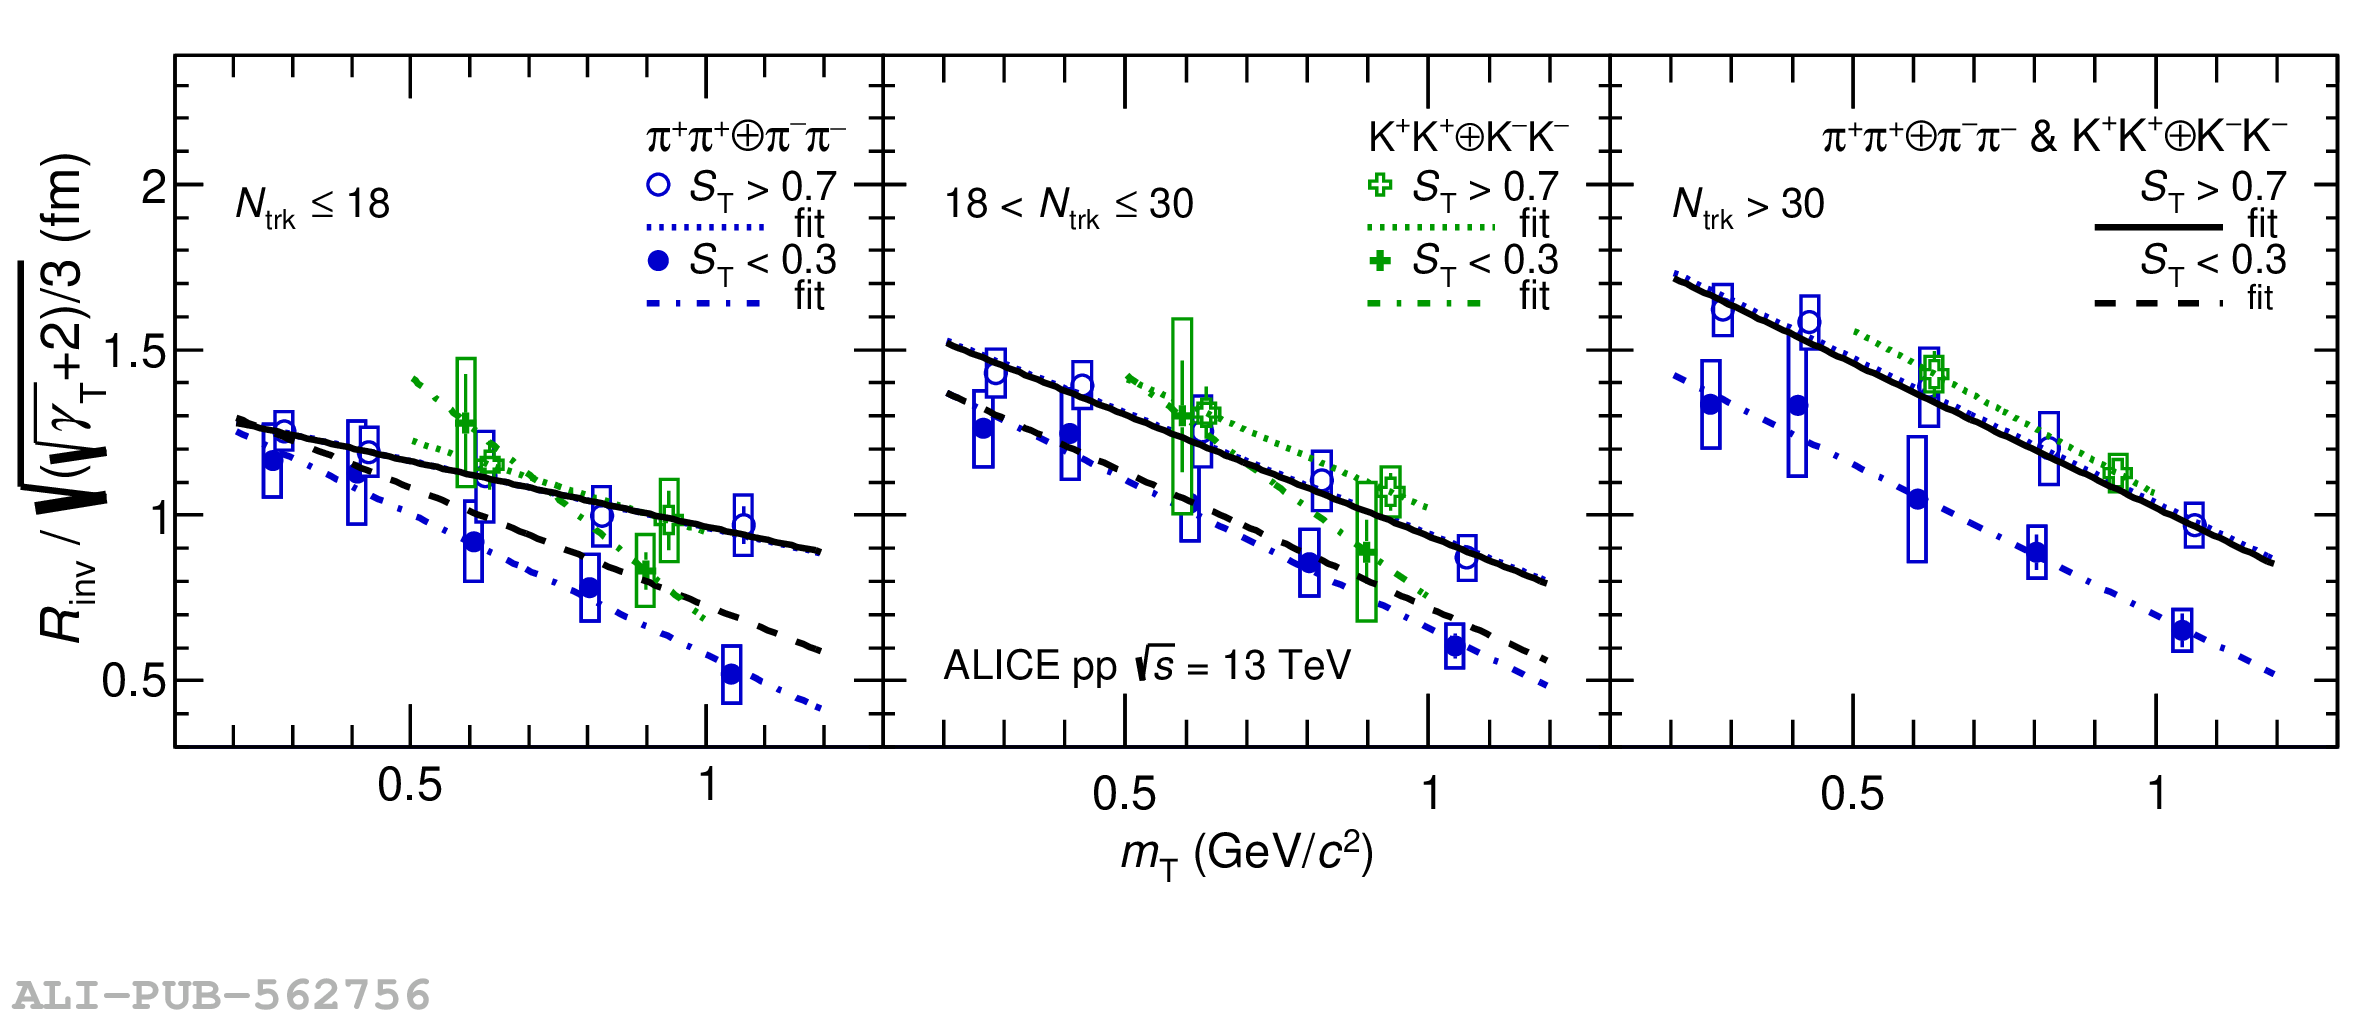 |
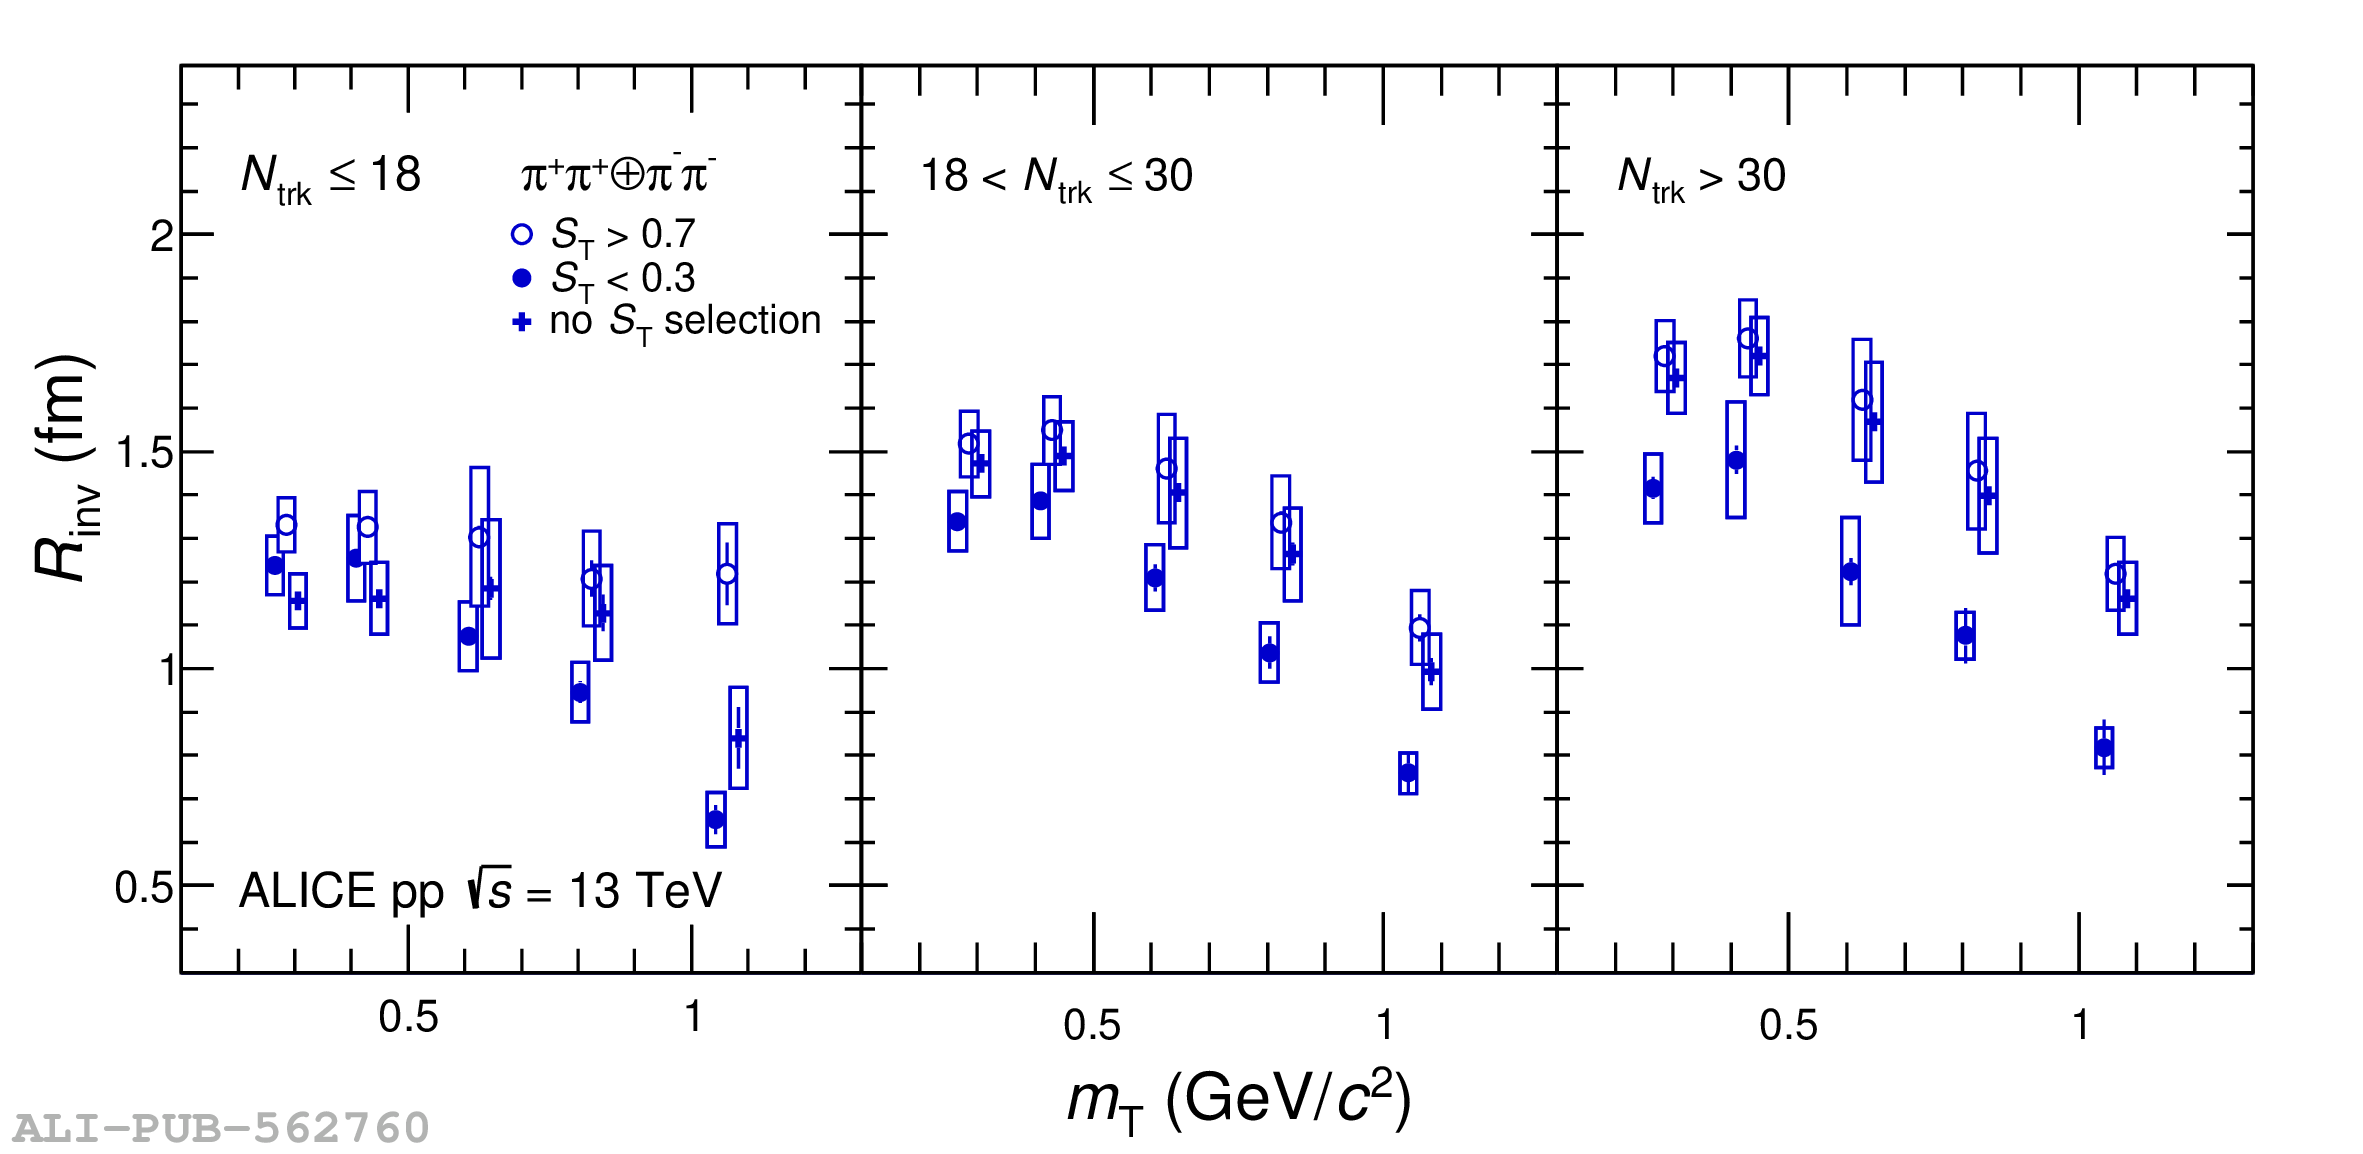
Figure 12
The Gaussian pion and kaon $\lambda$ parameters for spherical (left panel) and jet-like (right panel) events as a function of the average pair transverse mass $m_{\rm T}$ for different multiplicity intervals. The $\lambda$ parameters are corrected for purity. Statistical (bars) and systematic (boxes) uncertainties are shown. | 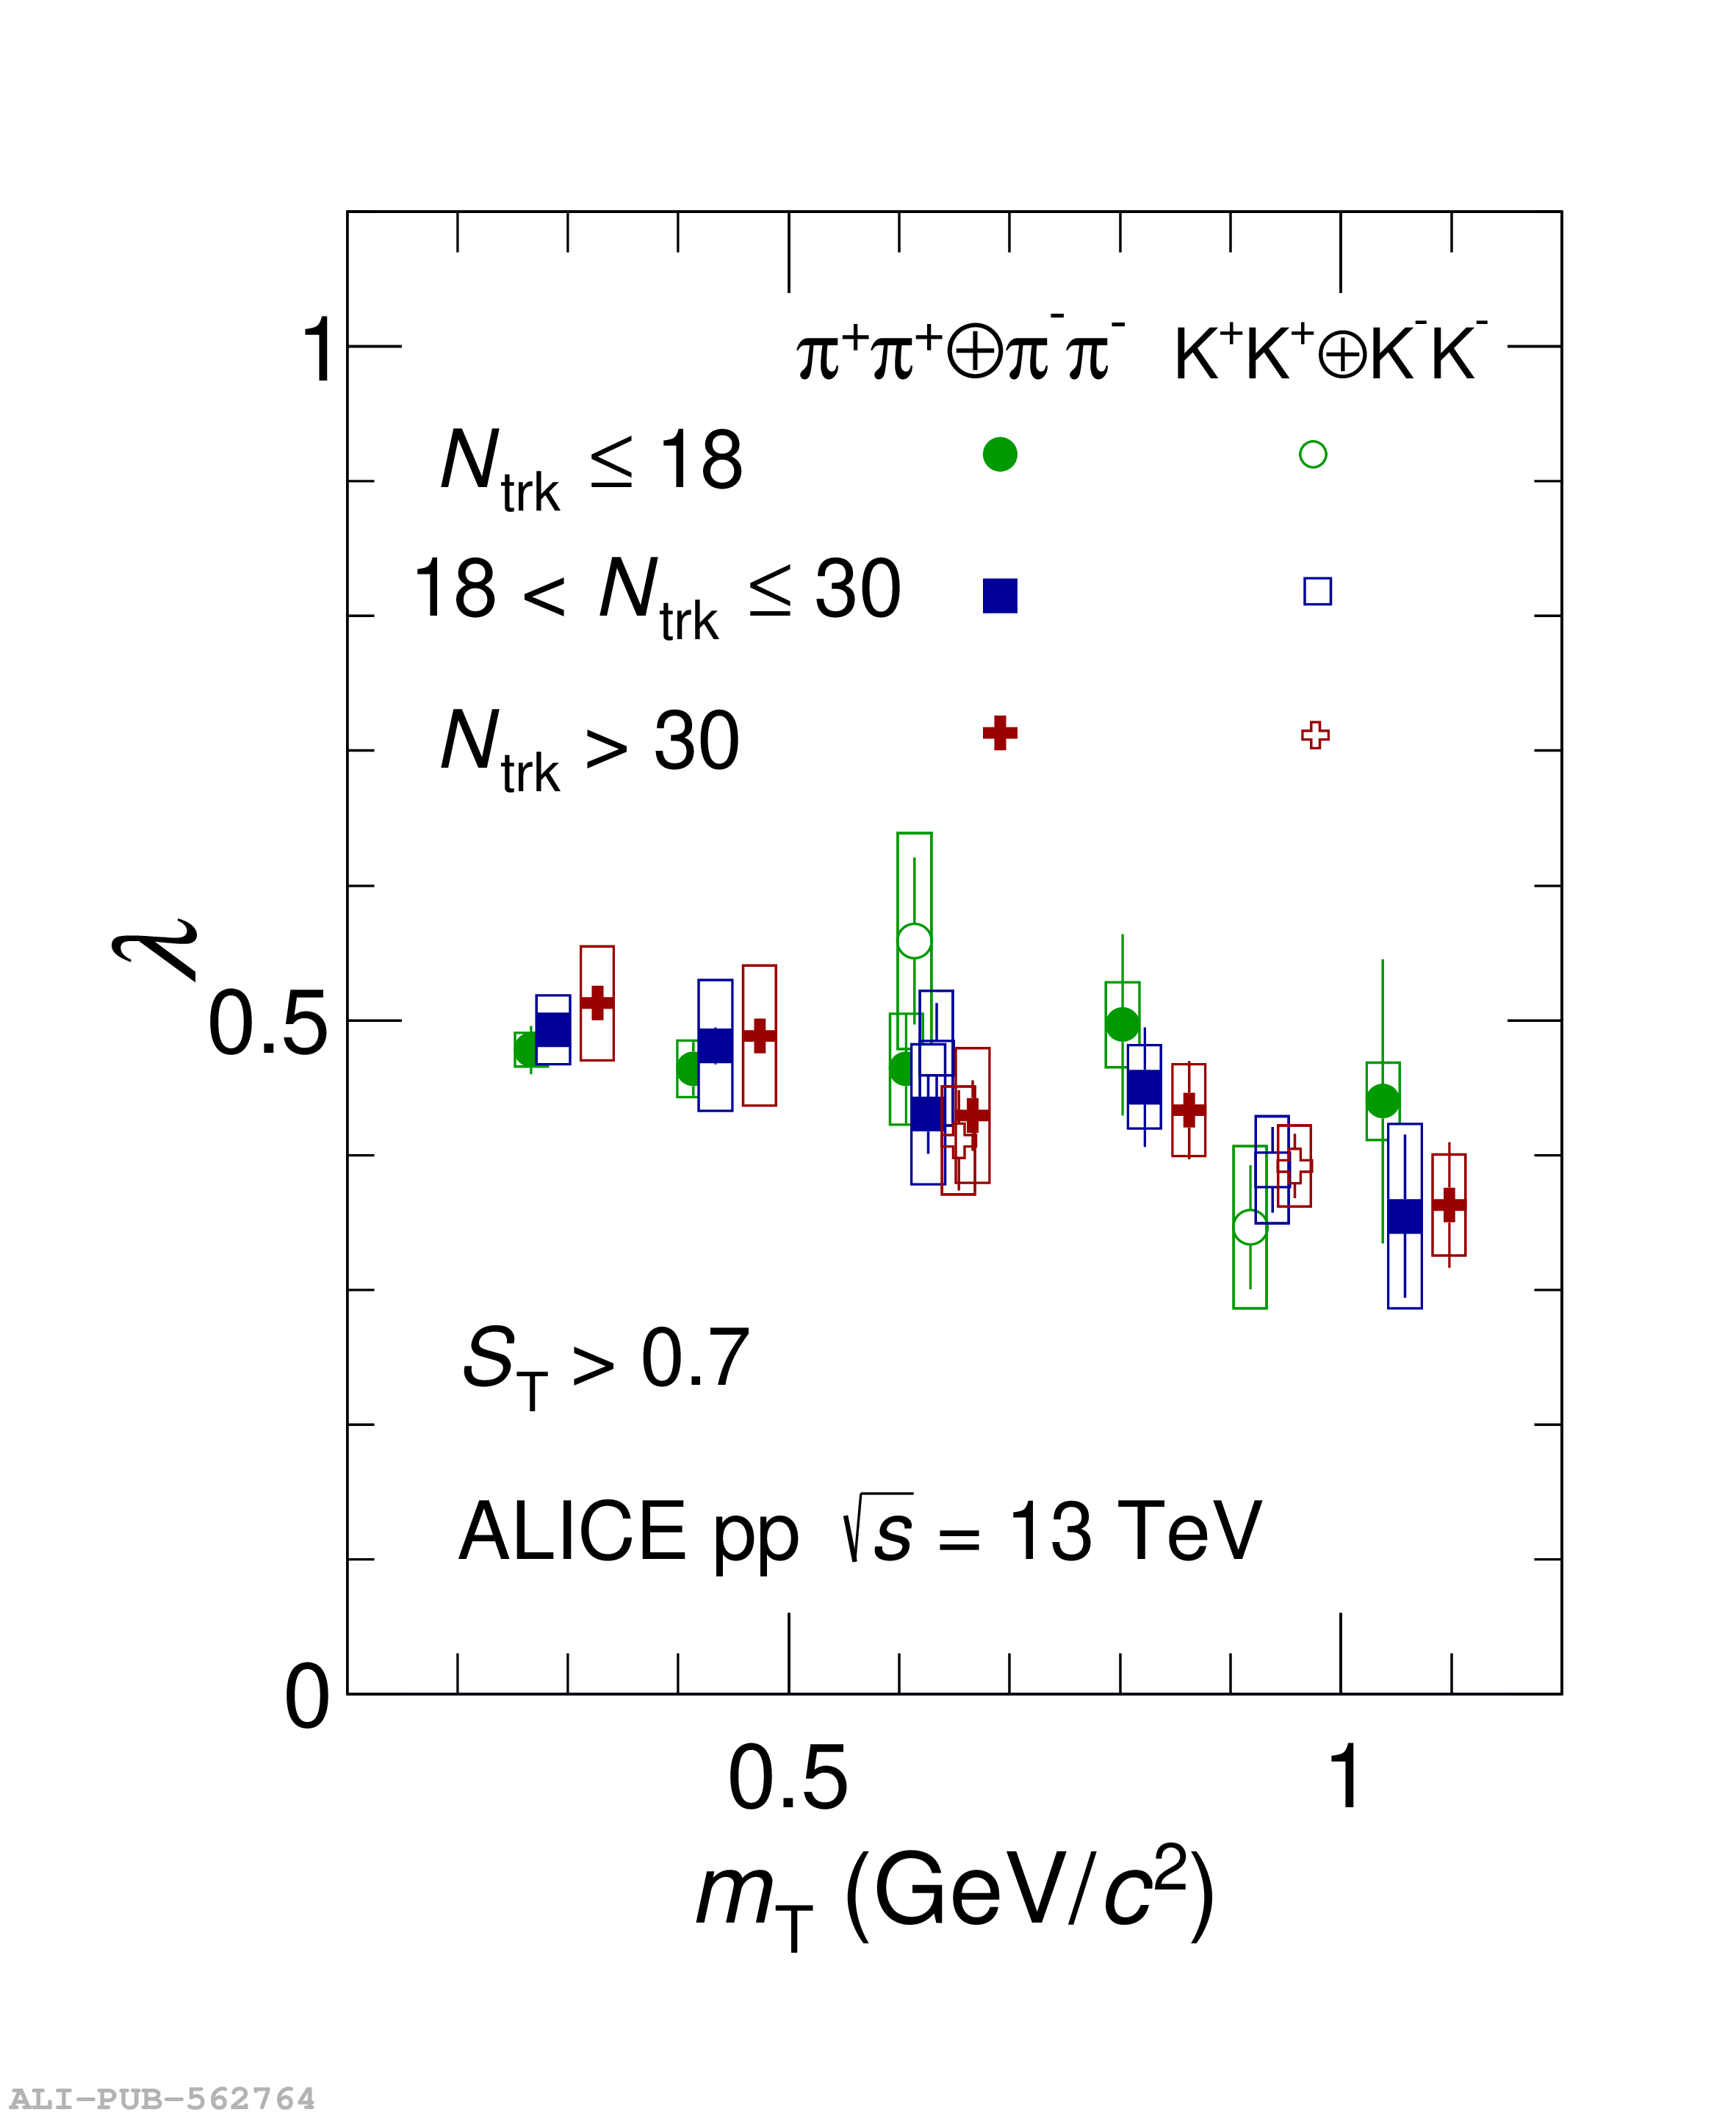 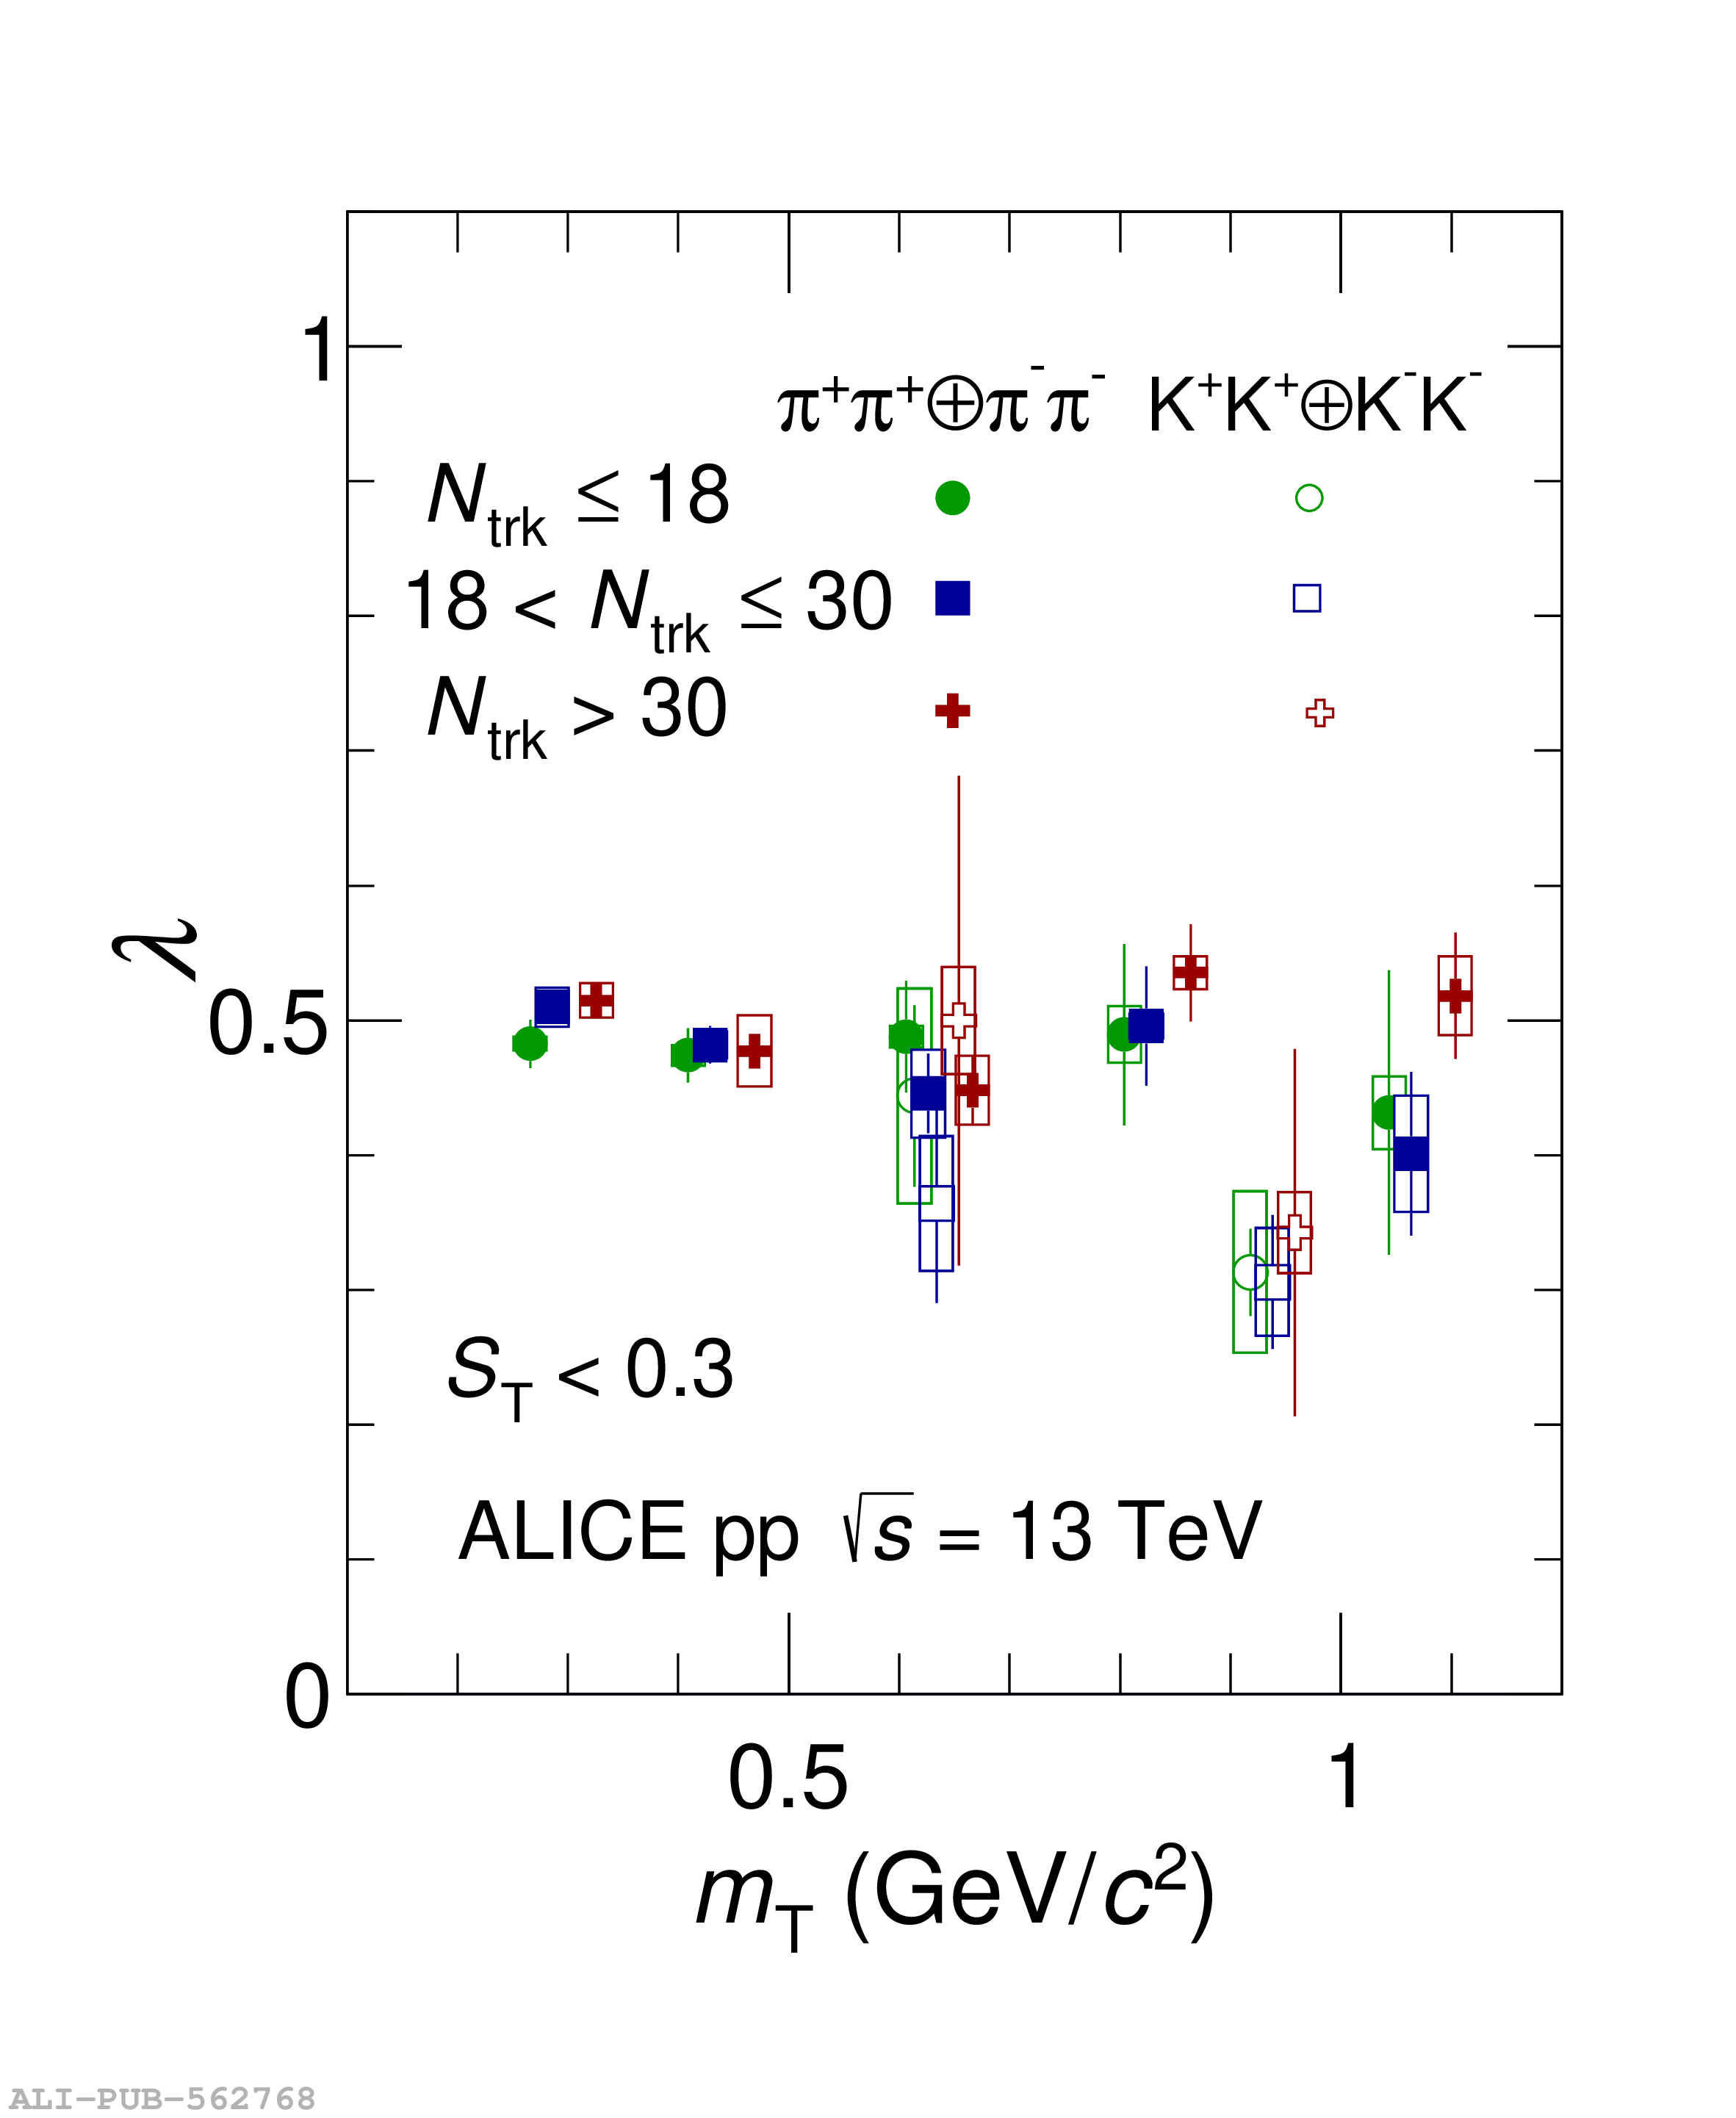 |