The production of J/$\psi$ is measured as a function of charged-particle multiplicity at forward rapidity in proton$-$proton (pp) collisions at center-of-mass energies $\sqrt{s} =$ 5.02 and 13 TeV. The J/$\psi$ mesons are reconstructed via their decay into dimuons in the rapidity interval (2.5 $<~ y <~$ 4.0), whereas the charged-particle multiplicity density (${\rm d}N_{\rm{ch}}/{\rm d}\eta$) is measured at midrapidity $(|\eta| <~ 1)$. The production rate as a function of multiplicity is reported as the ratio of the yield in a given multiplicity interval to the multiplicity-integrated one. This observable shows a linear increase with charged-particle multiplicity normalized to the corresponding average value for inelastic events (${{\rm d}N_{\rm ch}/{\rm d}\eta}/{\langle {\rm d}N_{\rm ch}/{\rm d}\eta \rangle}$), at both the colliding energies. Measurements are compared with available ALICE results at midrapidity and theoretical model calculations. First measurement of the mean transverse momentum ($\langle p_{\mathrm{T}}\rangle$) of J/$\psi$ in pp collisions exhibits an increasing trend as a function of ${{\rm d}N_{\rm ch}/{\rm d}\eta}/{\langle {\rm d}N_{\rm ch}/{\rm d}\eta \rangle}$ showing a saturation towards high charged-particle multiplicities.
JHEP 06 (2022) 015
HEP Data
e-Print: arXiv:2112.09433 | PDF | inSPIRE
CERN-EP-2021-268
Figure 1
\footnotesize{Dimuon invariant mass distribution in the lowest (top panels) and highest (bottom panels) \Ntrkcorr intervals in \pp collisions at $\sqrt{s} =$ 5.02 (left) and $\sqrt{s} = 13$ TeV (right). Example fit functions are shown by lines for \jpsi, $\psi(2\rm S)$ signal, background and the combination of signal with background. The data points with error bars are represented by scattered points.}. | 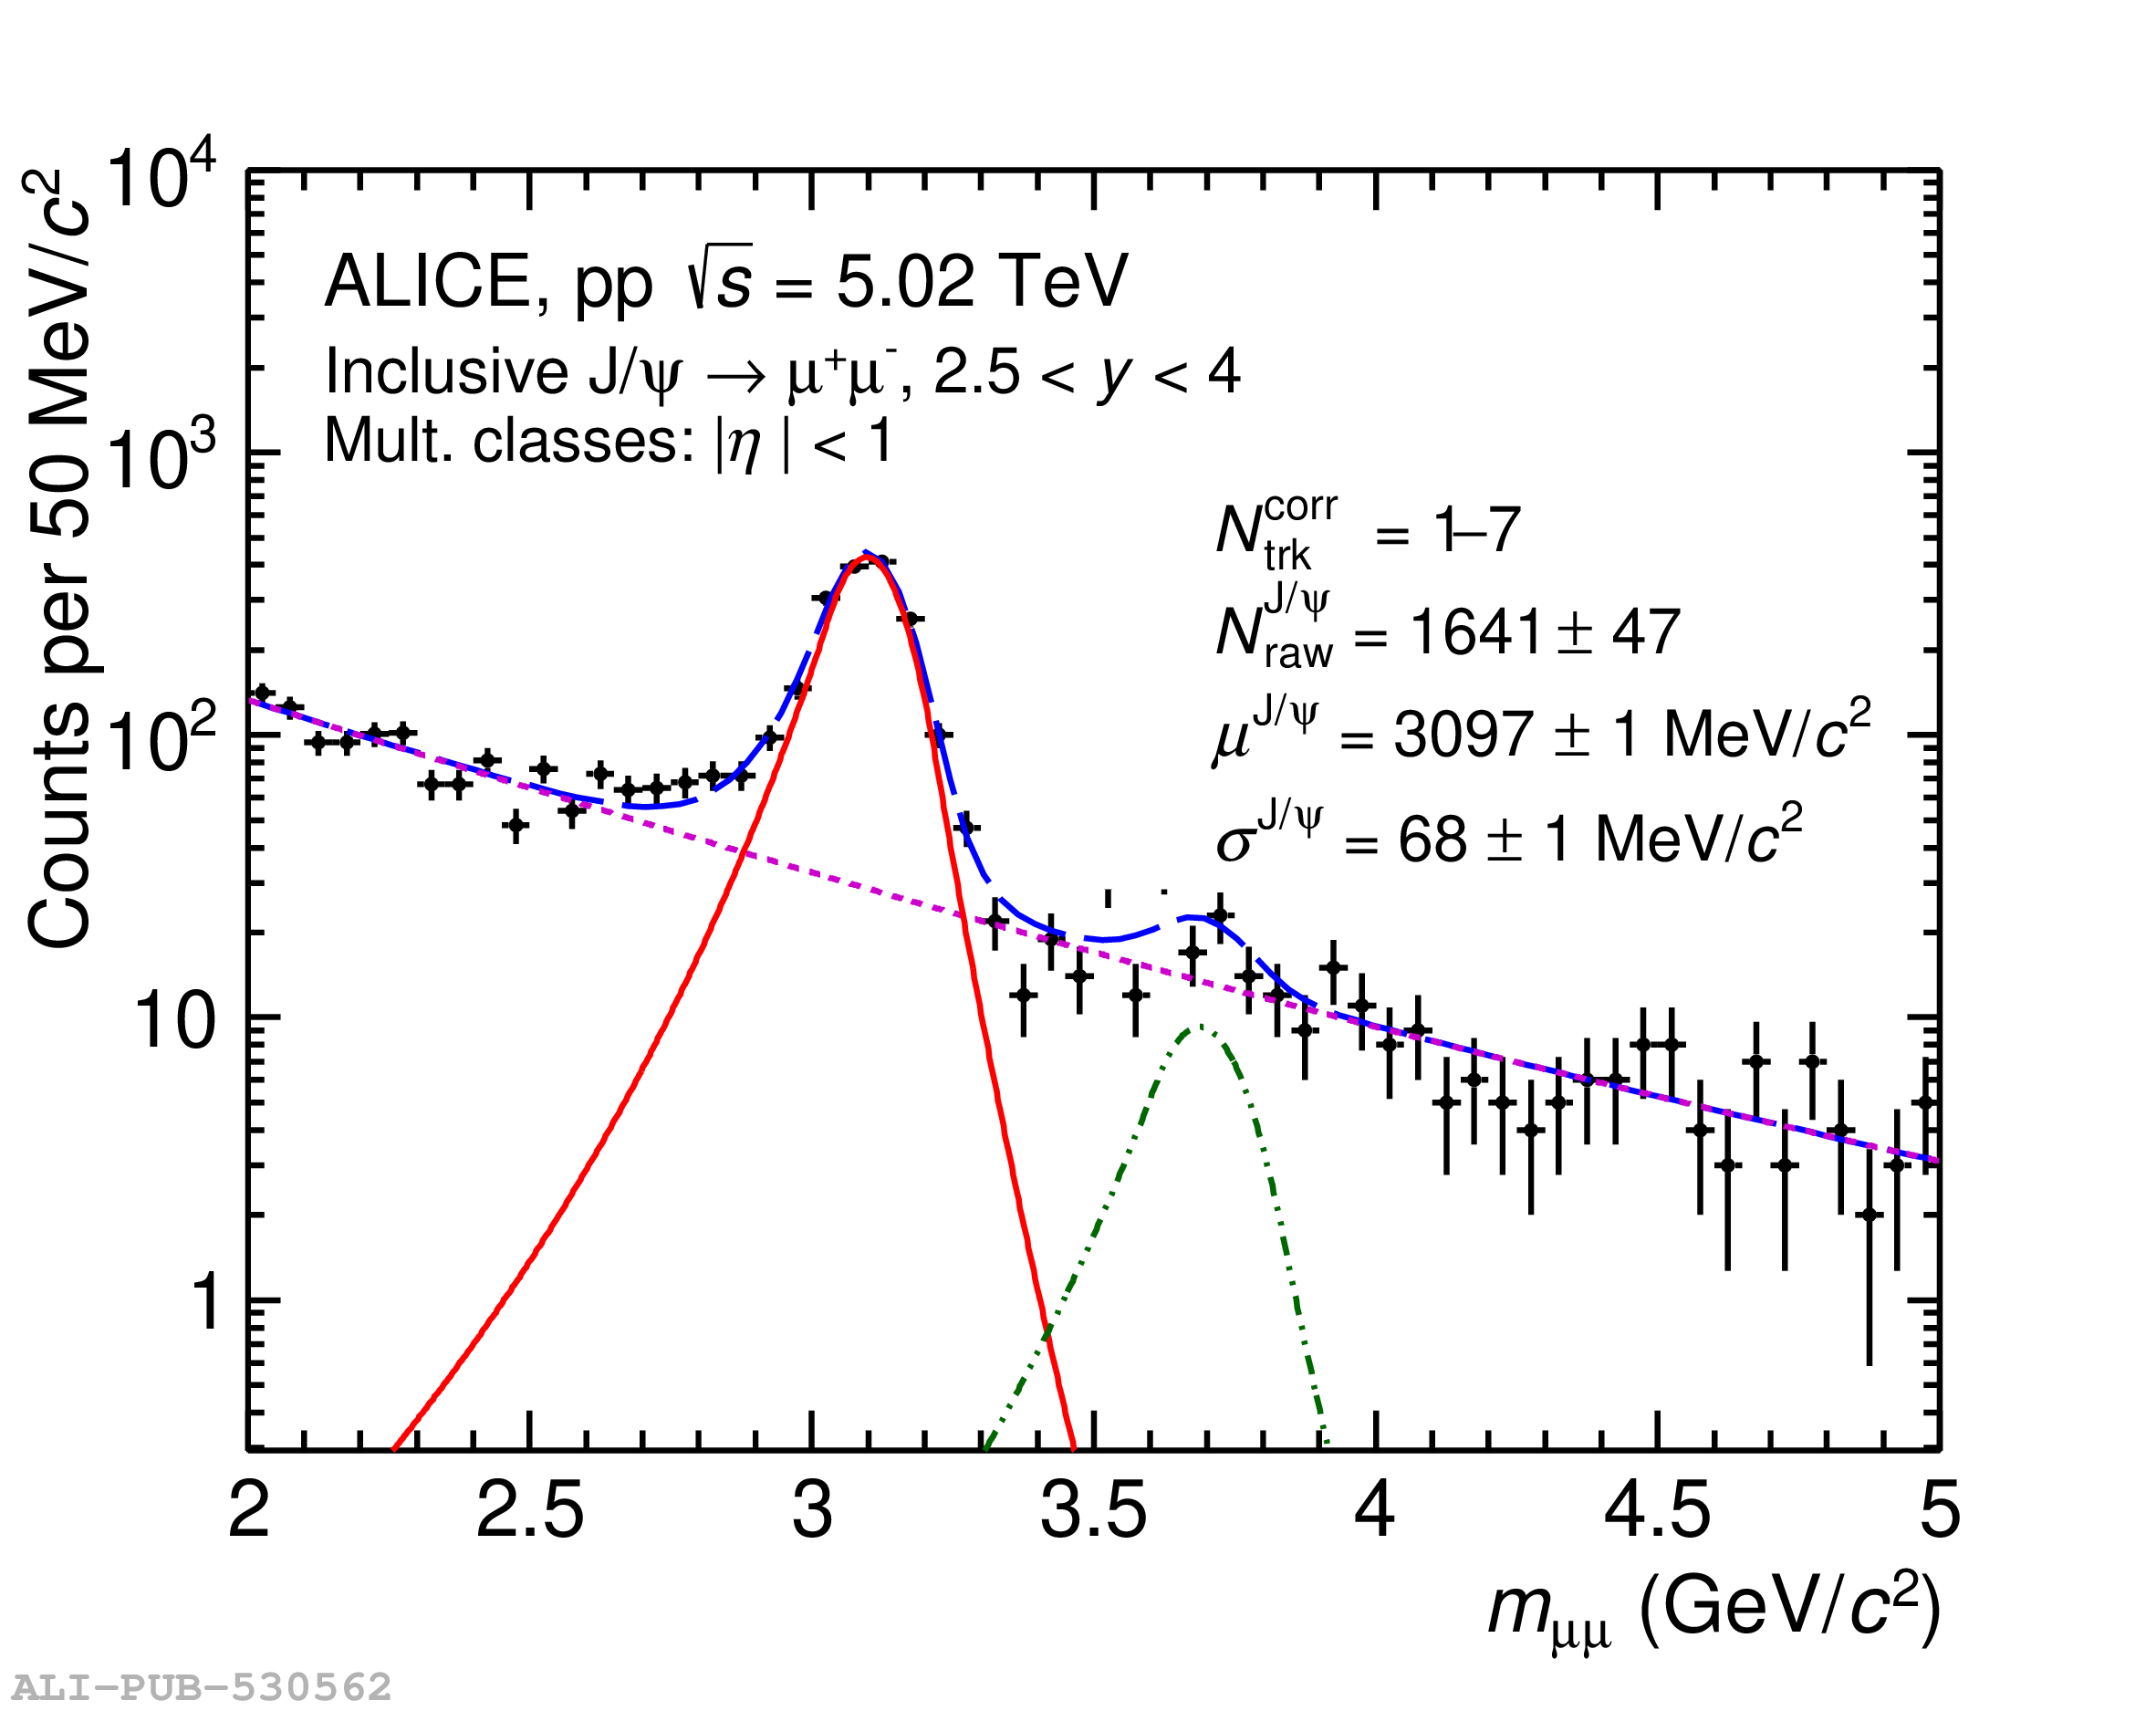 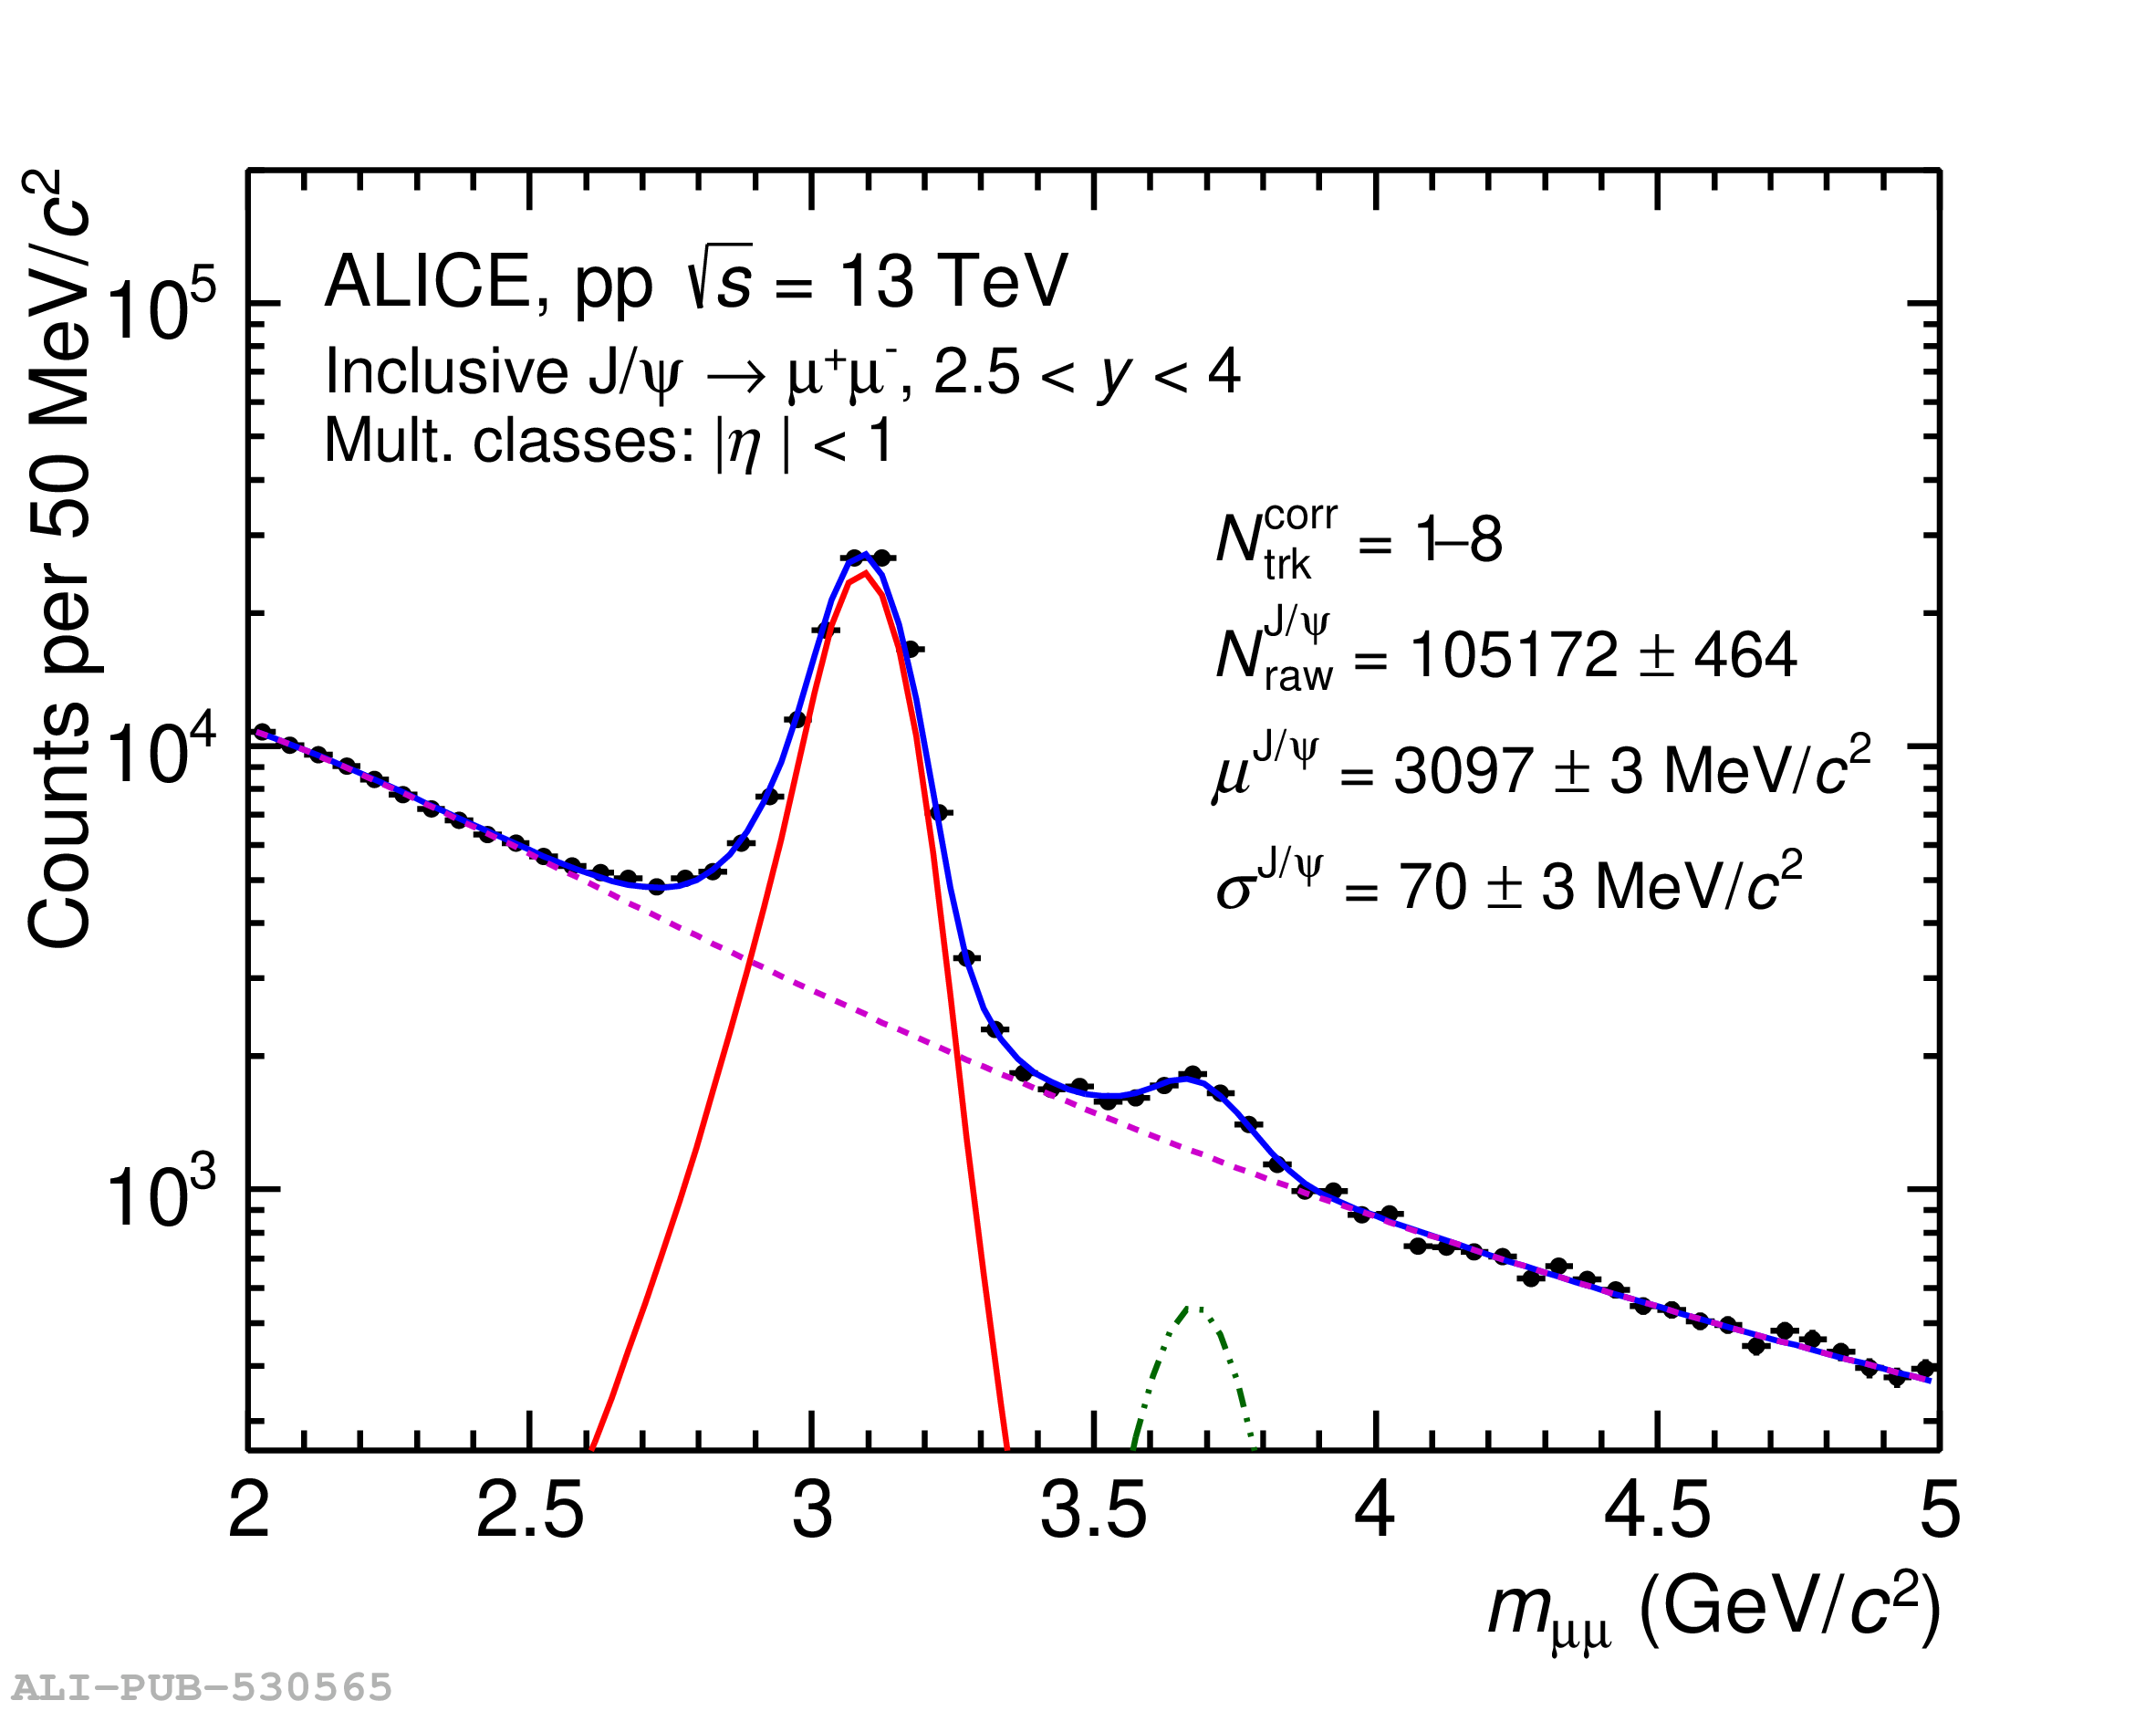 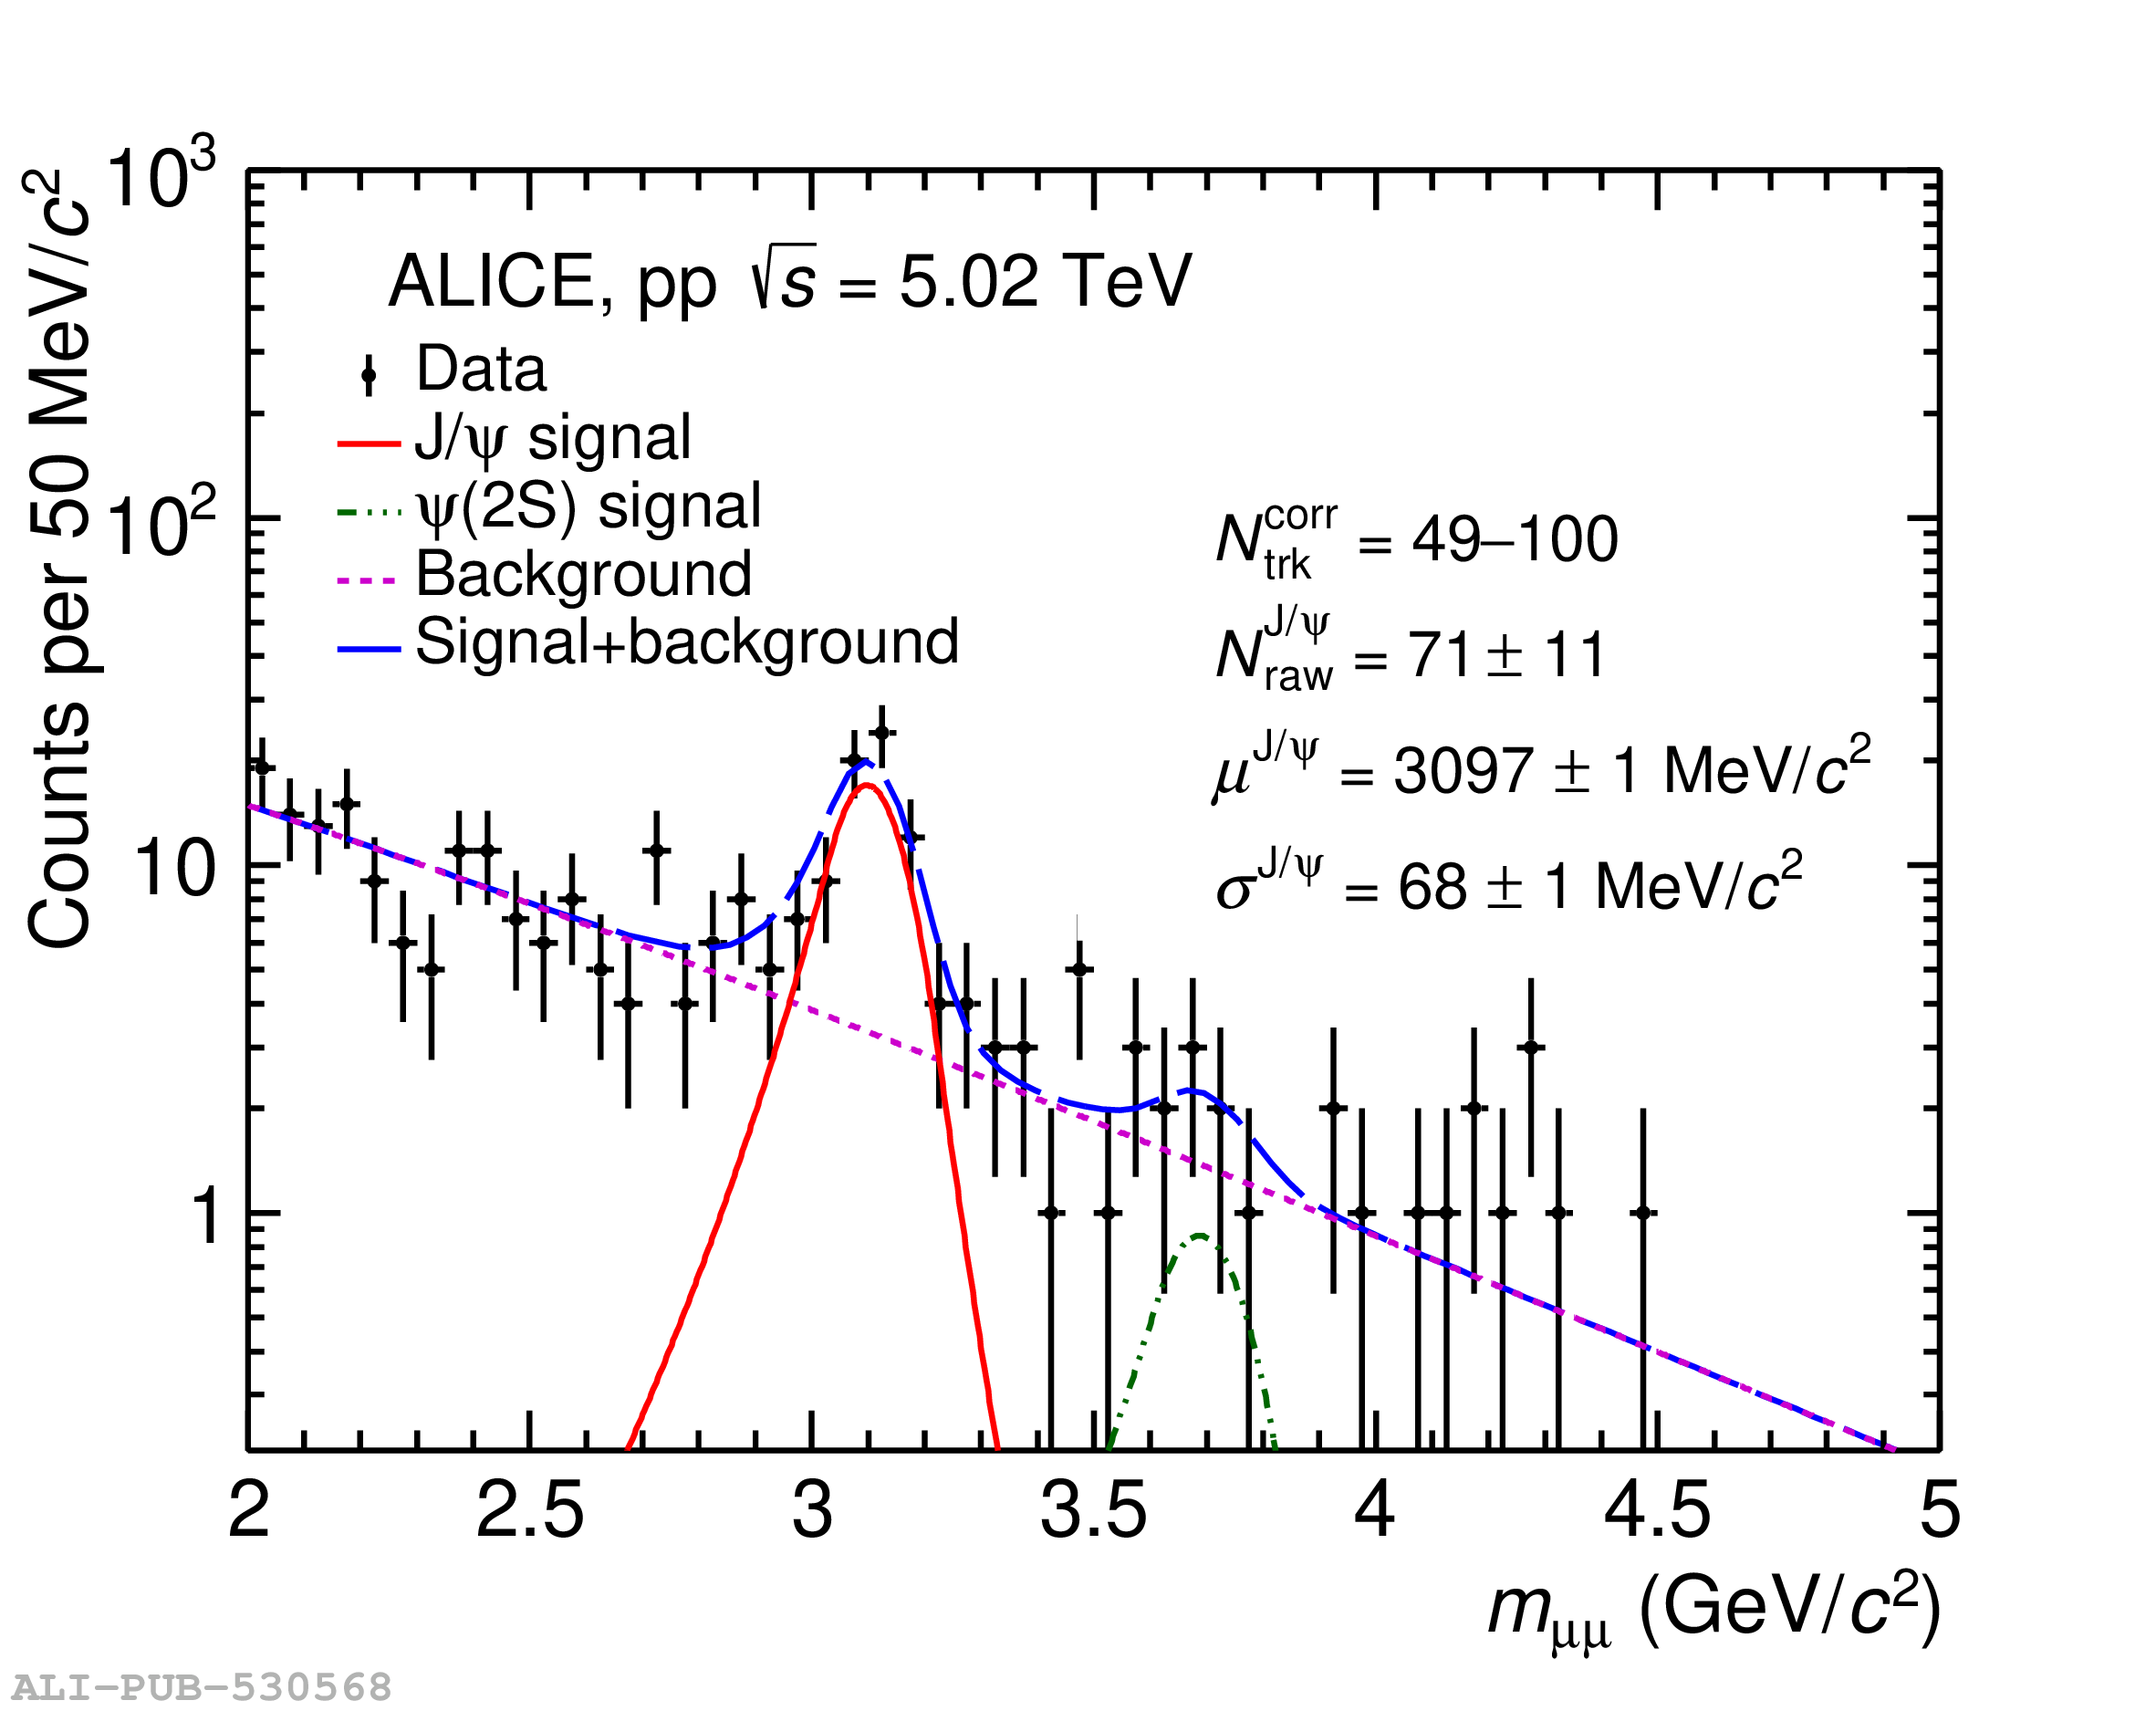 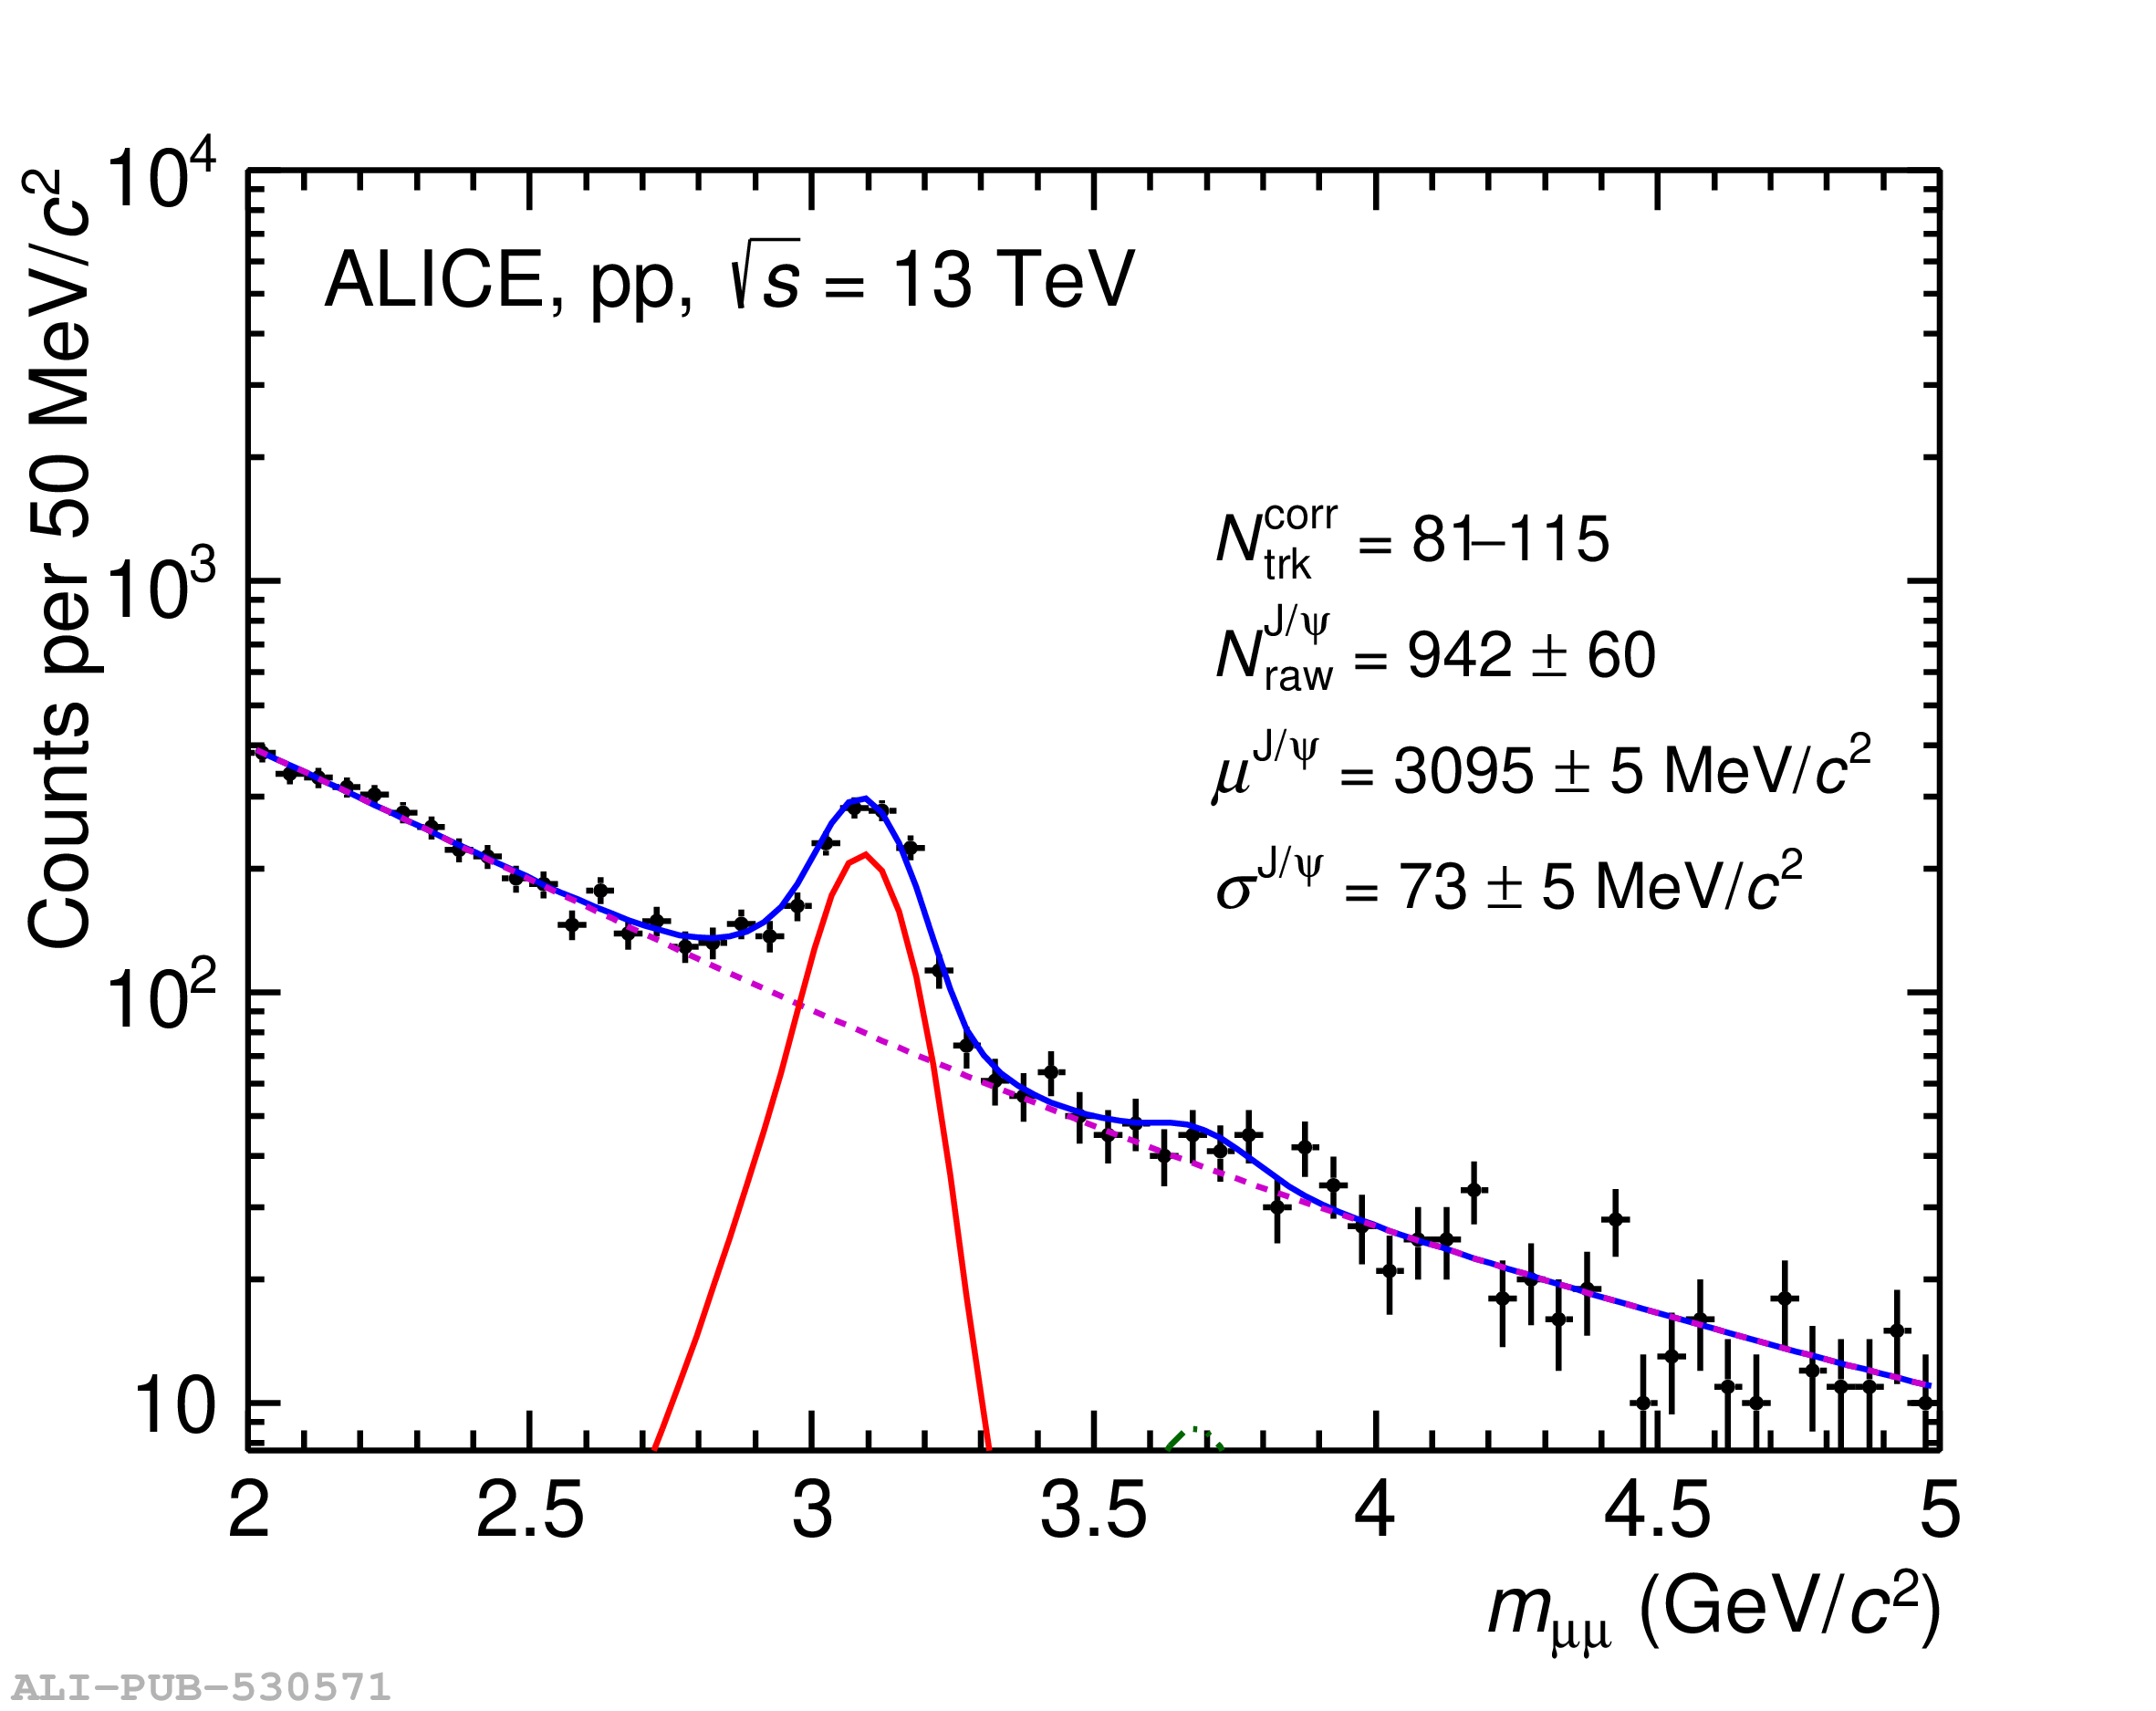 |
Figure 2
Example of $\langle p^{J/\psi}_{\it{T}}\rangle$ extraction in highest, intermediate and lowest \Ntrkcorr bins in \pp collisions at $\sqrt{s} =$ 5.02 and 13 TeV. The scattered points represent the experimental data while various lines show the signal and background functions. | 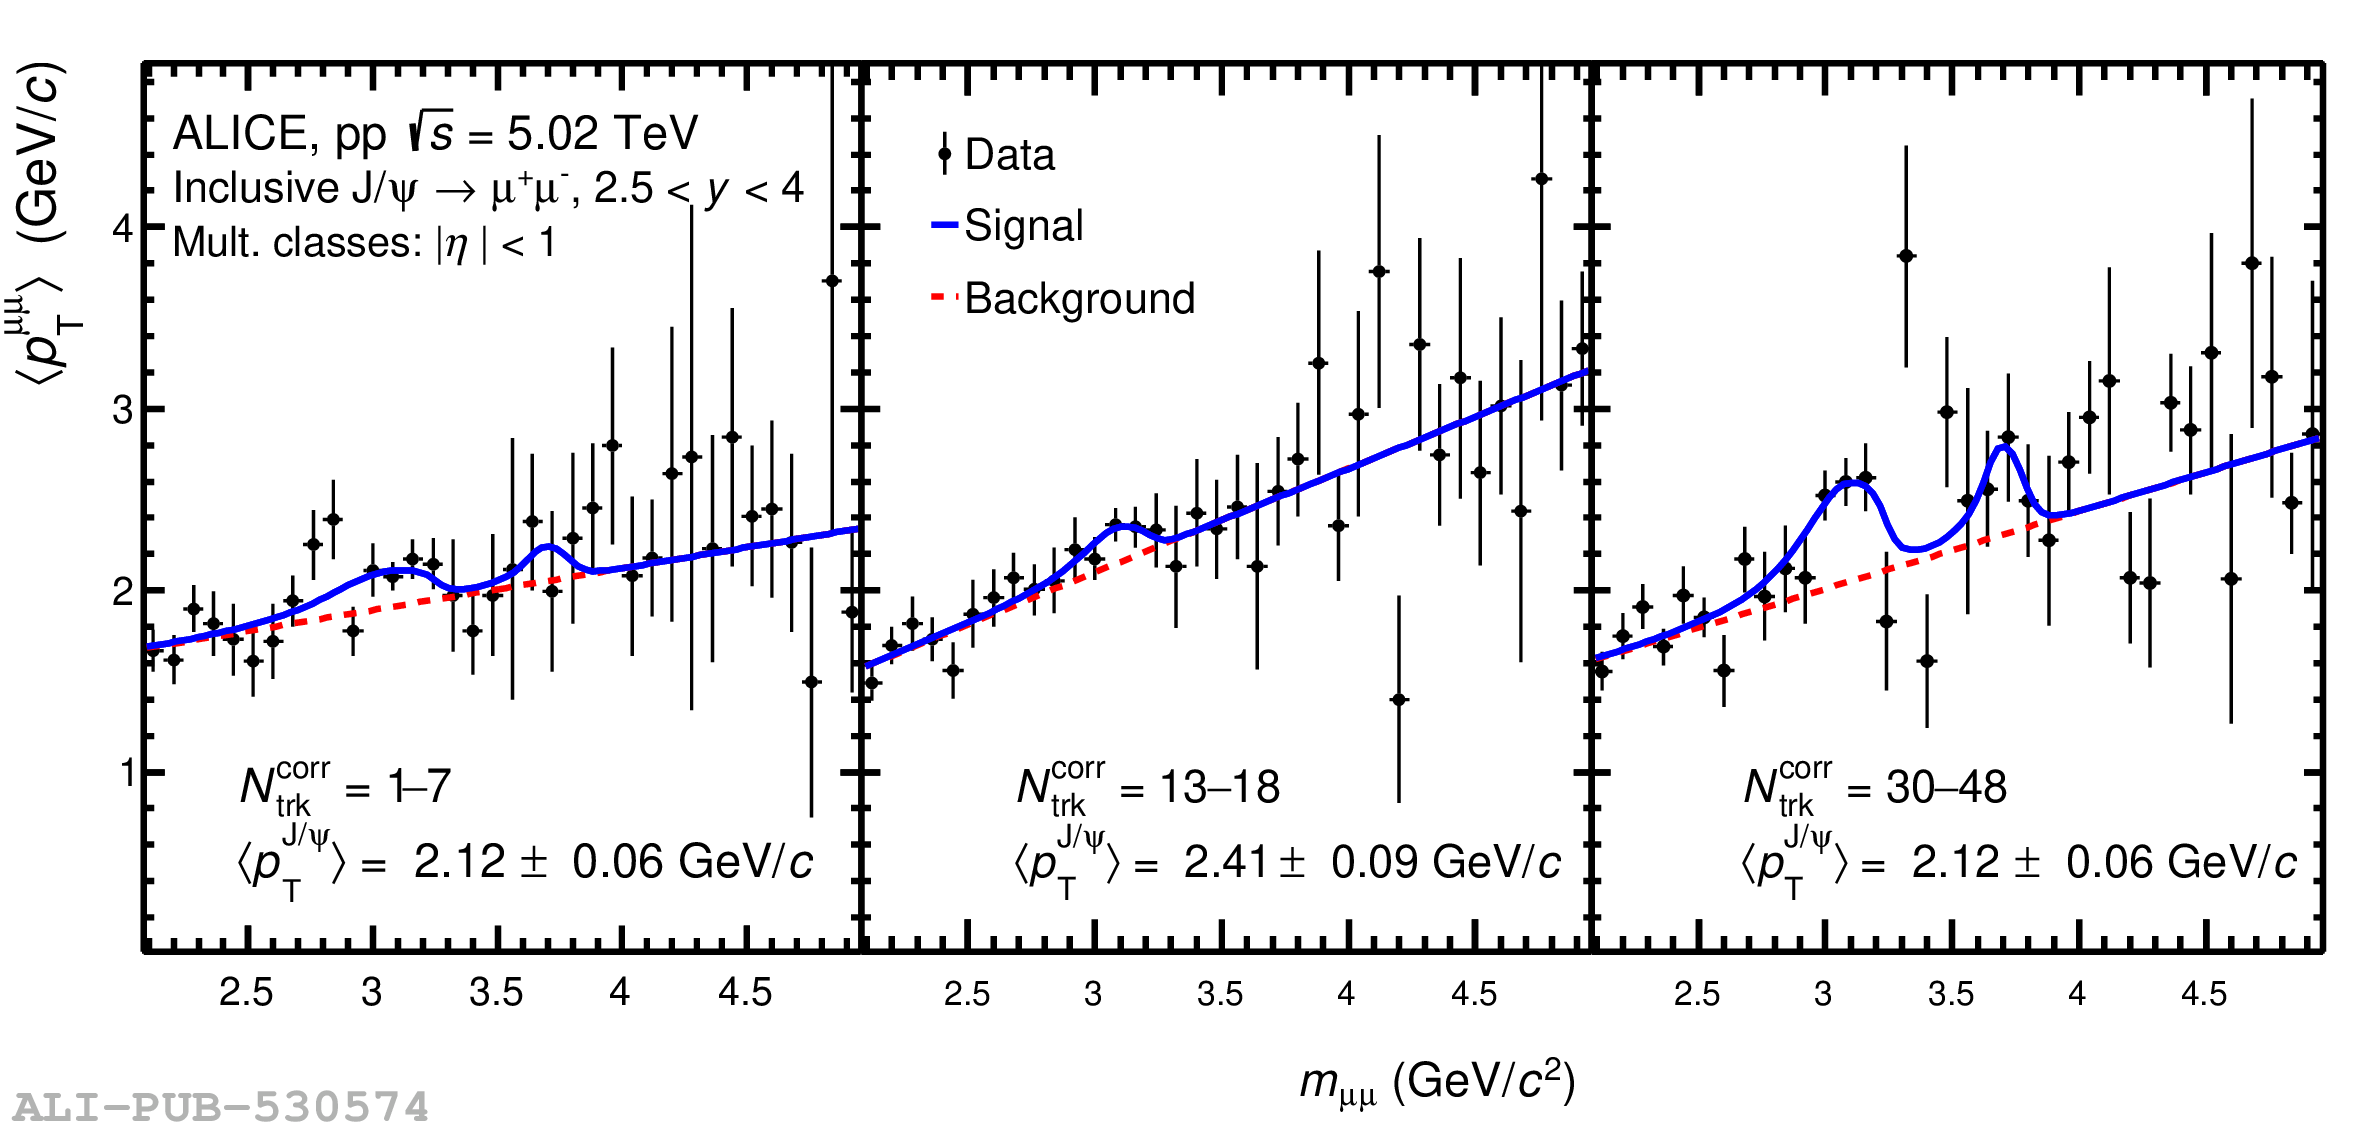 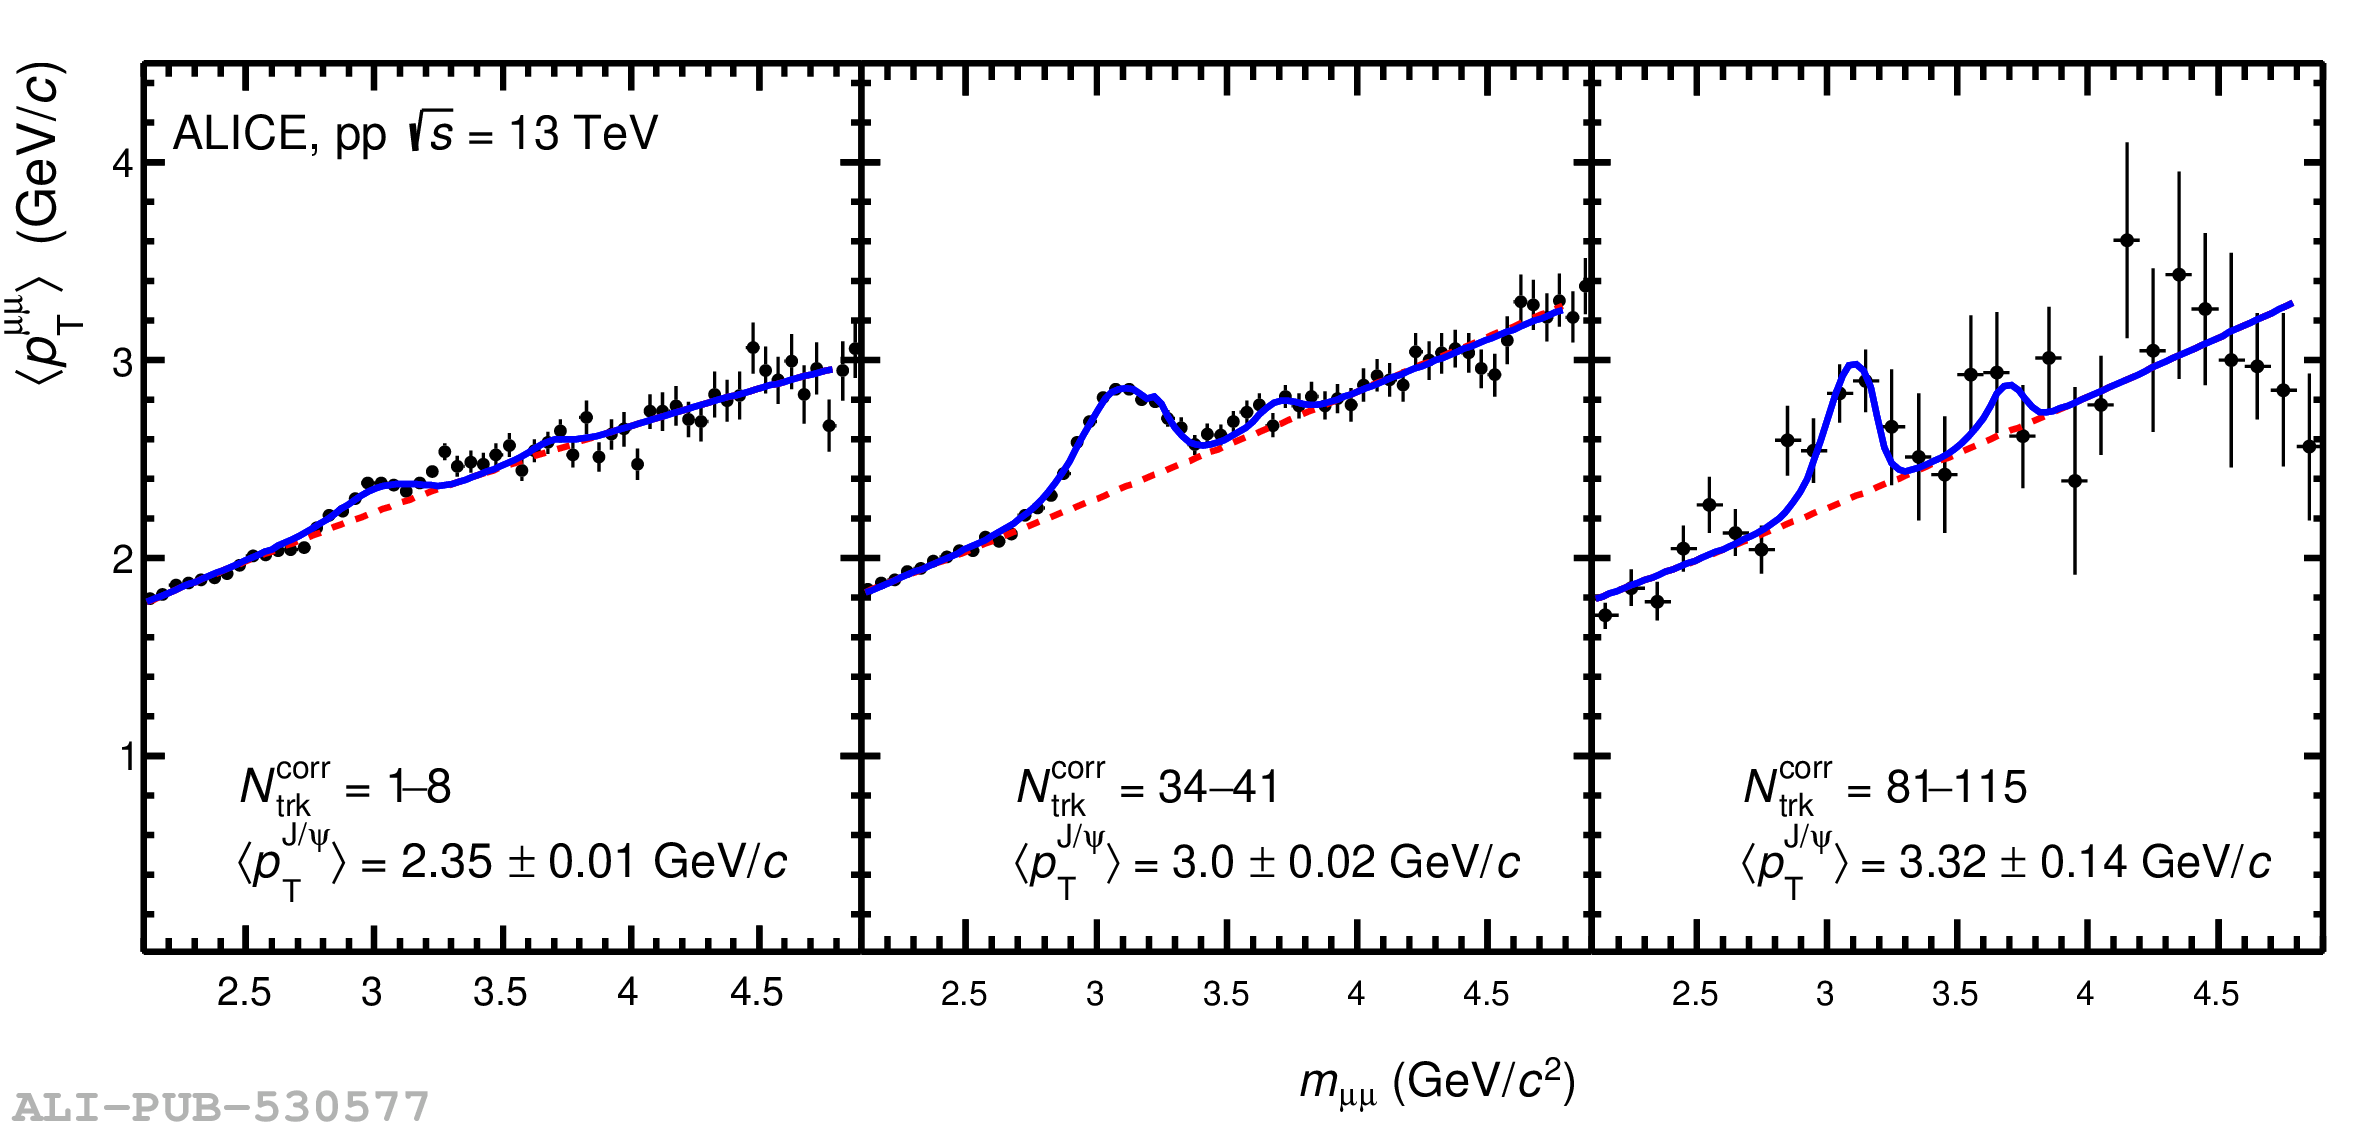 |
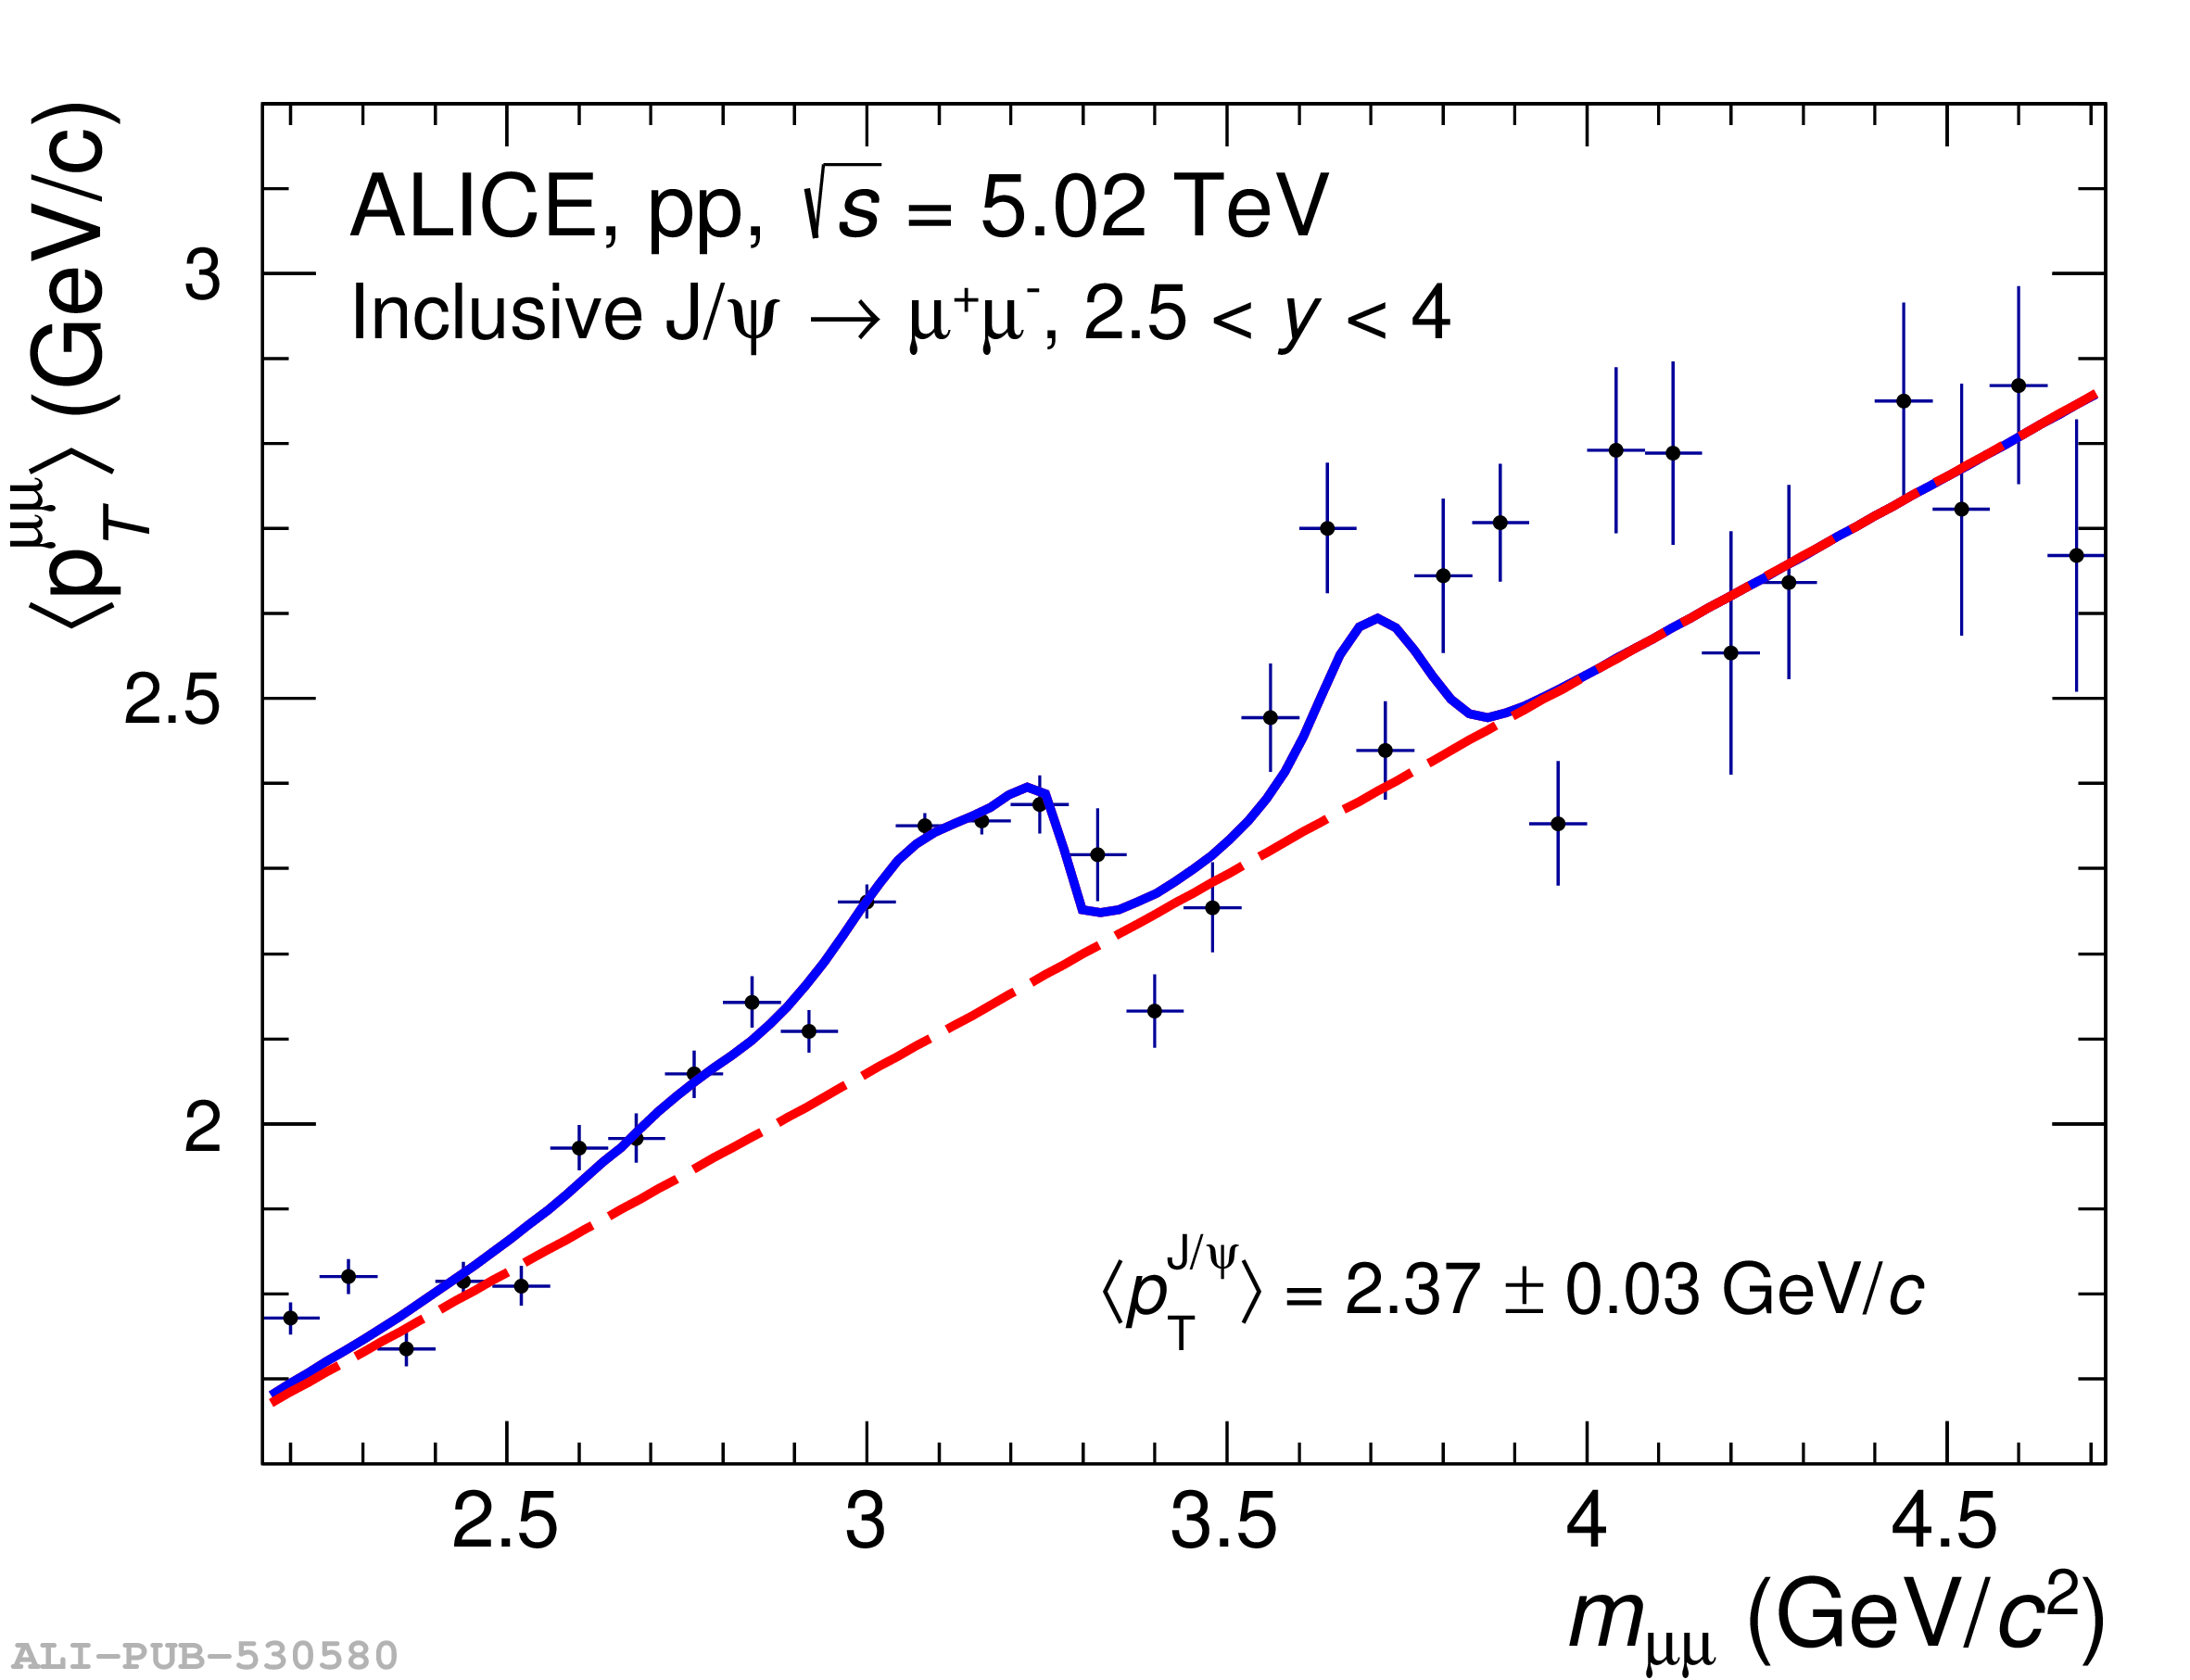

Figure 4
Relative J/$\psi$ yield as a function of the relative charged-particle density measured at forward rapidity in \pp collisions at \s $=$ 5.02 (INEL$>$0), 7 (INEL) and 13 (INEL$>$0) TeV. The bottom panel shows the ratio of relative yield of $\rm{J}/\psi$ to relative charged-particle density. The vertical bars and the boxes represent the statistical and the systematic uncertainties, respectively. |  |

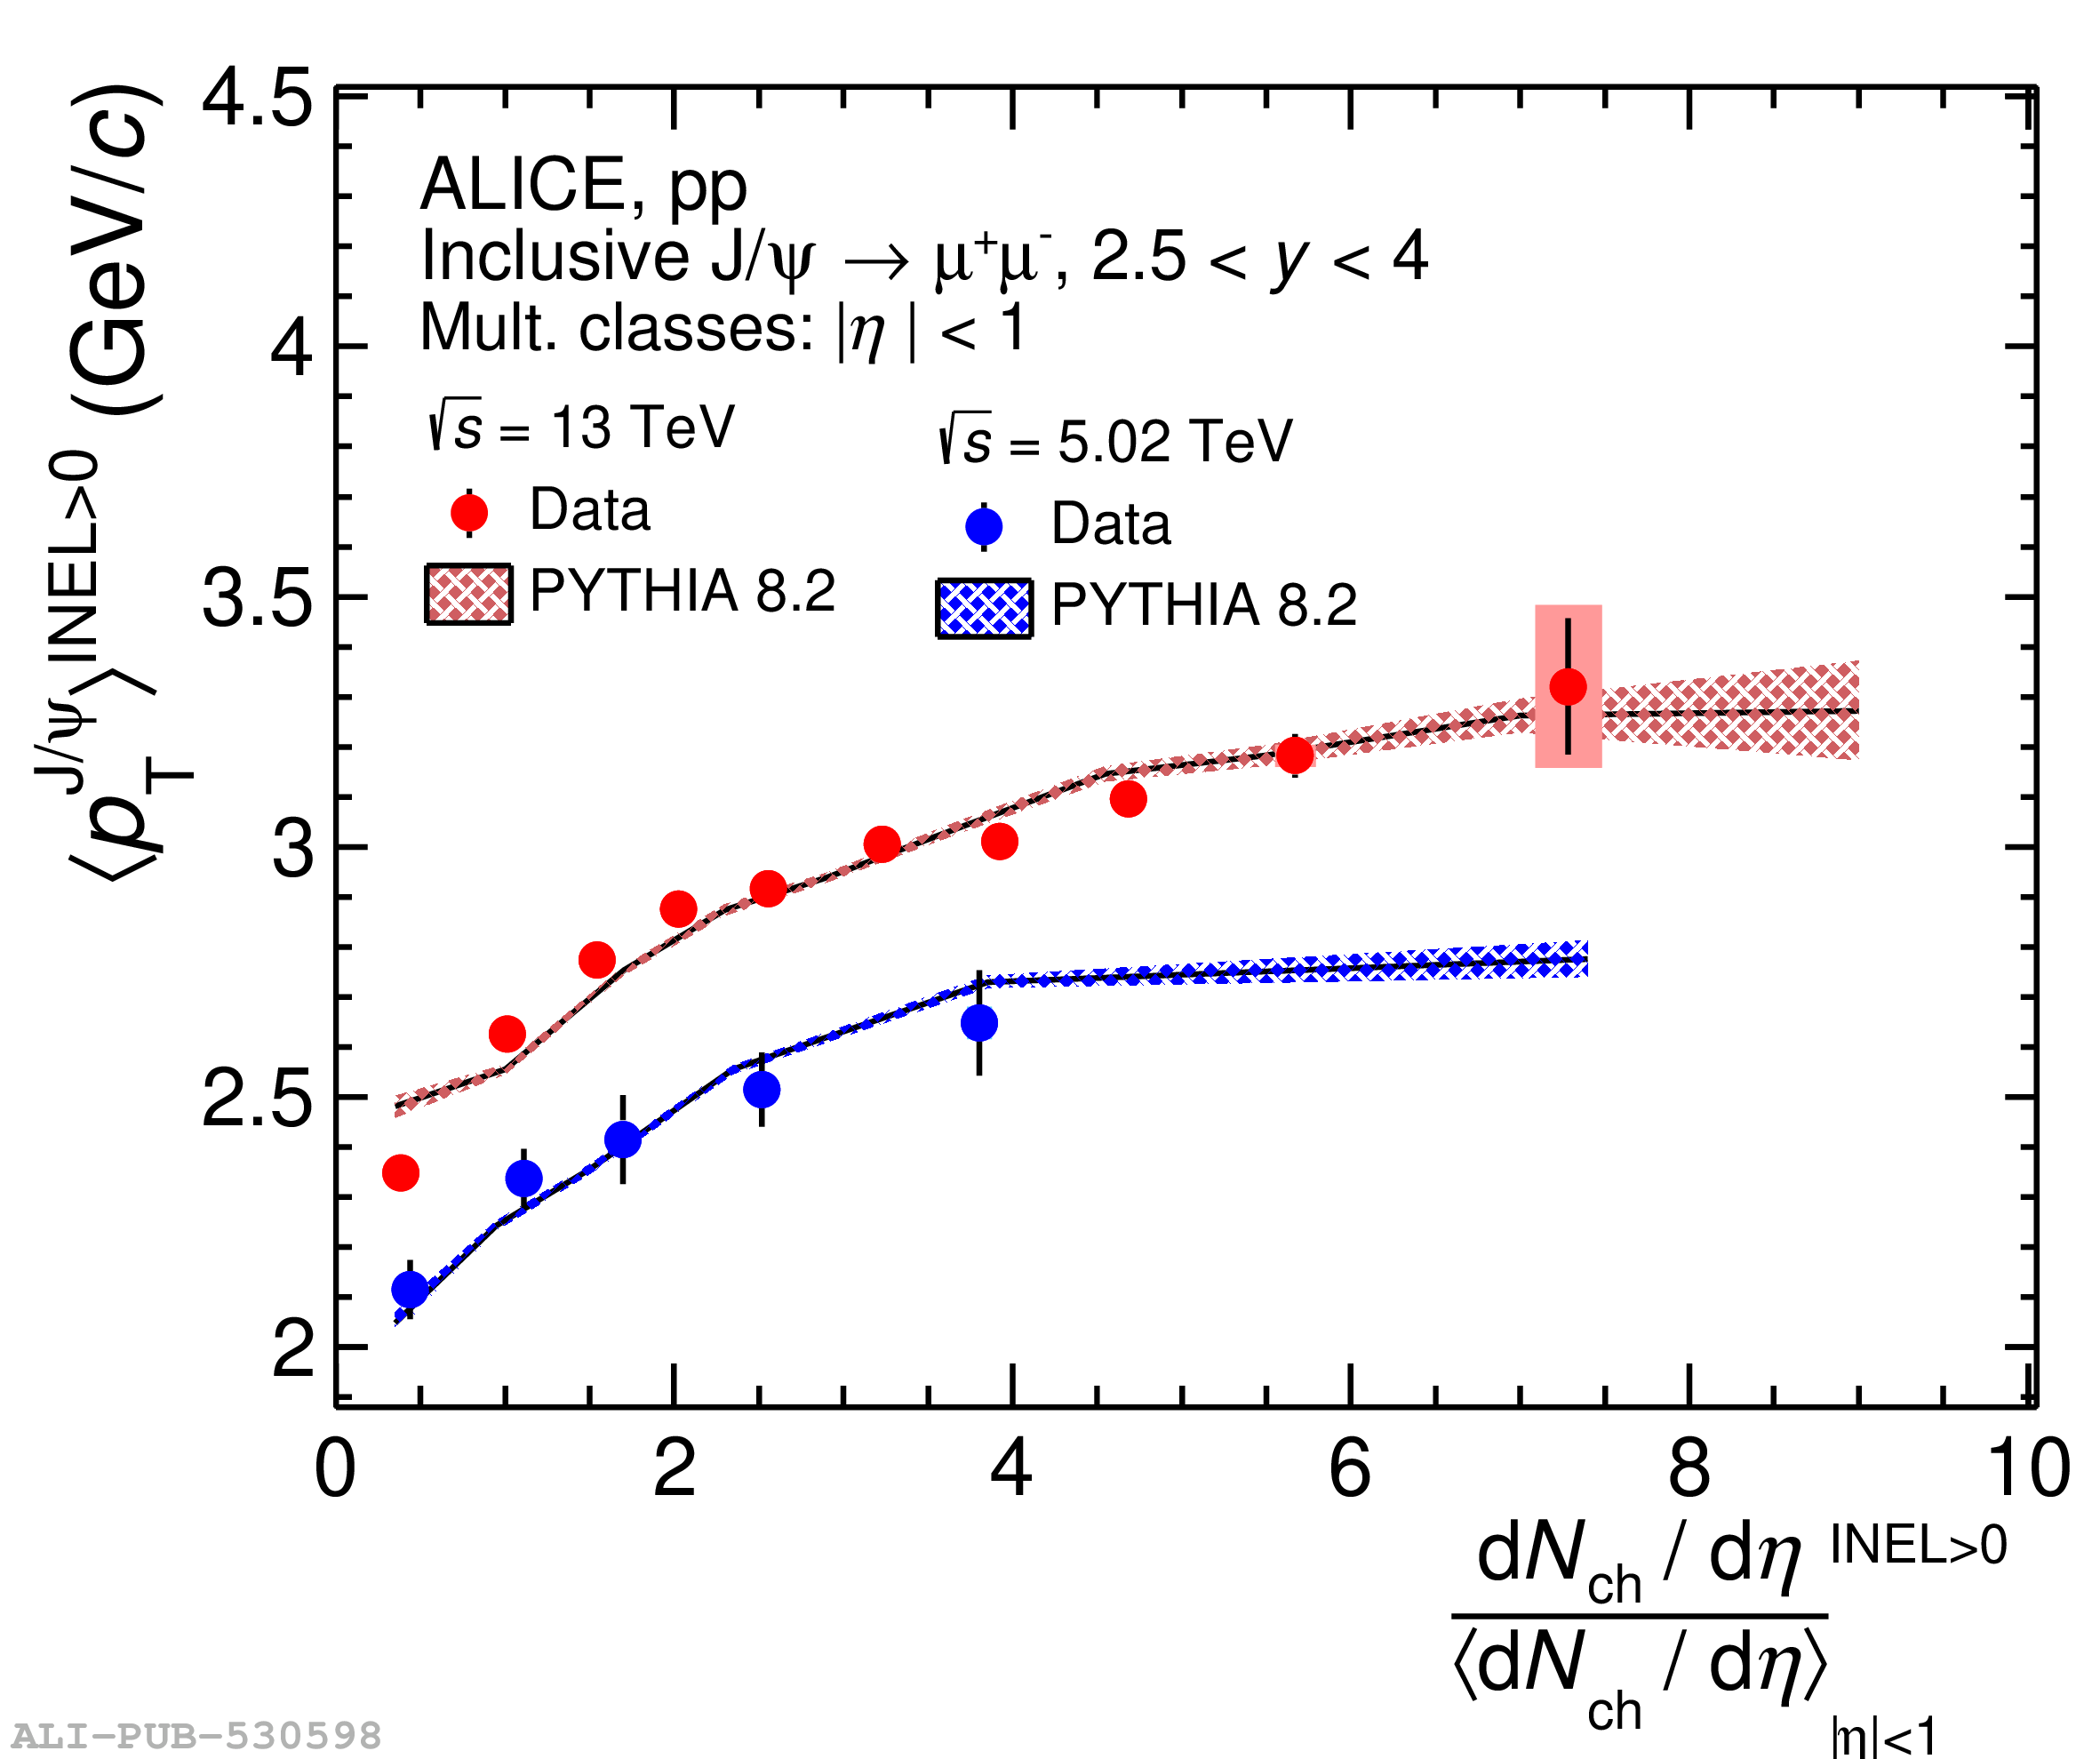
Figure 6
(Top panel) Forward rapidity mean transverse momentum of J$/\psi$ as a function of the relative charged-particle density in \pp collisions at \s $=$ 5.02 and 13 TeV. (Bottom panel) Relative \meanptjpsi shown for the same. The dotted line indicates the deviation of relative \meanptjpsi from one. | 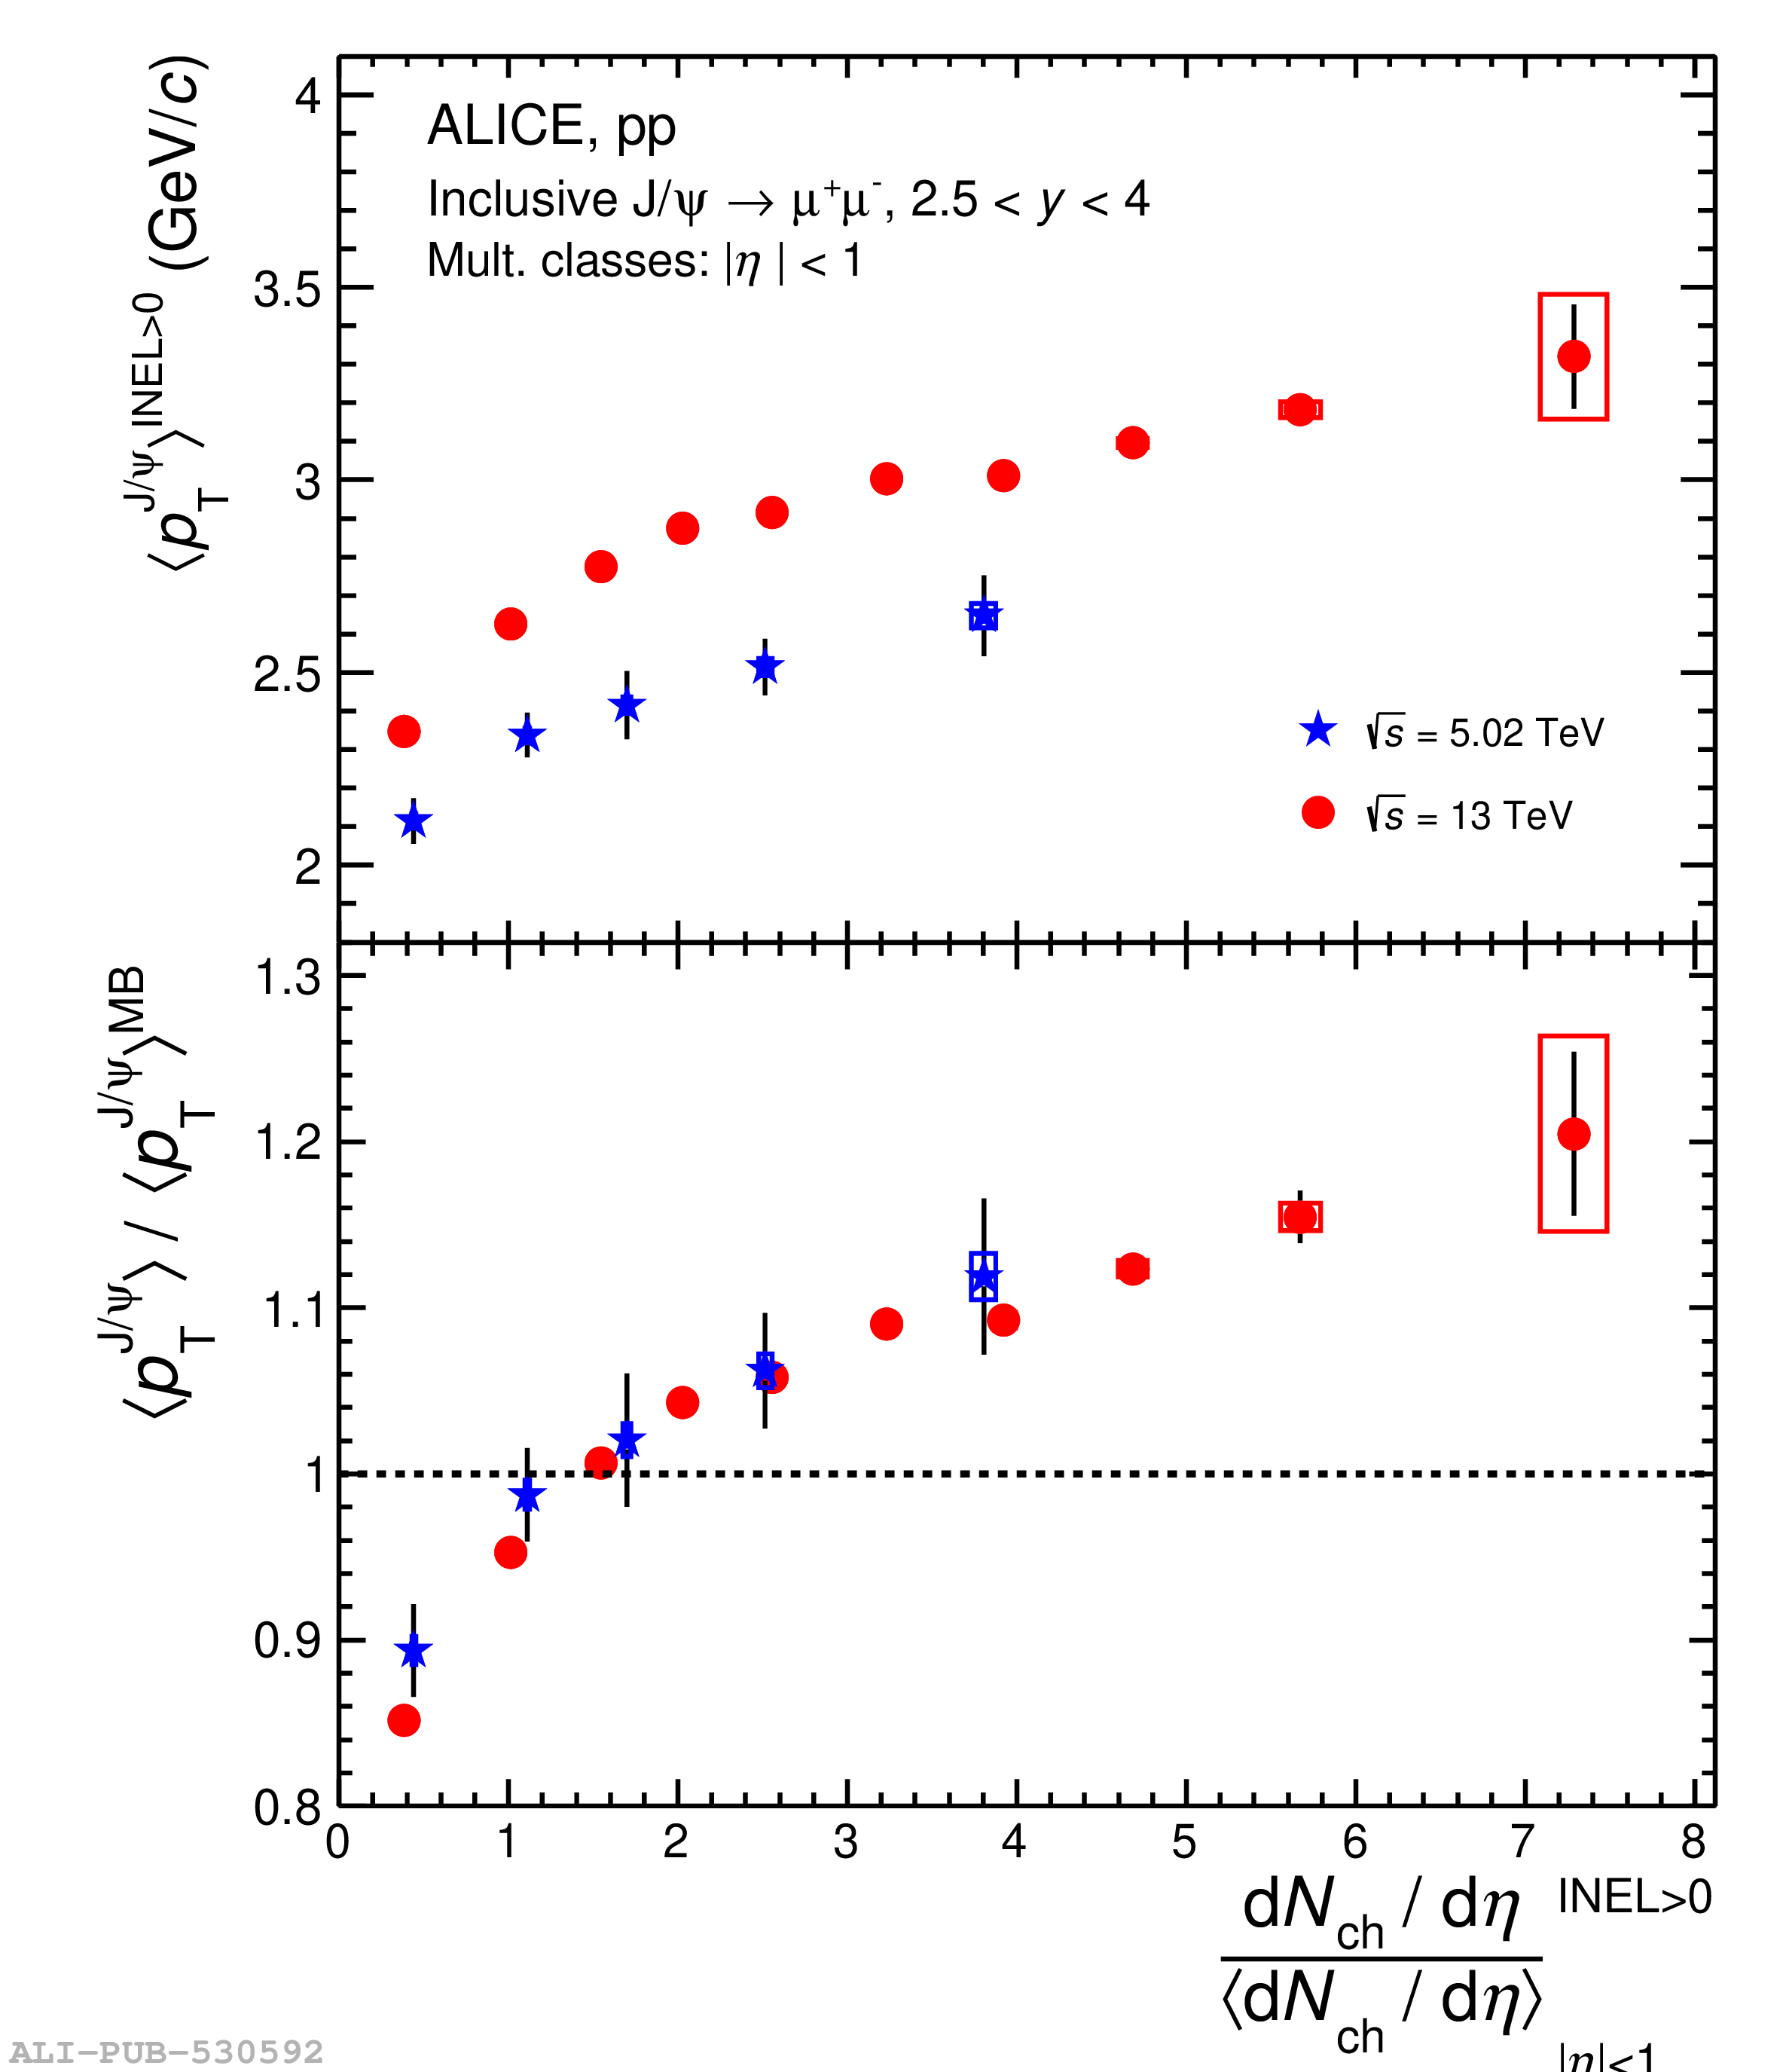 |
Figure 7
Comparison of the relative $\rm{J}/\psi$ yield as a function of the relative charged-particle density with model predictions: CPP , CGC with ICEM , 3-Pomeron CGC , Percolation , EPOS3 event generator , and PYTHIA 8.2 at forward rapidity in \pp collisions at \s $=$ 5.02 (left) and 13 TeV (middle). The right hand side figure shows the results from midrapidity compared to the corresponding theoretical model estimations for pp collisions at \s $=$ 13 TeV . |  |