Measured differential cross section of the coherent \Jpsi\ (left) and \Ppsi\ (right) photoproduction in \PbPb UPC events. The error bars (boxes) show the statistical (systematic) uncertainties. The theoretical calculations are also shown. The green band represents the uncertainties of the EPS09 LO calculation. | 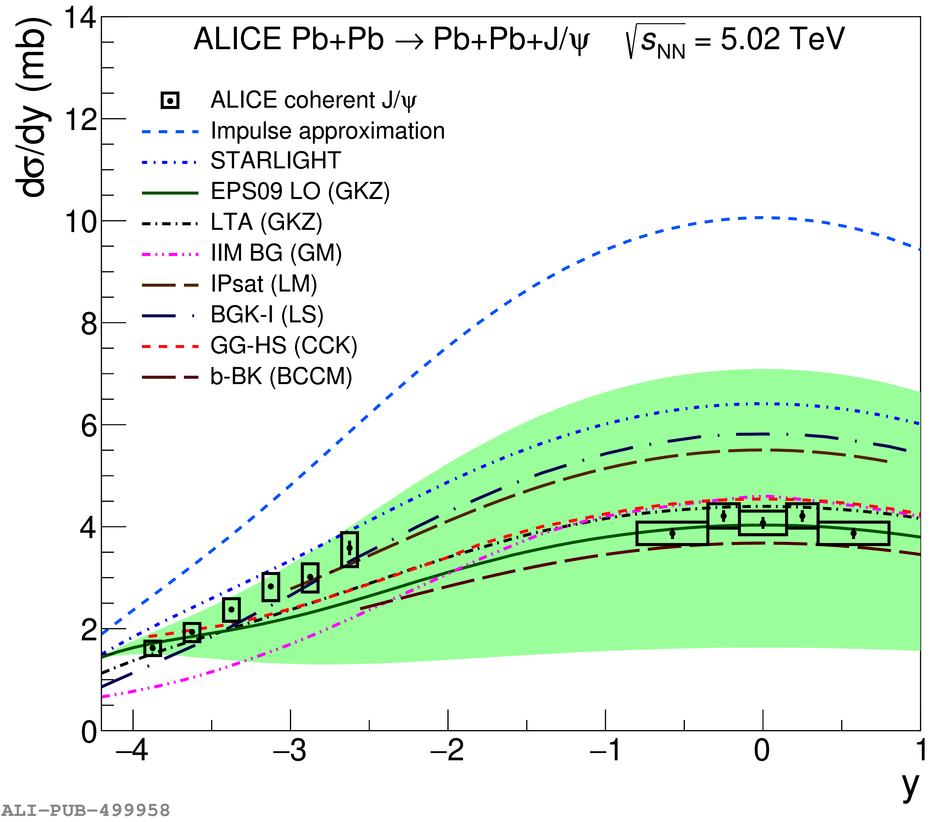 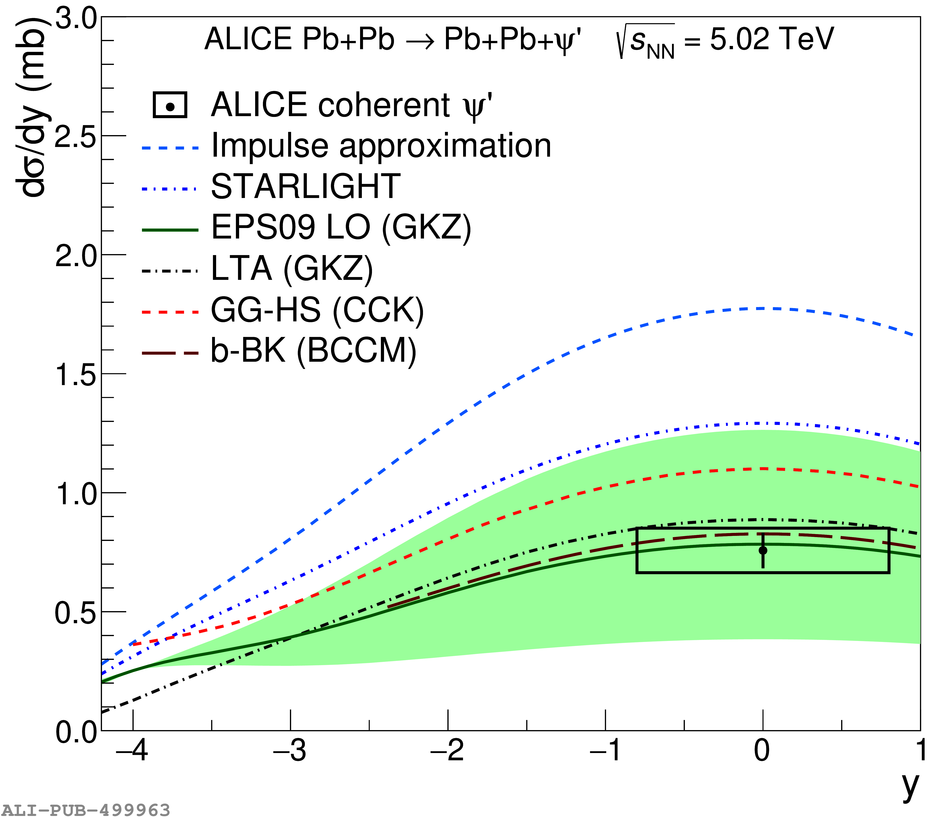 |