$\gammaiso$-tagged fragmentation function for pp (red) and \pPb data (blue) at $\sqrt{s_\mathrm{NN}}$ = 5.02 TeV as measured by the ALICE detector. The boxes represent the systematic uncertainties while the vertical bars indicate the statistical uncertainties. The dashed green line corresponds to \textsc{PYTHIA 8.2}. The $\chi^2$ test for the comparison of pp and \pPb data incorporates correlations among different \zt intervals. A constant that was fit to the ratio including statistical and systematic uncertainties is shown as grey band, with the width indicating the uncertainty on the fit. | 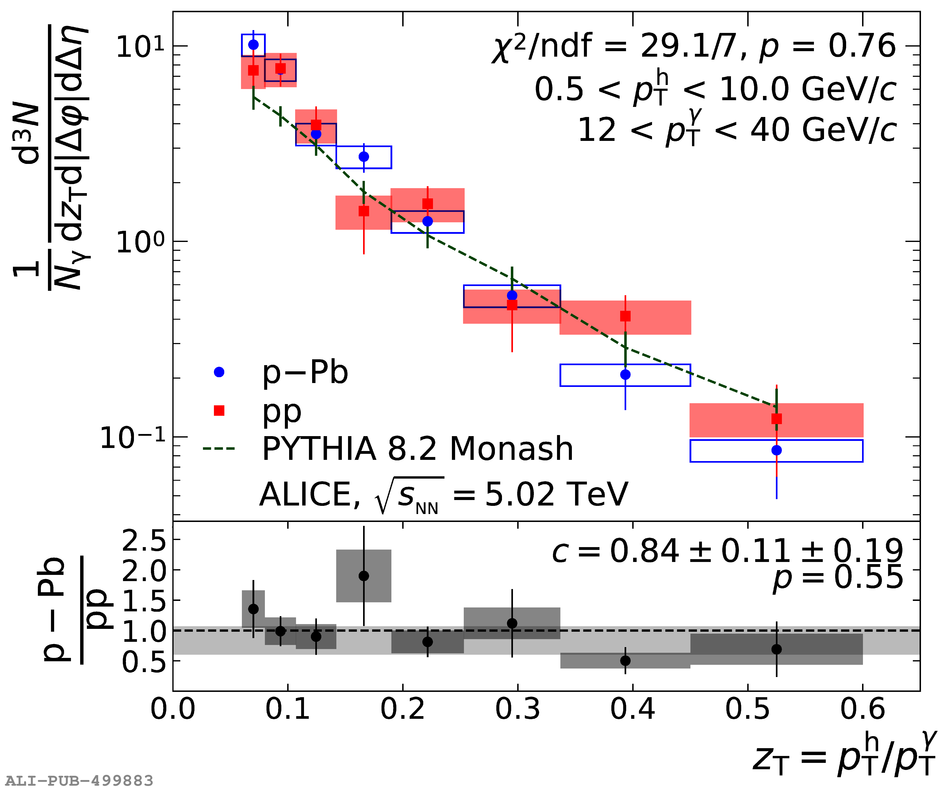 |