(Left) Invariant differential cross sections for \pix, \kx, and \px production, compared with NLO pQCD calculations using CT10NLO PDFs with DSS14 FFs for \pix and DSS FFs for \kx and \px. The shaded bands around the NLO calculations correspond to the scale uncertainty. (Right) Ratio of measured data (points) or NLO calculations (lines) to a L\'evy--Tsallis function that is fitted to the data. The NLO-to-fit ratio is shown for the scale $\mu=\pt$ and the variations $\mu=\pt/2$ and $\mu=2\,\pt$. The fully correlated normalization uncertainty is indicated in the legend | 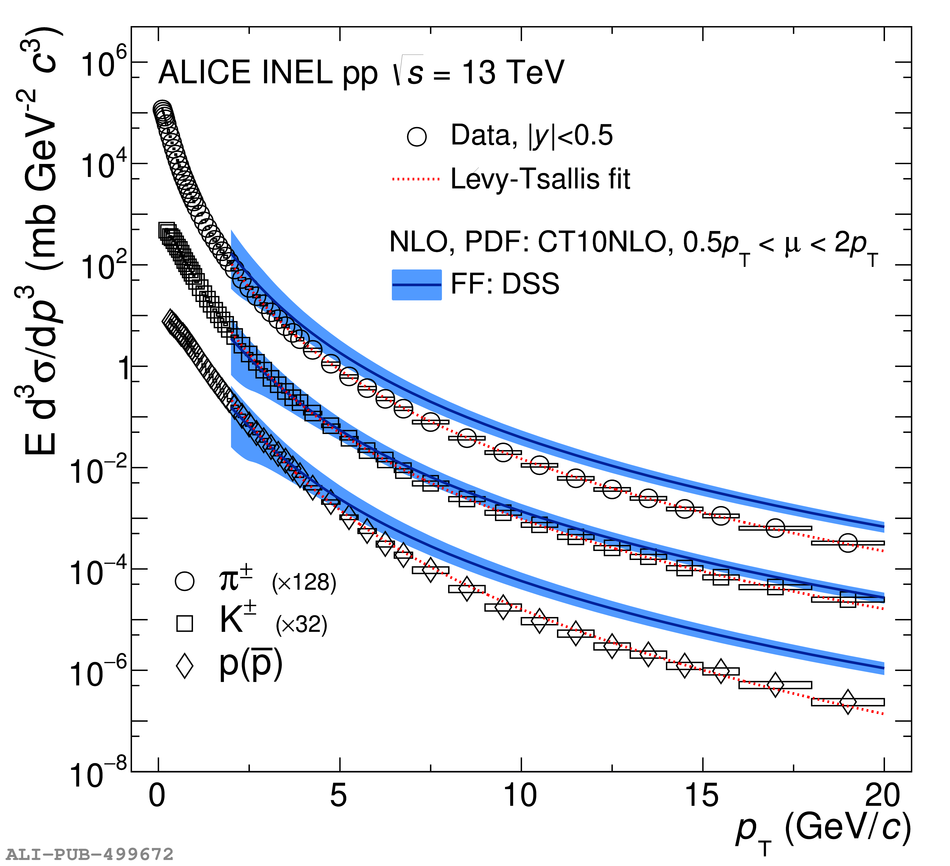 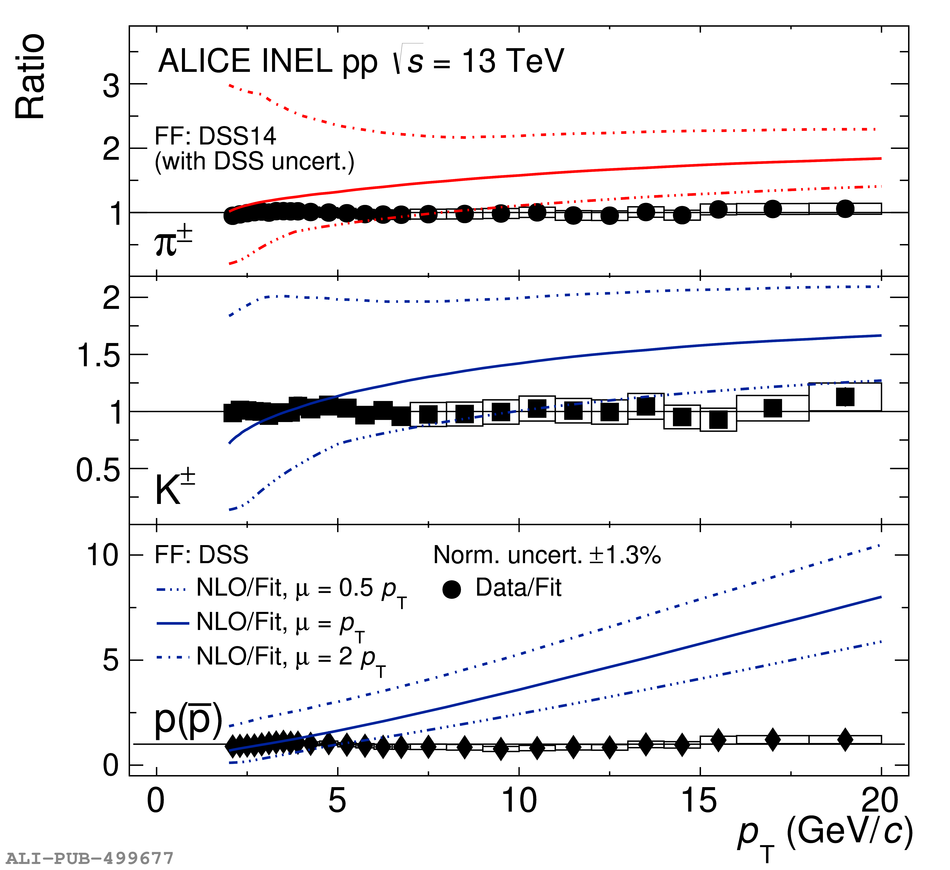 |