Left panel: $n_{\sigma\textrm{,e}}^\textrm{TPC}$ distribution as a function of the electron \pt after applying the particle identification criteria on the TOF signal (see text for details). Right panel: invariant mass distribution of $\Xi^{-} \rightarrow \pi^{-}\Lambda$ (and charge conjugate) candidates integrated over $ p_{\rm T}^{\Xi^{-}}$ The arrow indicates the world average $\Xi^{-}$ mass and the dashed lines define the interval in which the $\Xi^{-}$ candidates are selected for the $\Xi^0_{\rm c}$ reconstruction (see text for details). | 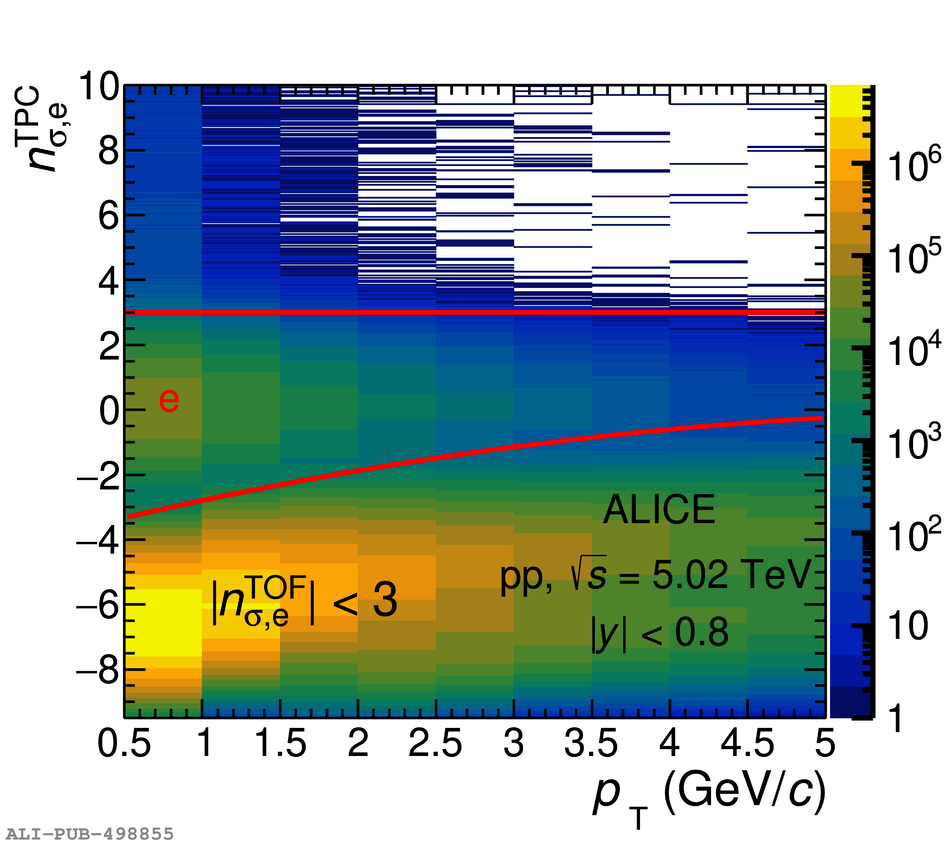 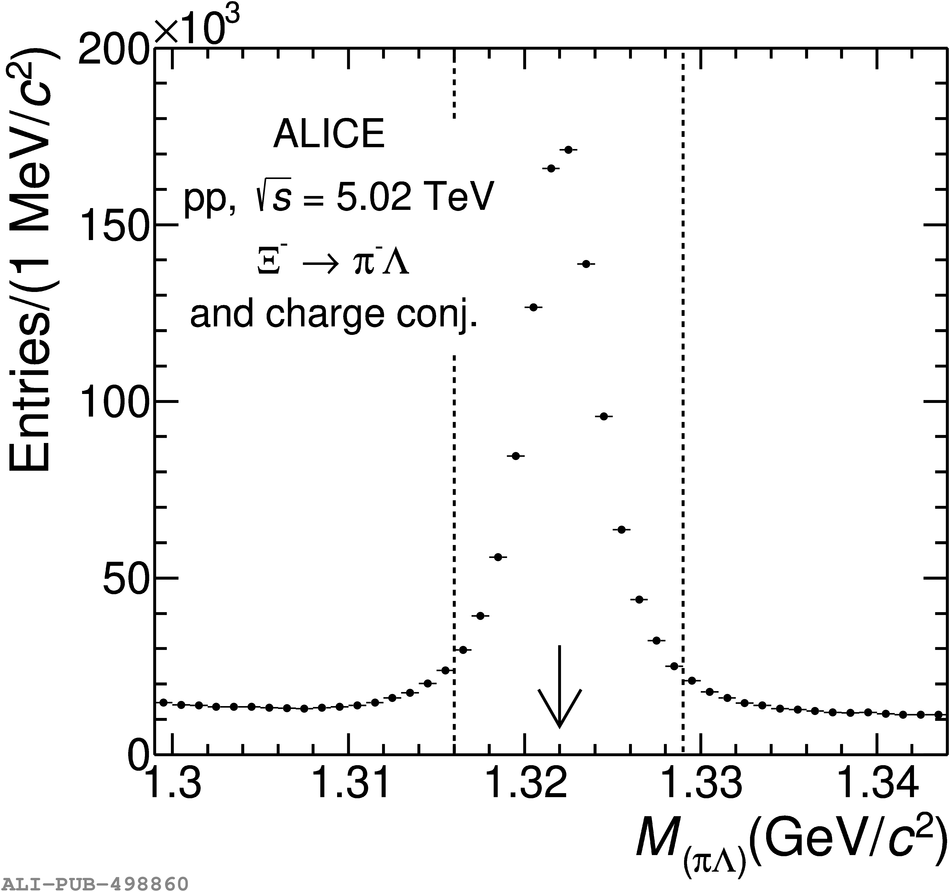 |