Differential dielectron cross sections as a function of \mee (left) and \pTee (right). The different components of the hadronic cocktail are shown as solid lines. The error bars and boxes indicate the statistical and systematic uncertainties of the data points. The cocktail uncertainties are shown as gray bands. In the bottom panels, the ratios of data and cocktail are shown. | 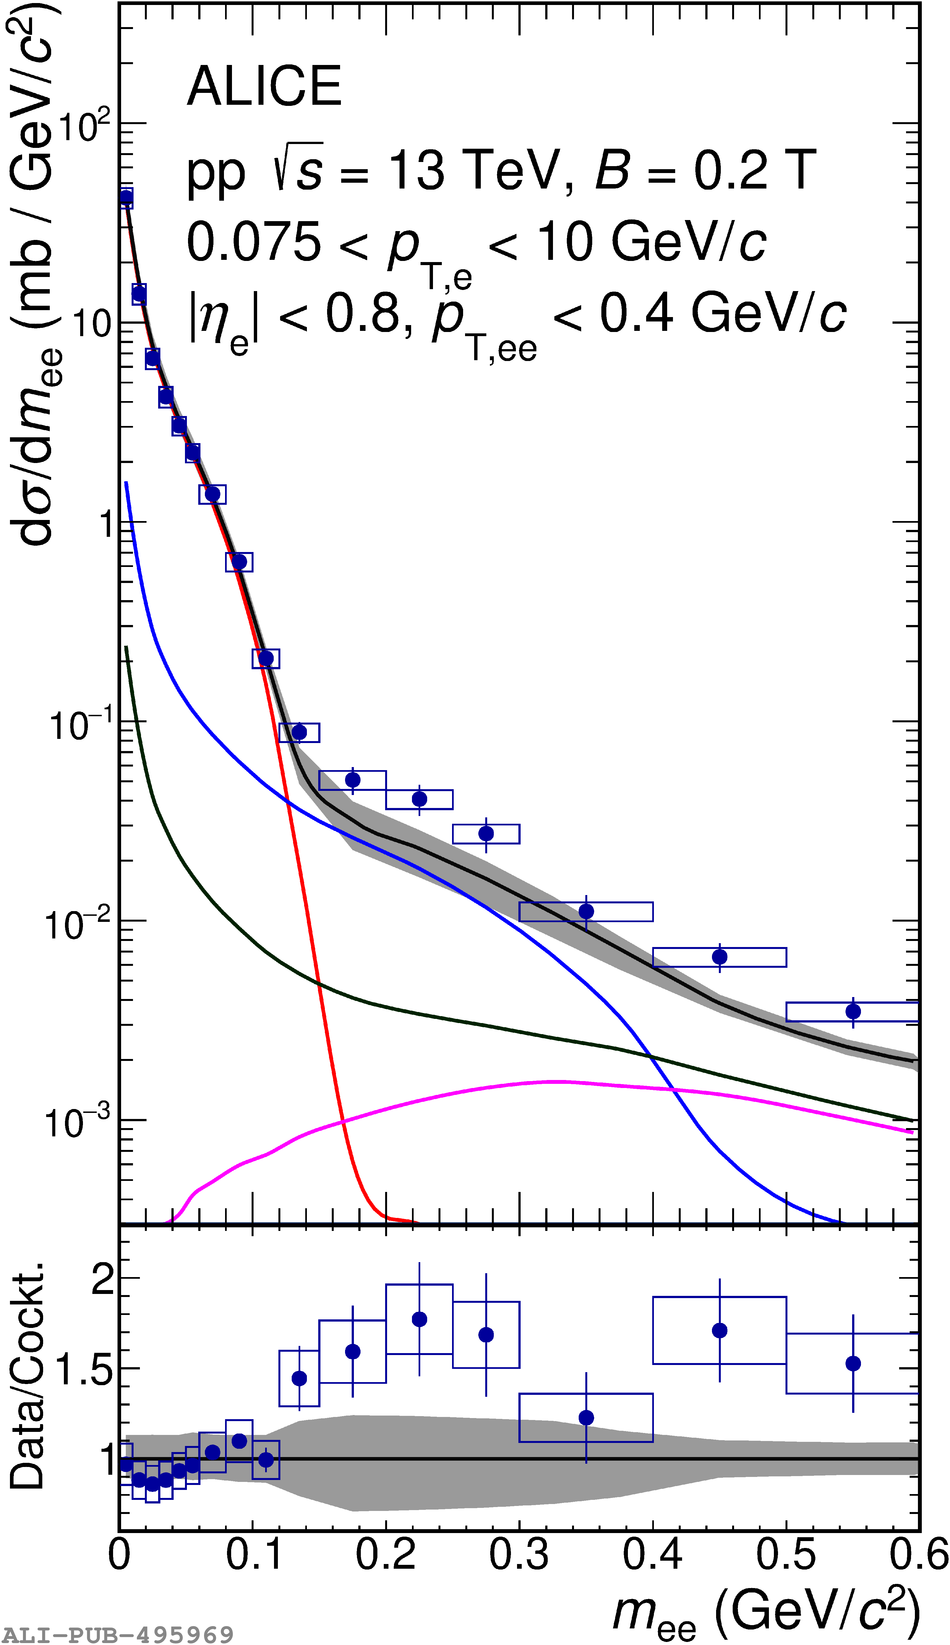 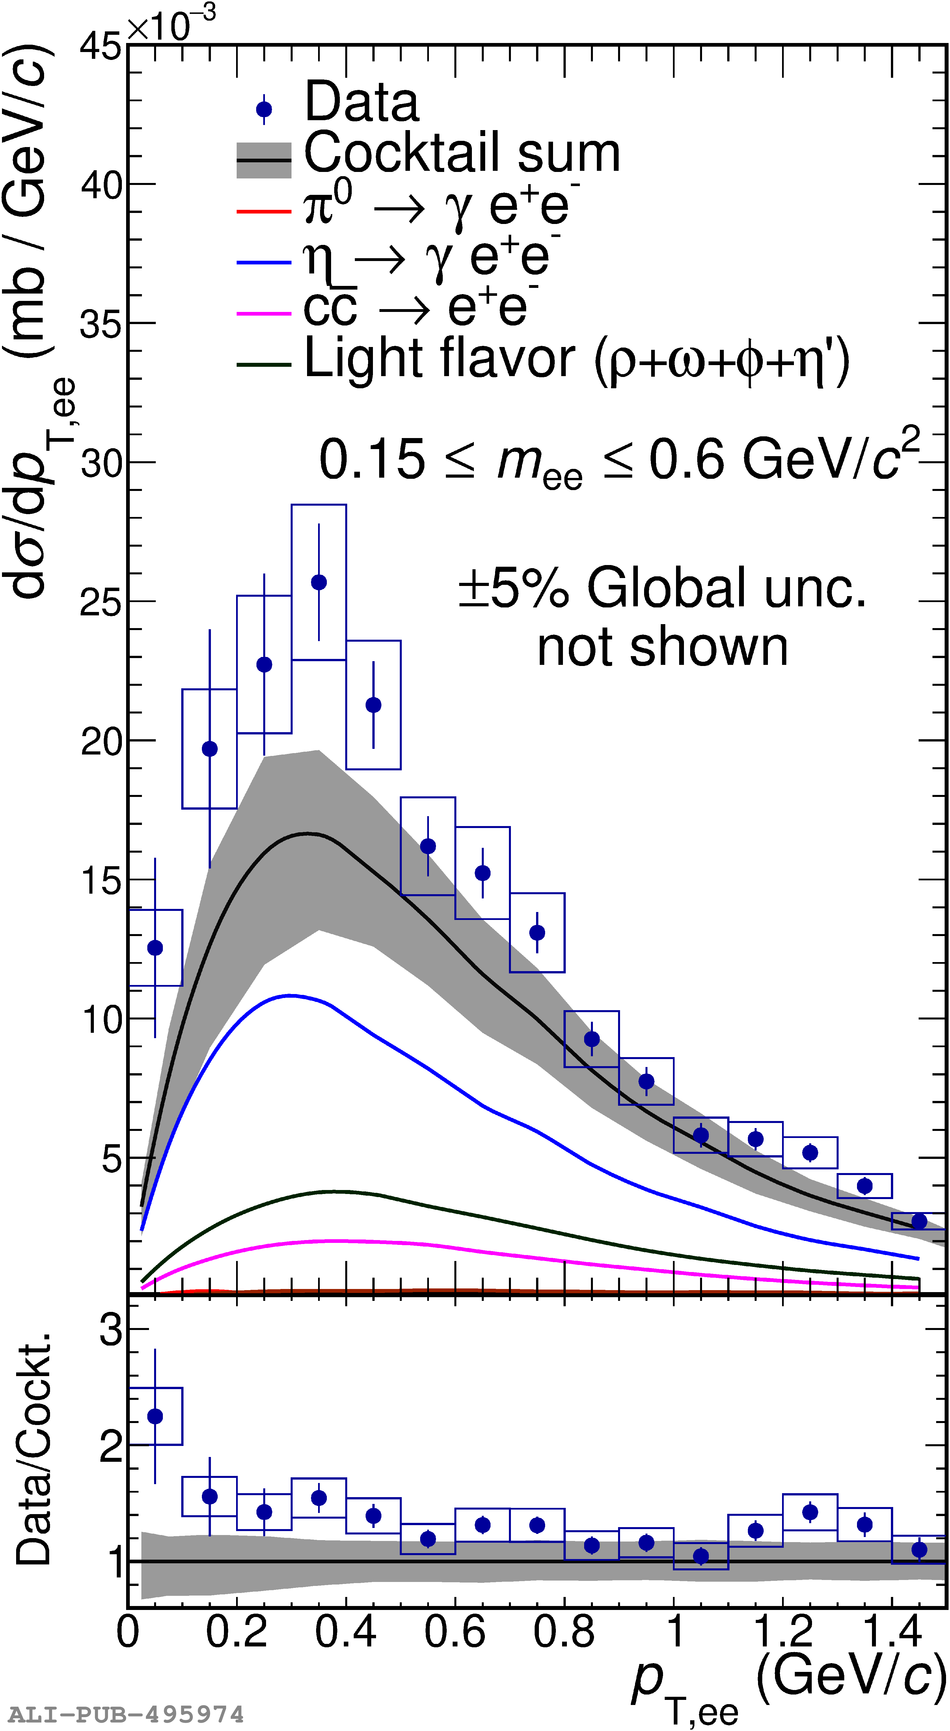 |