Two-particle azimuthal correlations are measured with the ALICE apparatus in pp collisions at $\sqrt{s} = 13$ TeV to explore strangeness- and multiplicity-related effects in the fragmentation of jets and the transition regime between bulk and hard production, probed with the condition that a strange meson (K$^{0}_{\rm S}$) or baryon ($\Lambda$) with transverse momentum $p_{\rm T} > 3$ GeV/c is produced. Azimuthal correlations between kaons or $\Lambda$ hyperons with other hadrons are presented at midrapidity for a broad range of the trigger ($3 <~ p_{\rm T}^{\rm trigg} <~ 20$ GeV/$c$) and associated particle $p_{\rm T}$ (1 GeV/$c$ $<~ p_{\rm T}^{\rm assoc} <~ p_{\rm T}^{\rm trigg}$), for minimum-bias events and as a function of the event multiplicity. The near- and away-side peak yields are compared for the case of either K$^{0}_{\rm S}$ or $\Lambda$($\overline{\Lambda}$) being the trigger particle with that of inclusive hadrons (a sample dominated by pions). In addition, the measurements are compared with predictions from PYTHIA 8 and EPOS LHC event generators.
Eur. Phys. J. C 81 (2021) 945
HEP Data
e-Print: arXiv:2107.11209 | PDF | inSPIRE
CERN-EP-2021-146
Figure group
Figure 1
An example of the raw same-event (left), mixed-event (middle) and final (mixed-event scaled, right) two-dimensional correlation function for \K-hadrons. The correlation functions were scaled with 1/1000 for better visibility. The plateau in the left and middle plot is caused by non-equal selection in $\eta$ of the trigger and associated particle. | 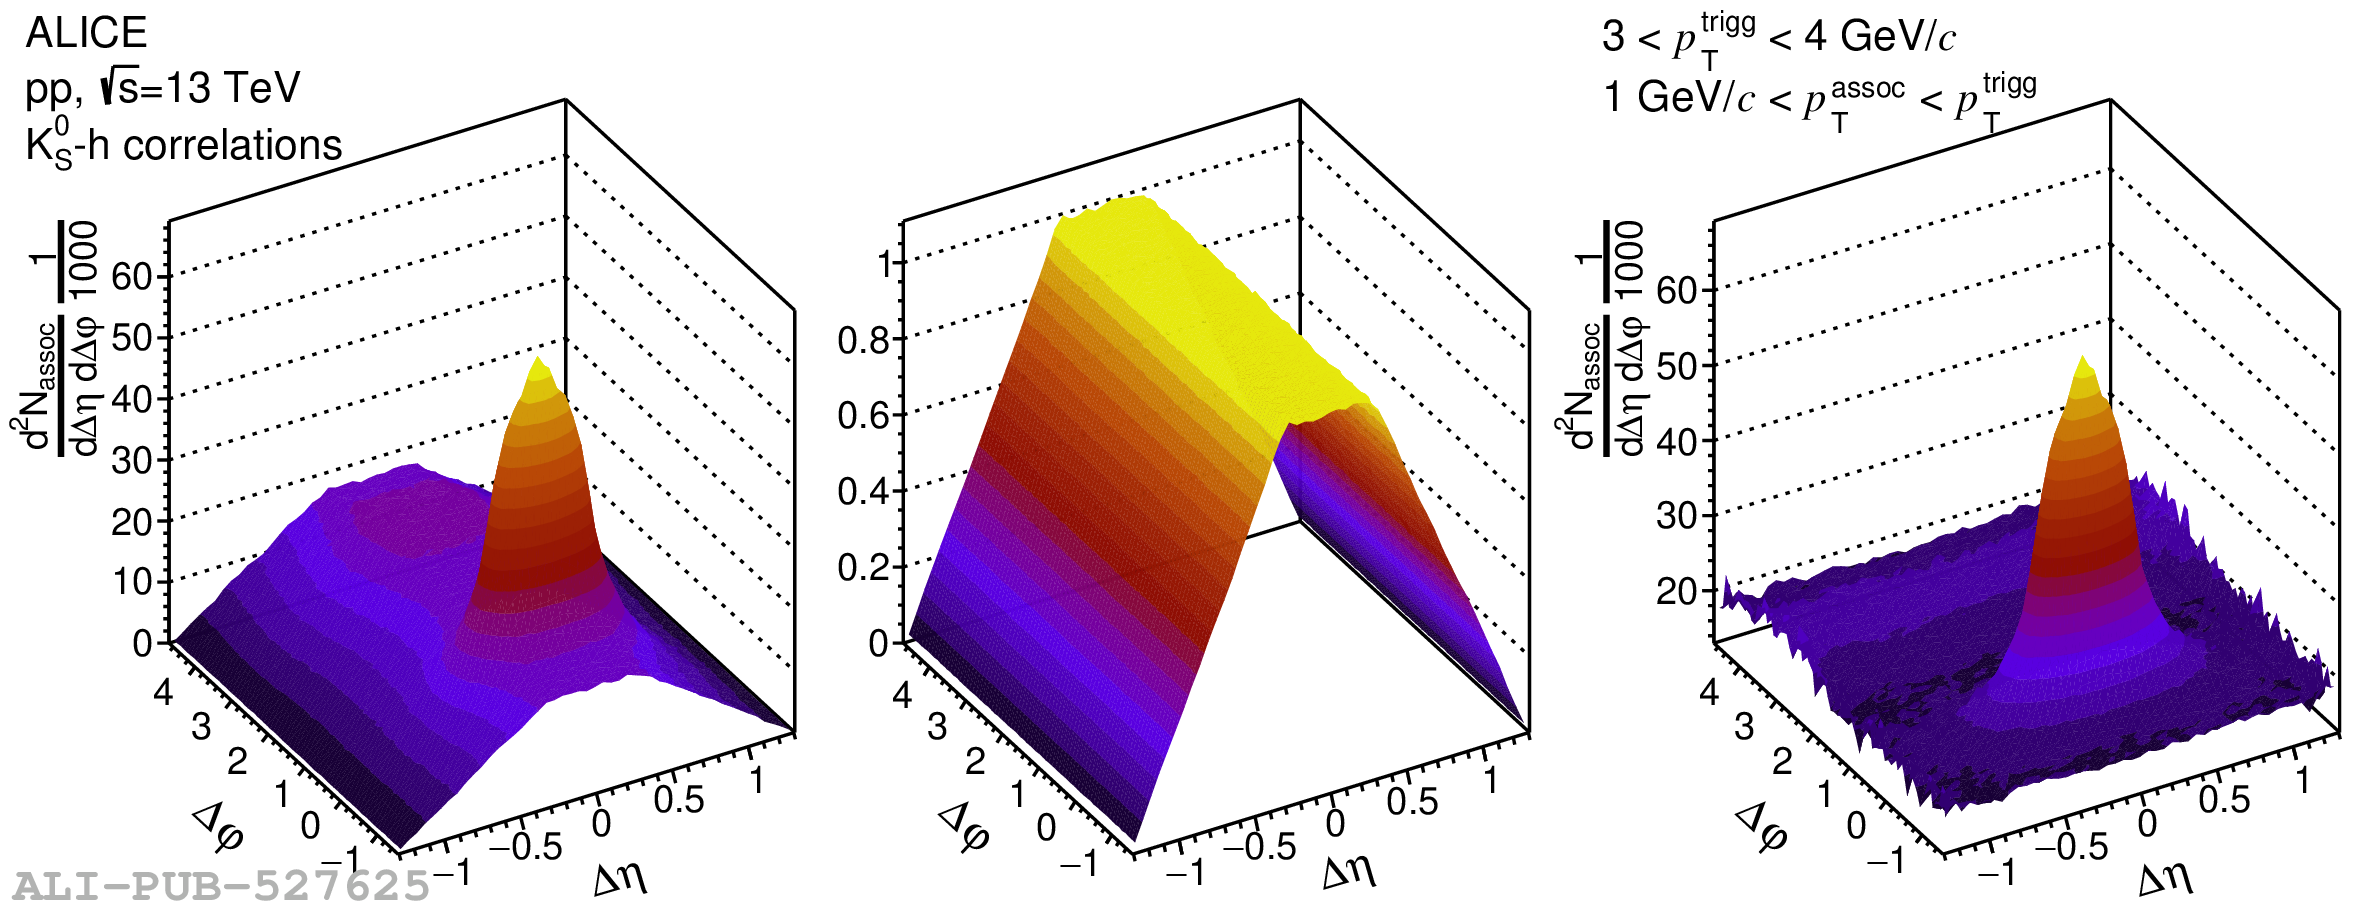 |
Figure 2
\dphi projection of the h-h (left), \K-h (middle) and \lam-h (right) correlation functions compared with MC event generators for low (top) and high (bottom) \pttrig. Error bars and colored boxes represent statistical and systematic uncertainties, respectively. The data are compared with MC event generators. | 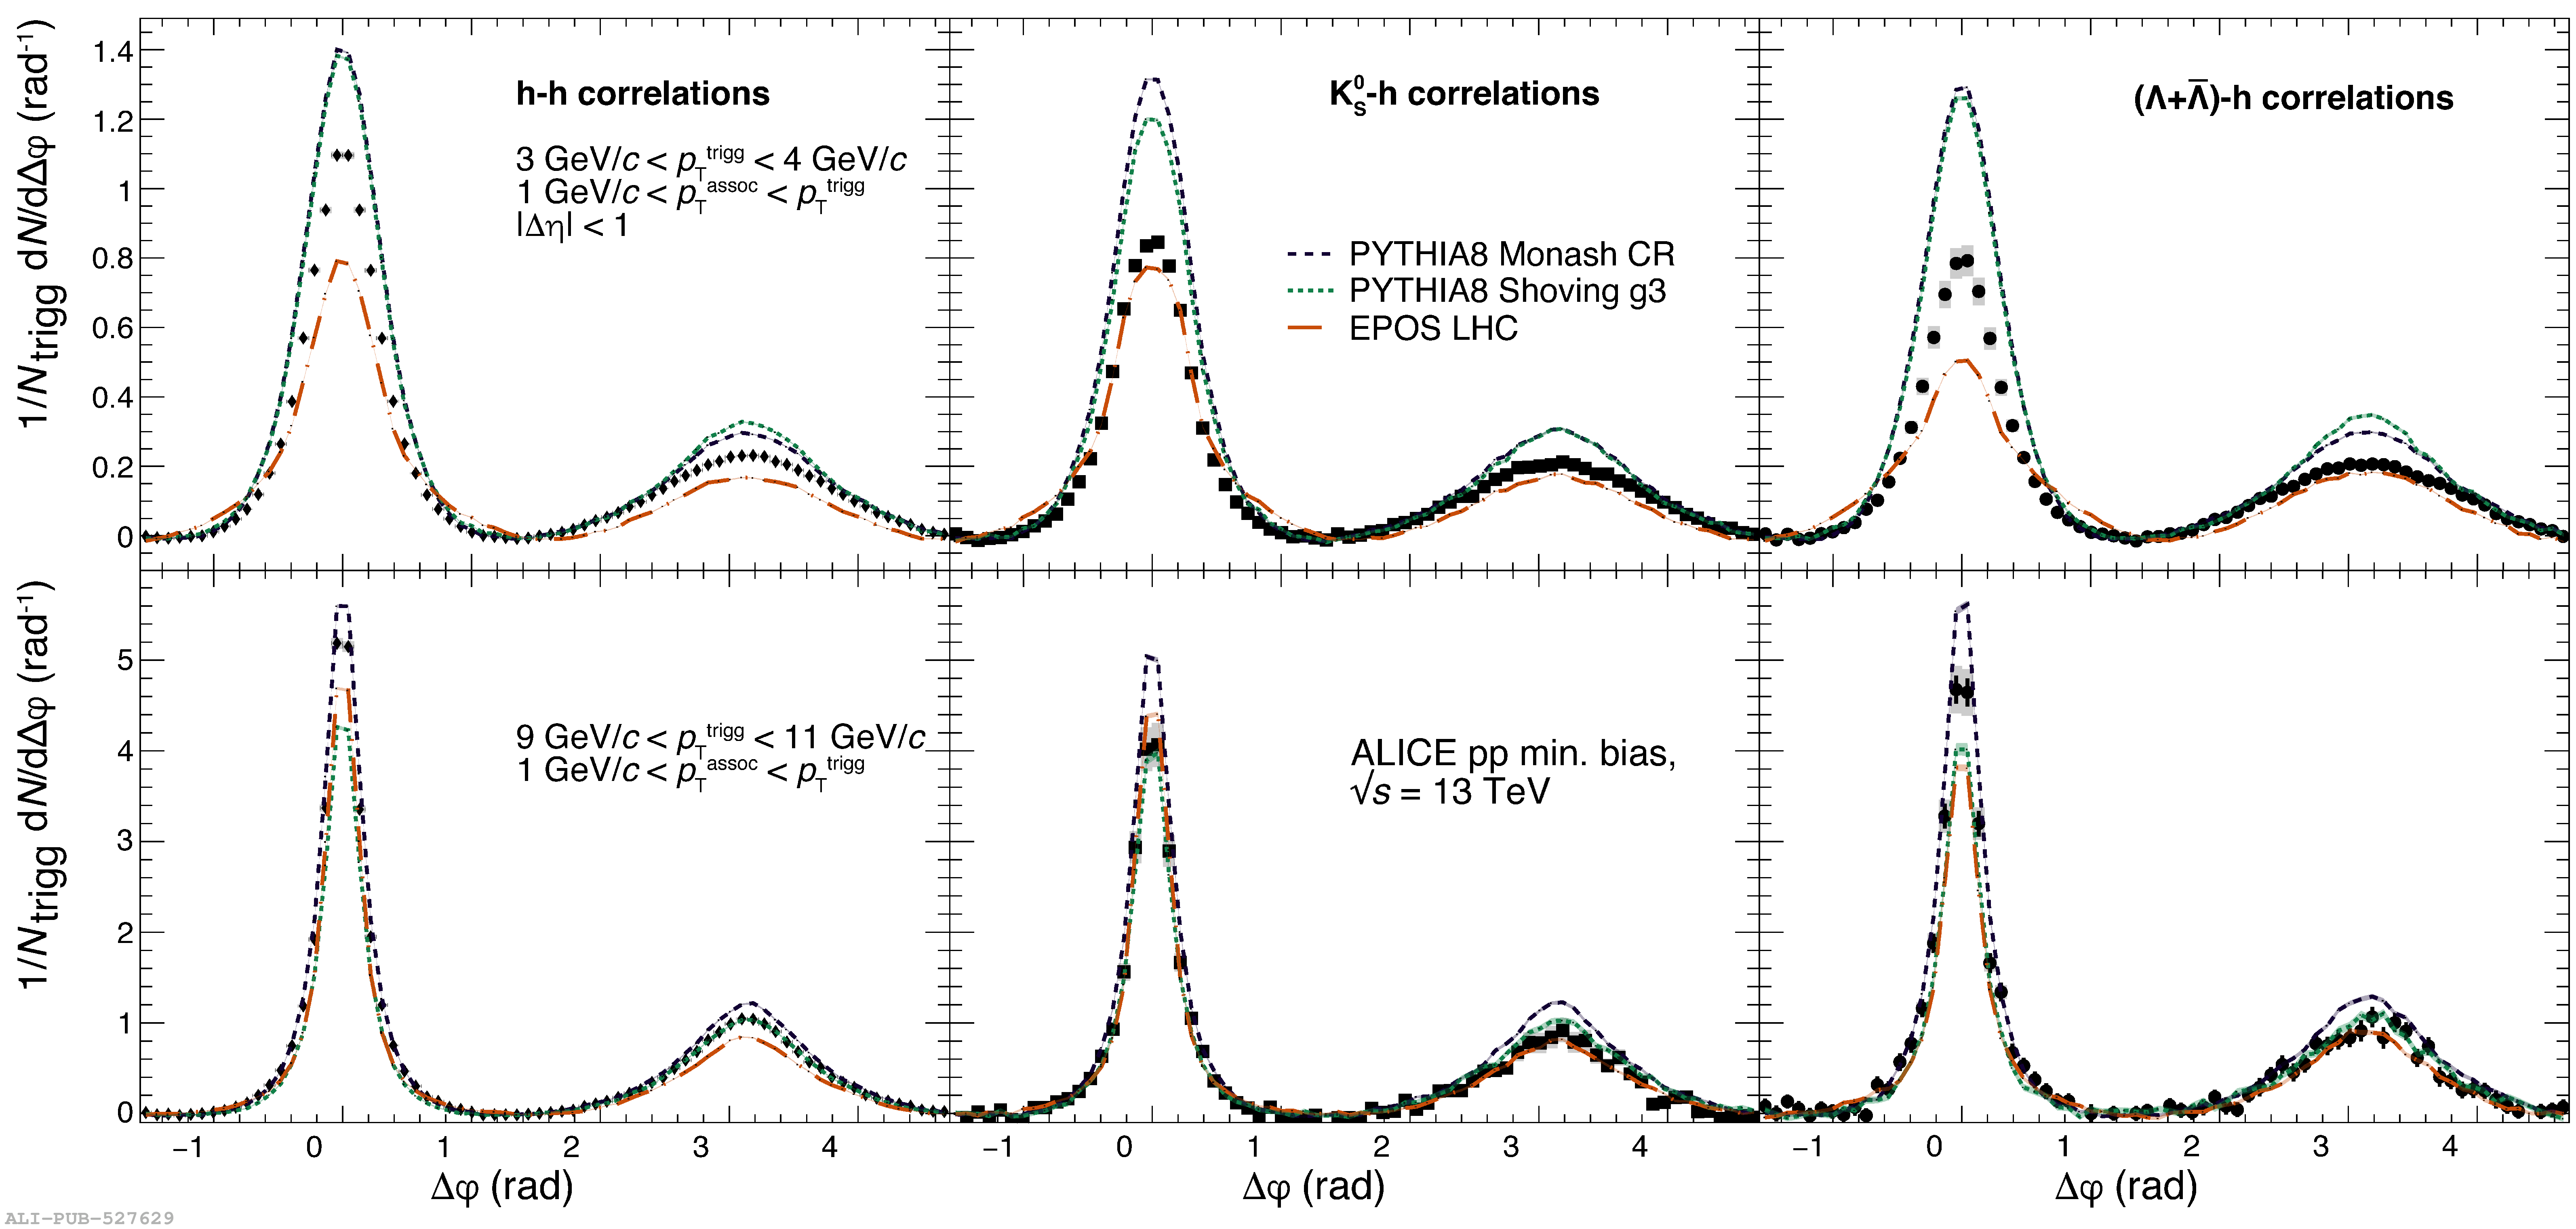 |
Figure 3
Per-trigger yields of h-h (left), \K-h (middle) and \lam-h (right) correlation functions as a function of \pttrig on the near-side (upper row) and away-side (lower row) for different multiplicity classes. For visibility, the values in the various event classes are scaled with the factors indicated in the legend. Error bars and colored boxes representstatistical and systematic uncertainties, respectively, which are in most cases within the data points. | 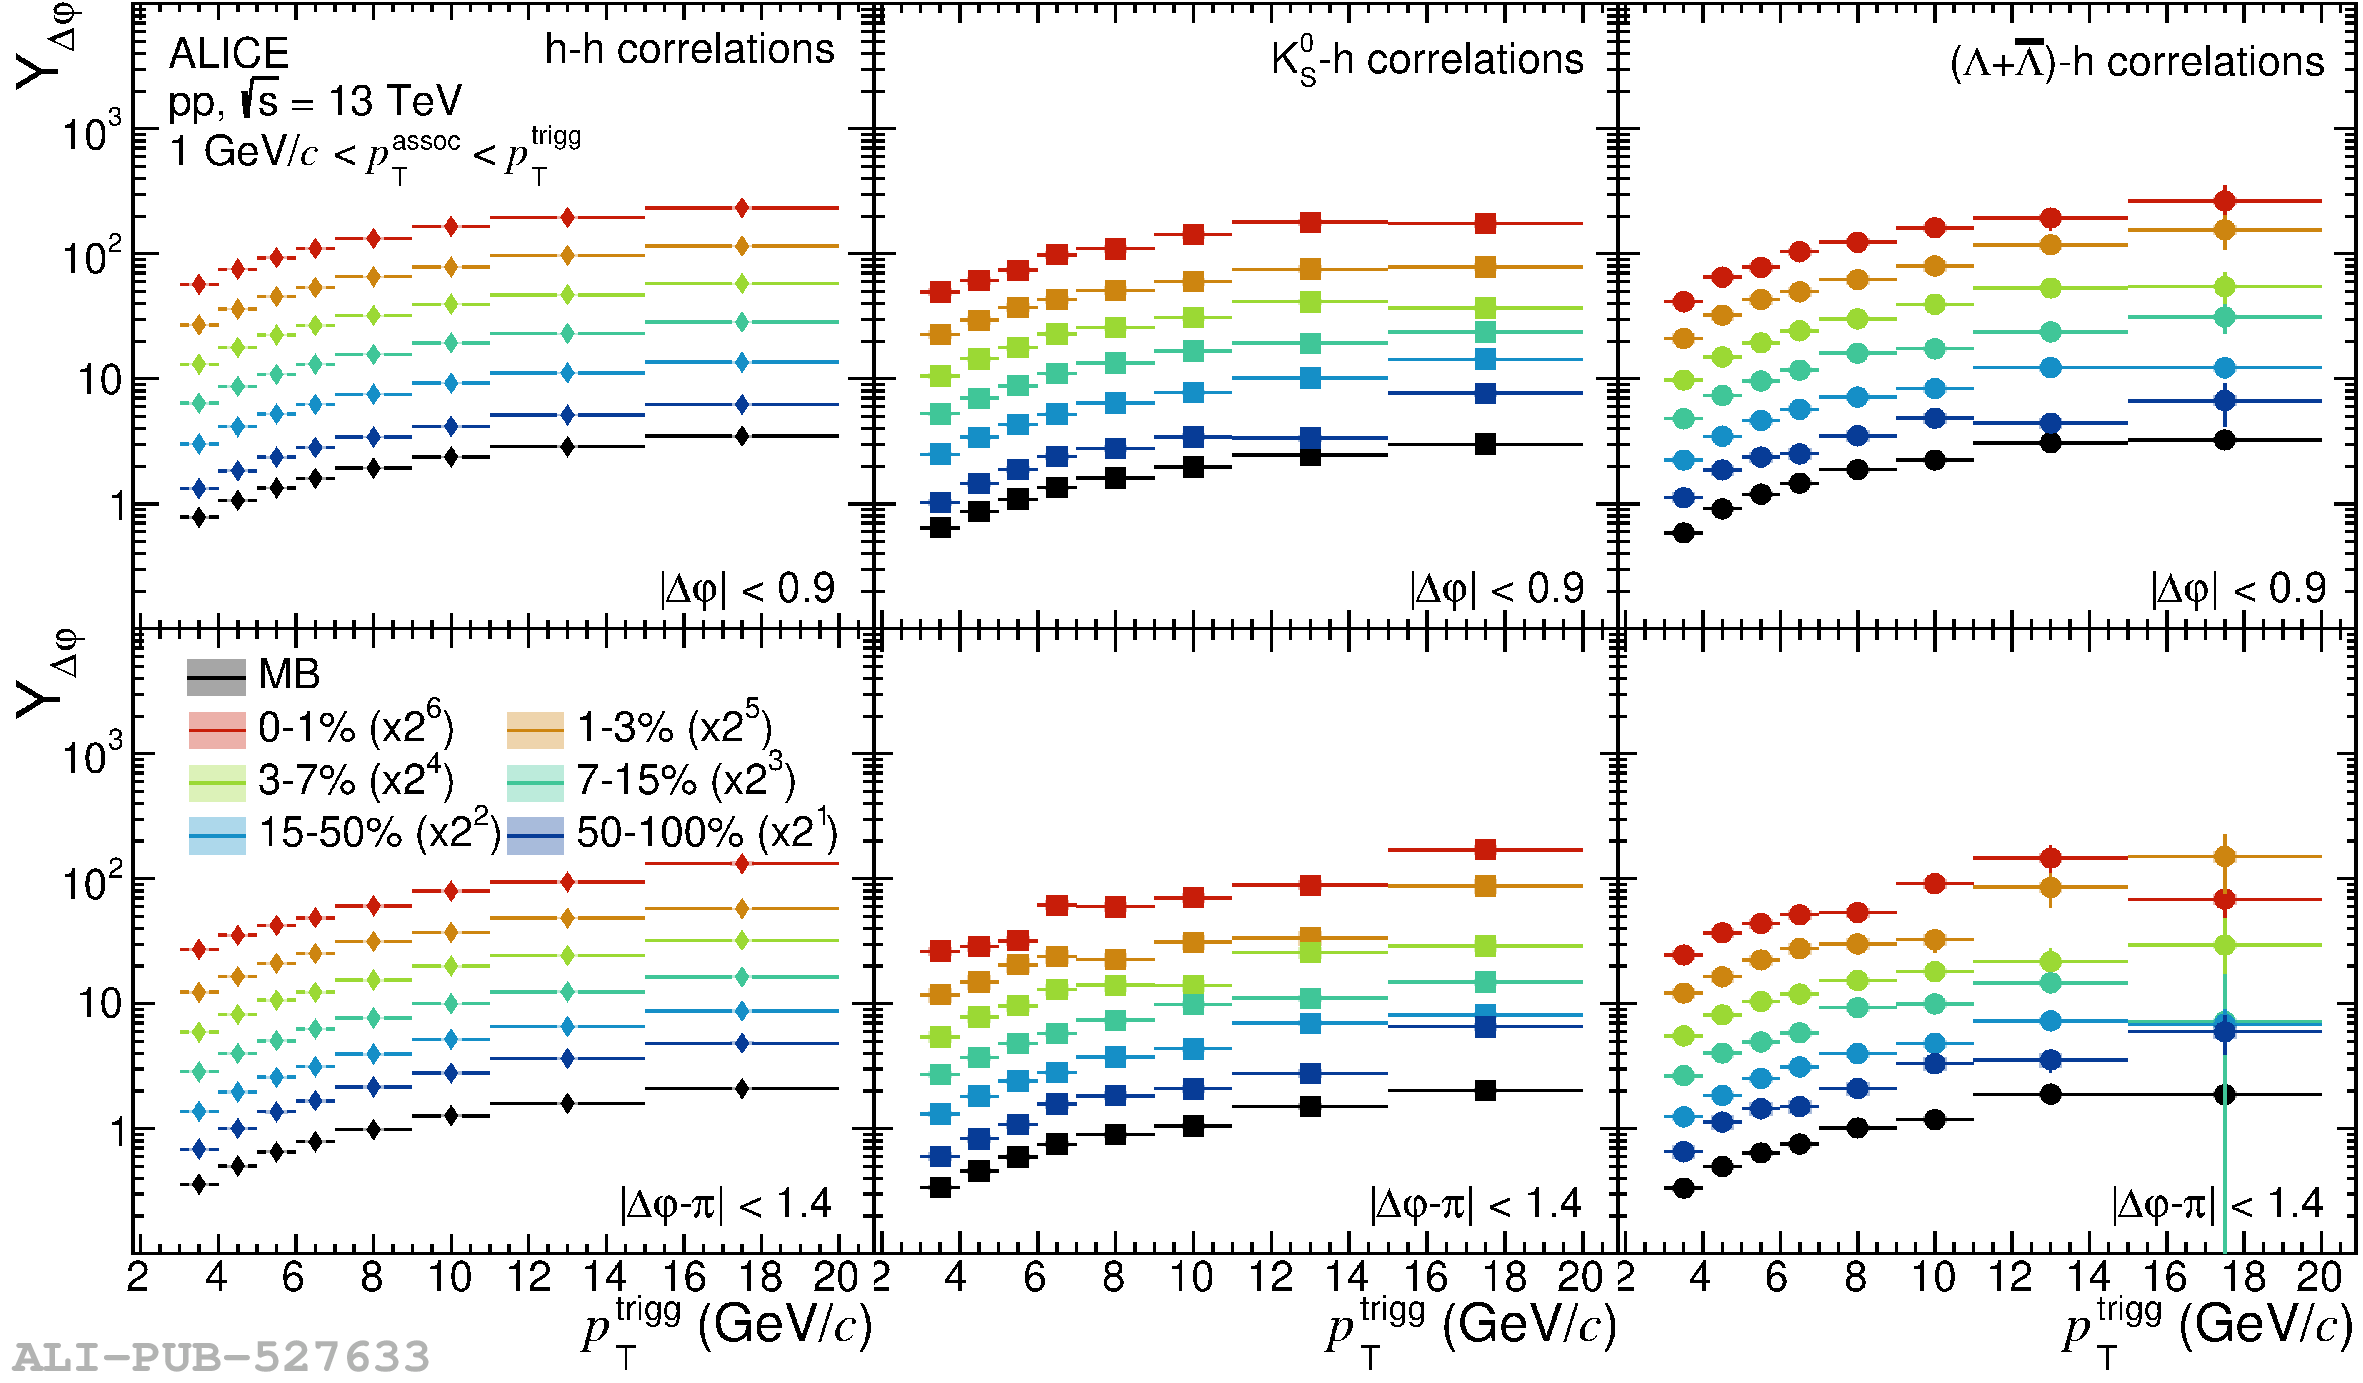 |
Figure 4
Ratio of the per-trigger yields in different multiplicity classes to the corresponding minimum bias yield for h-h (left), \K-h (middle) and \lam-h (right) correlations on the near-side (upper row) and away-side (lower row). Error bars and colored boxes representstatistical and systematic uncertainties, respectively. | 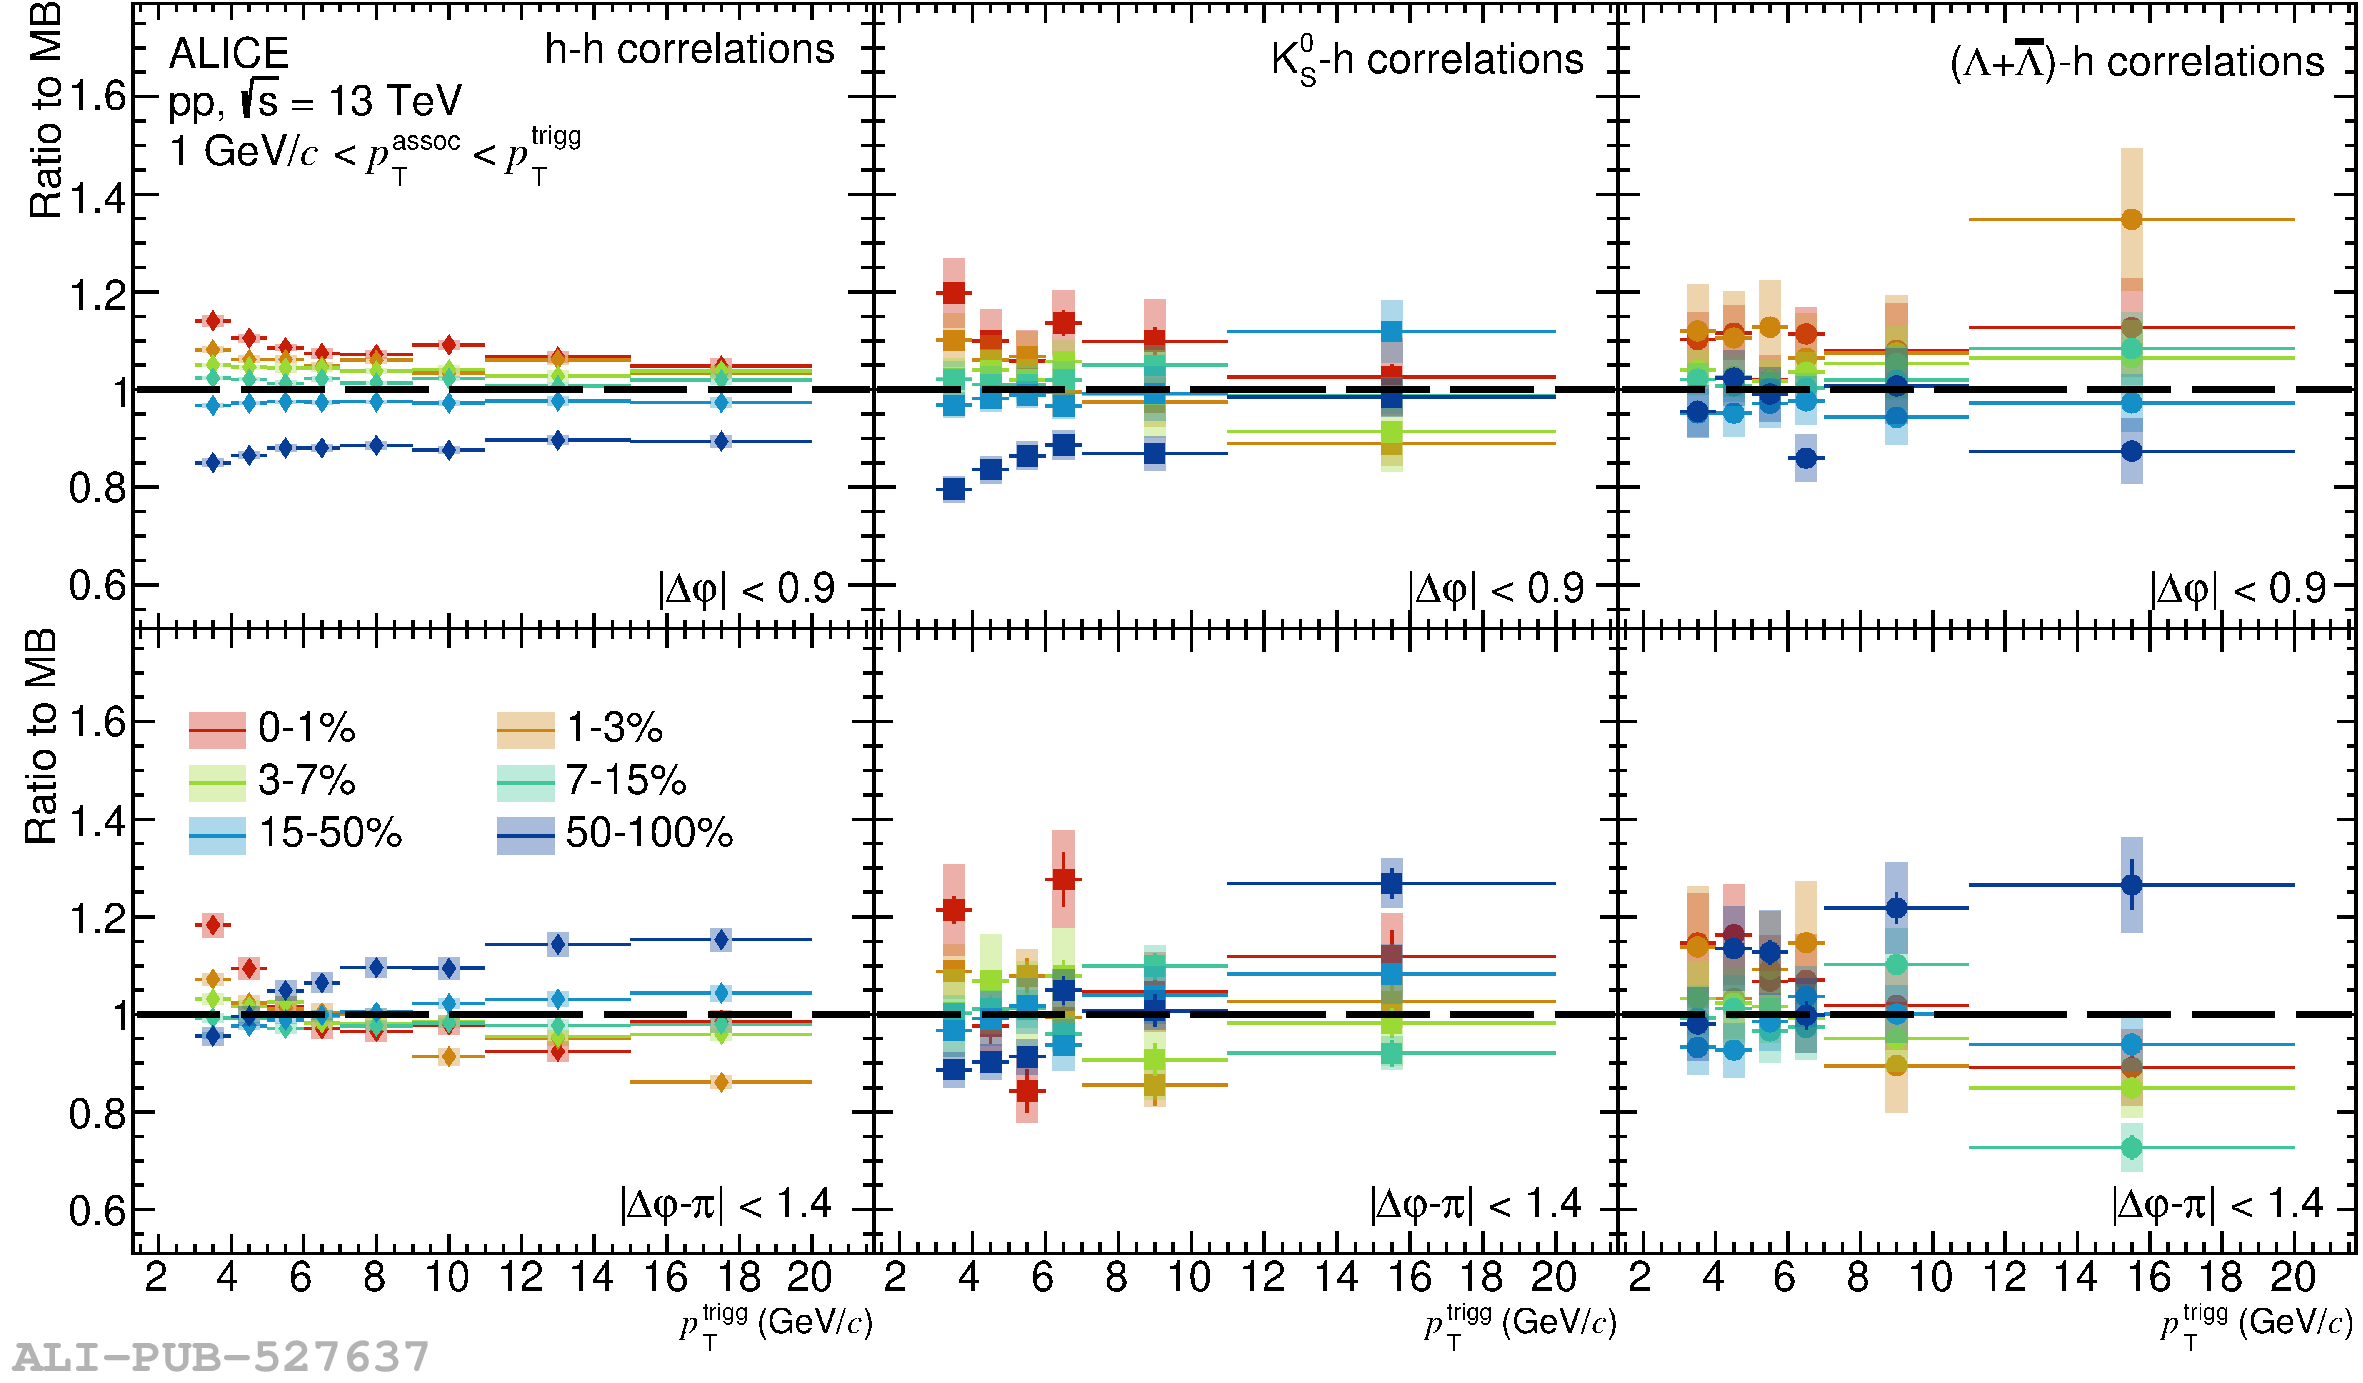 |
Figure 5
Per-trigger yields of h-h (left), \K-h (middle) and \lam-h (right) correlation functions as a function of \ptassoc on the near-side (upper row) and away-side (lower row) for different \pttrig intervals. Error bars and colored boxes represent statistical and systematic uncertainties, respectively. | 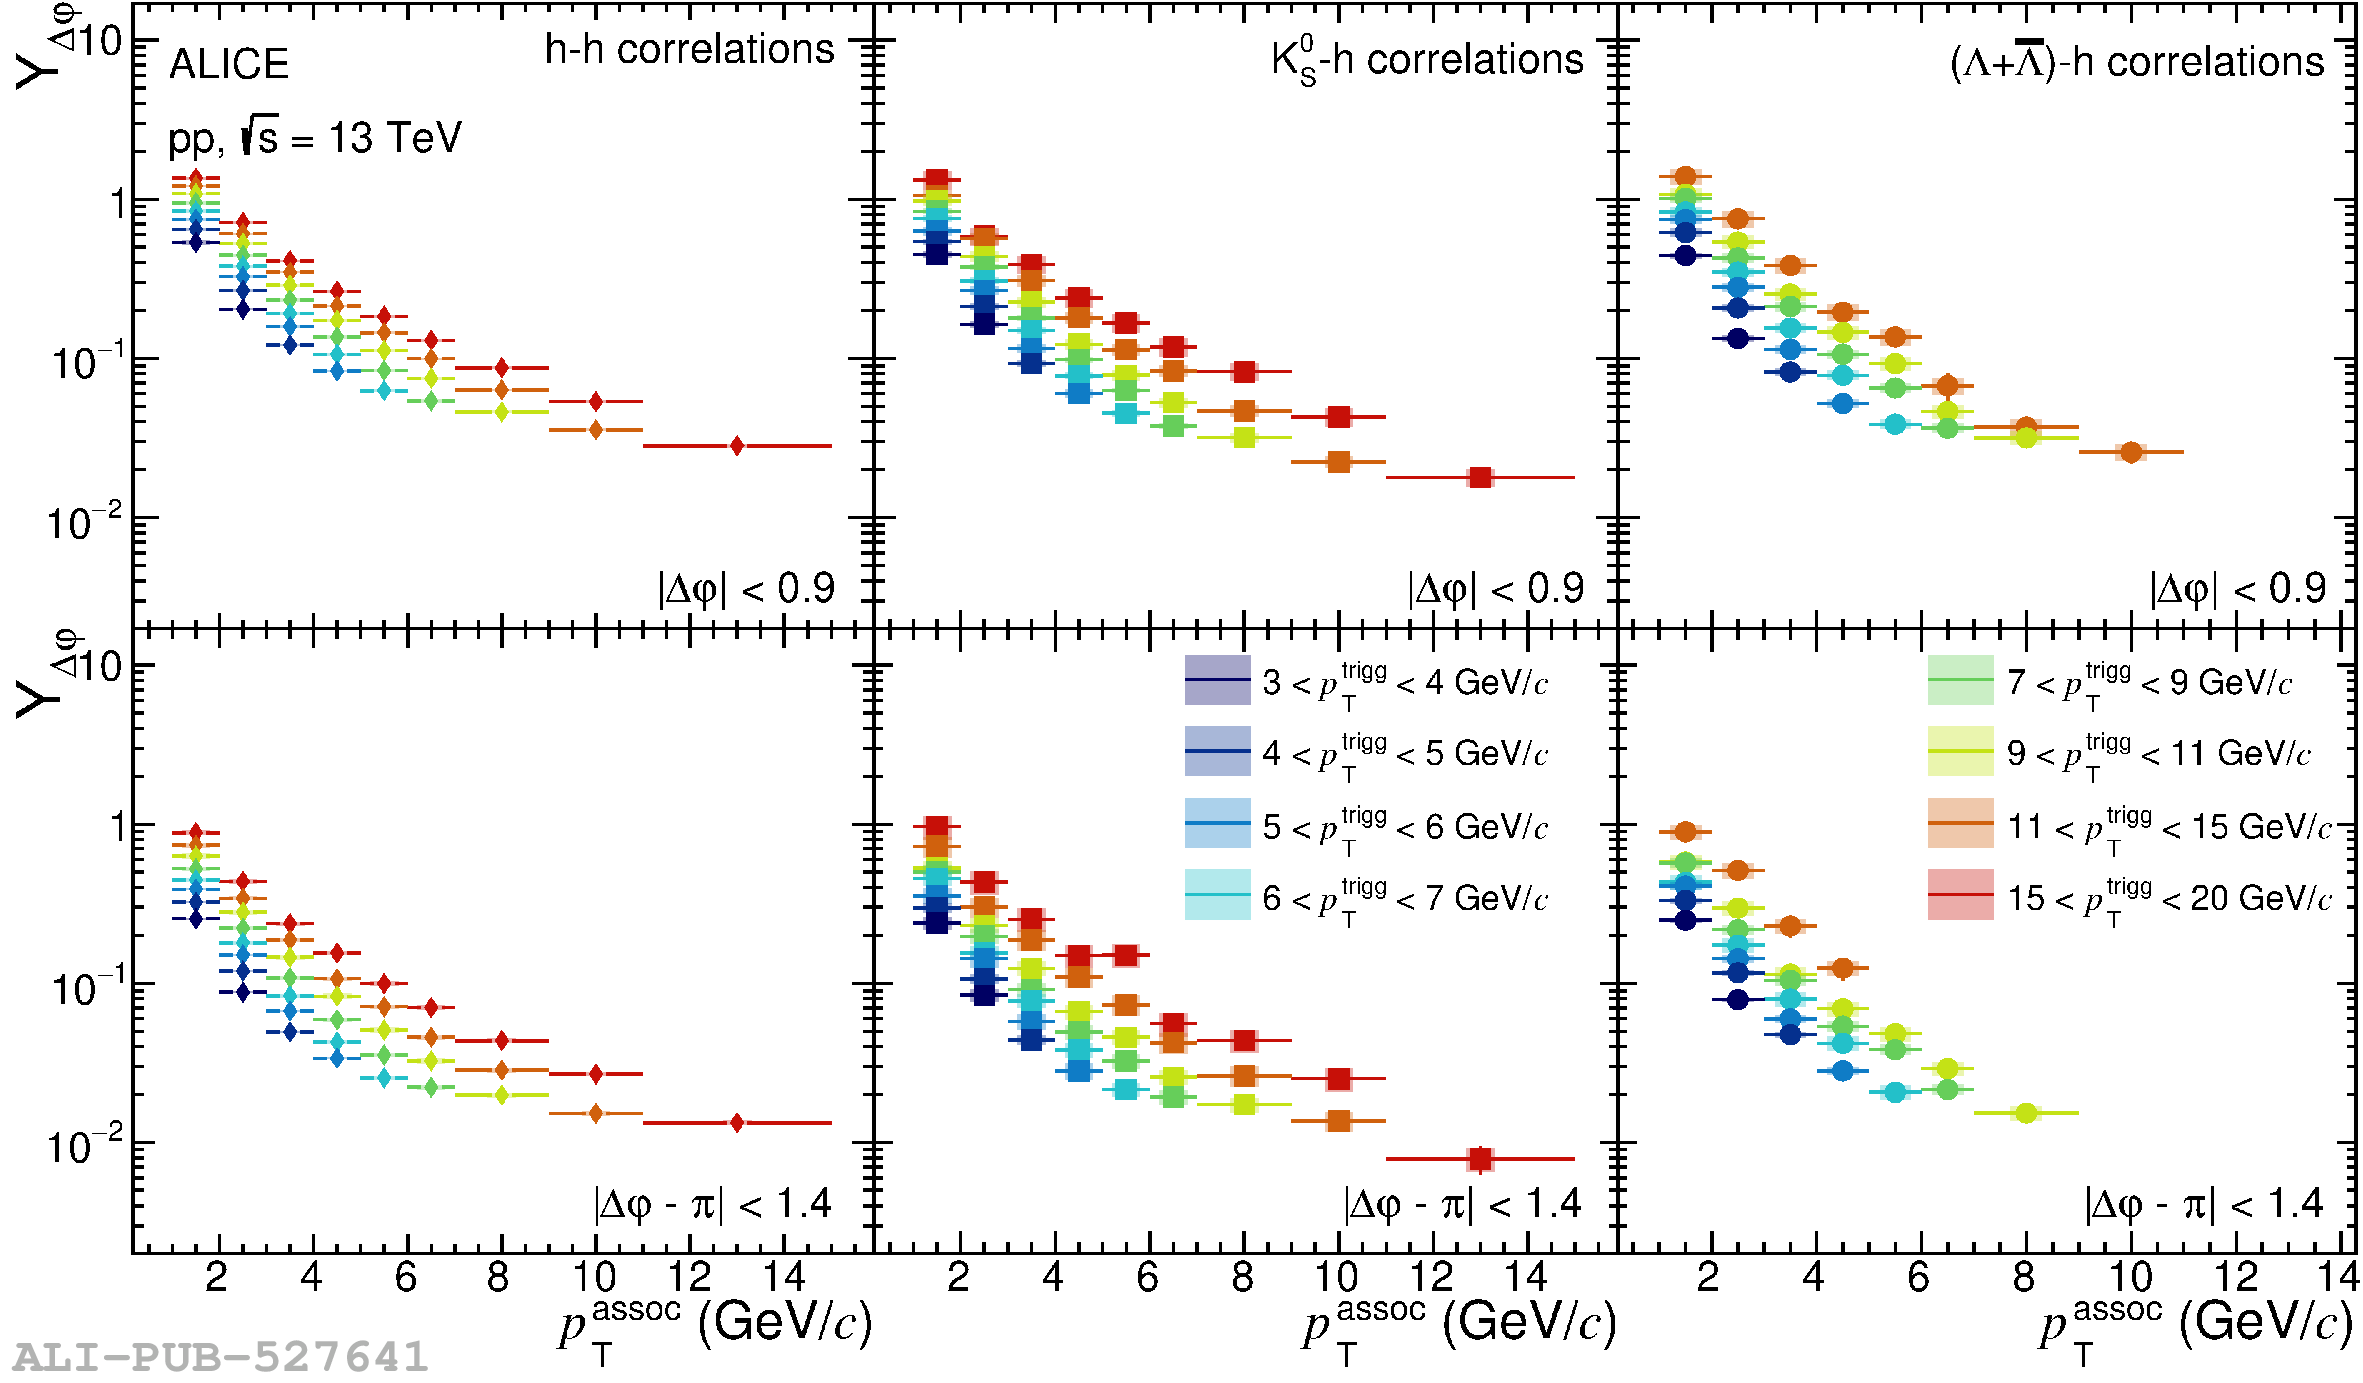 |
Figure 6
Models to data ratio of integrated per-trigger yields as a function of \pttrig for different multiplicity classes on the near-side (top panels) and away-side (bottom panels) for three MC event generators: PYTHIA8 Monash with colour re-connection (left), PYTHIA8 with shoving (middle) and EPOS LHC (right). Note, for plotting purpose, the arbitrary shifts for the vertical axis are given in the legend. The bands represent combined systematic and statistical uncertainties from data and models. |  |
Figure 7
Models to data ratio of integrated per-trigger yields for minimum bias collisions as a function of \ptassoc for different \pttrig intervals on the near-side (top panels) and away-side (bottom panels) for three MC models: PYTHIA8 Monash with colour re-connection (left), PYTHIA8 with shoving (middle) and EPOS LHC (right). Note that for plotting purpose, the arbitrary shifts for the vertical axis are given in the legend. The bands represent combined systematical and statistical uncertainties for data and statistical for models. | 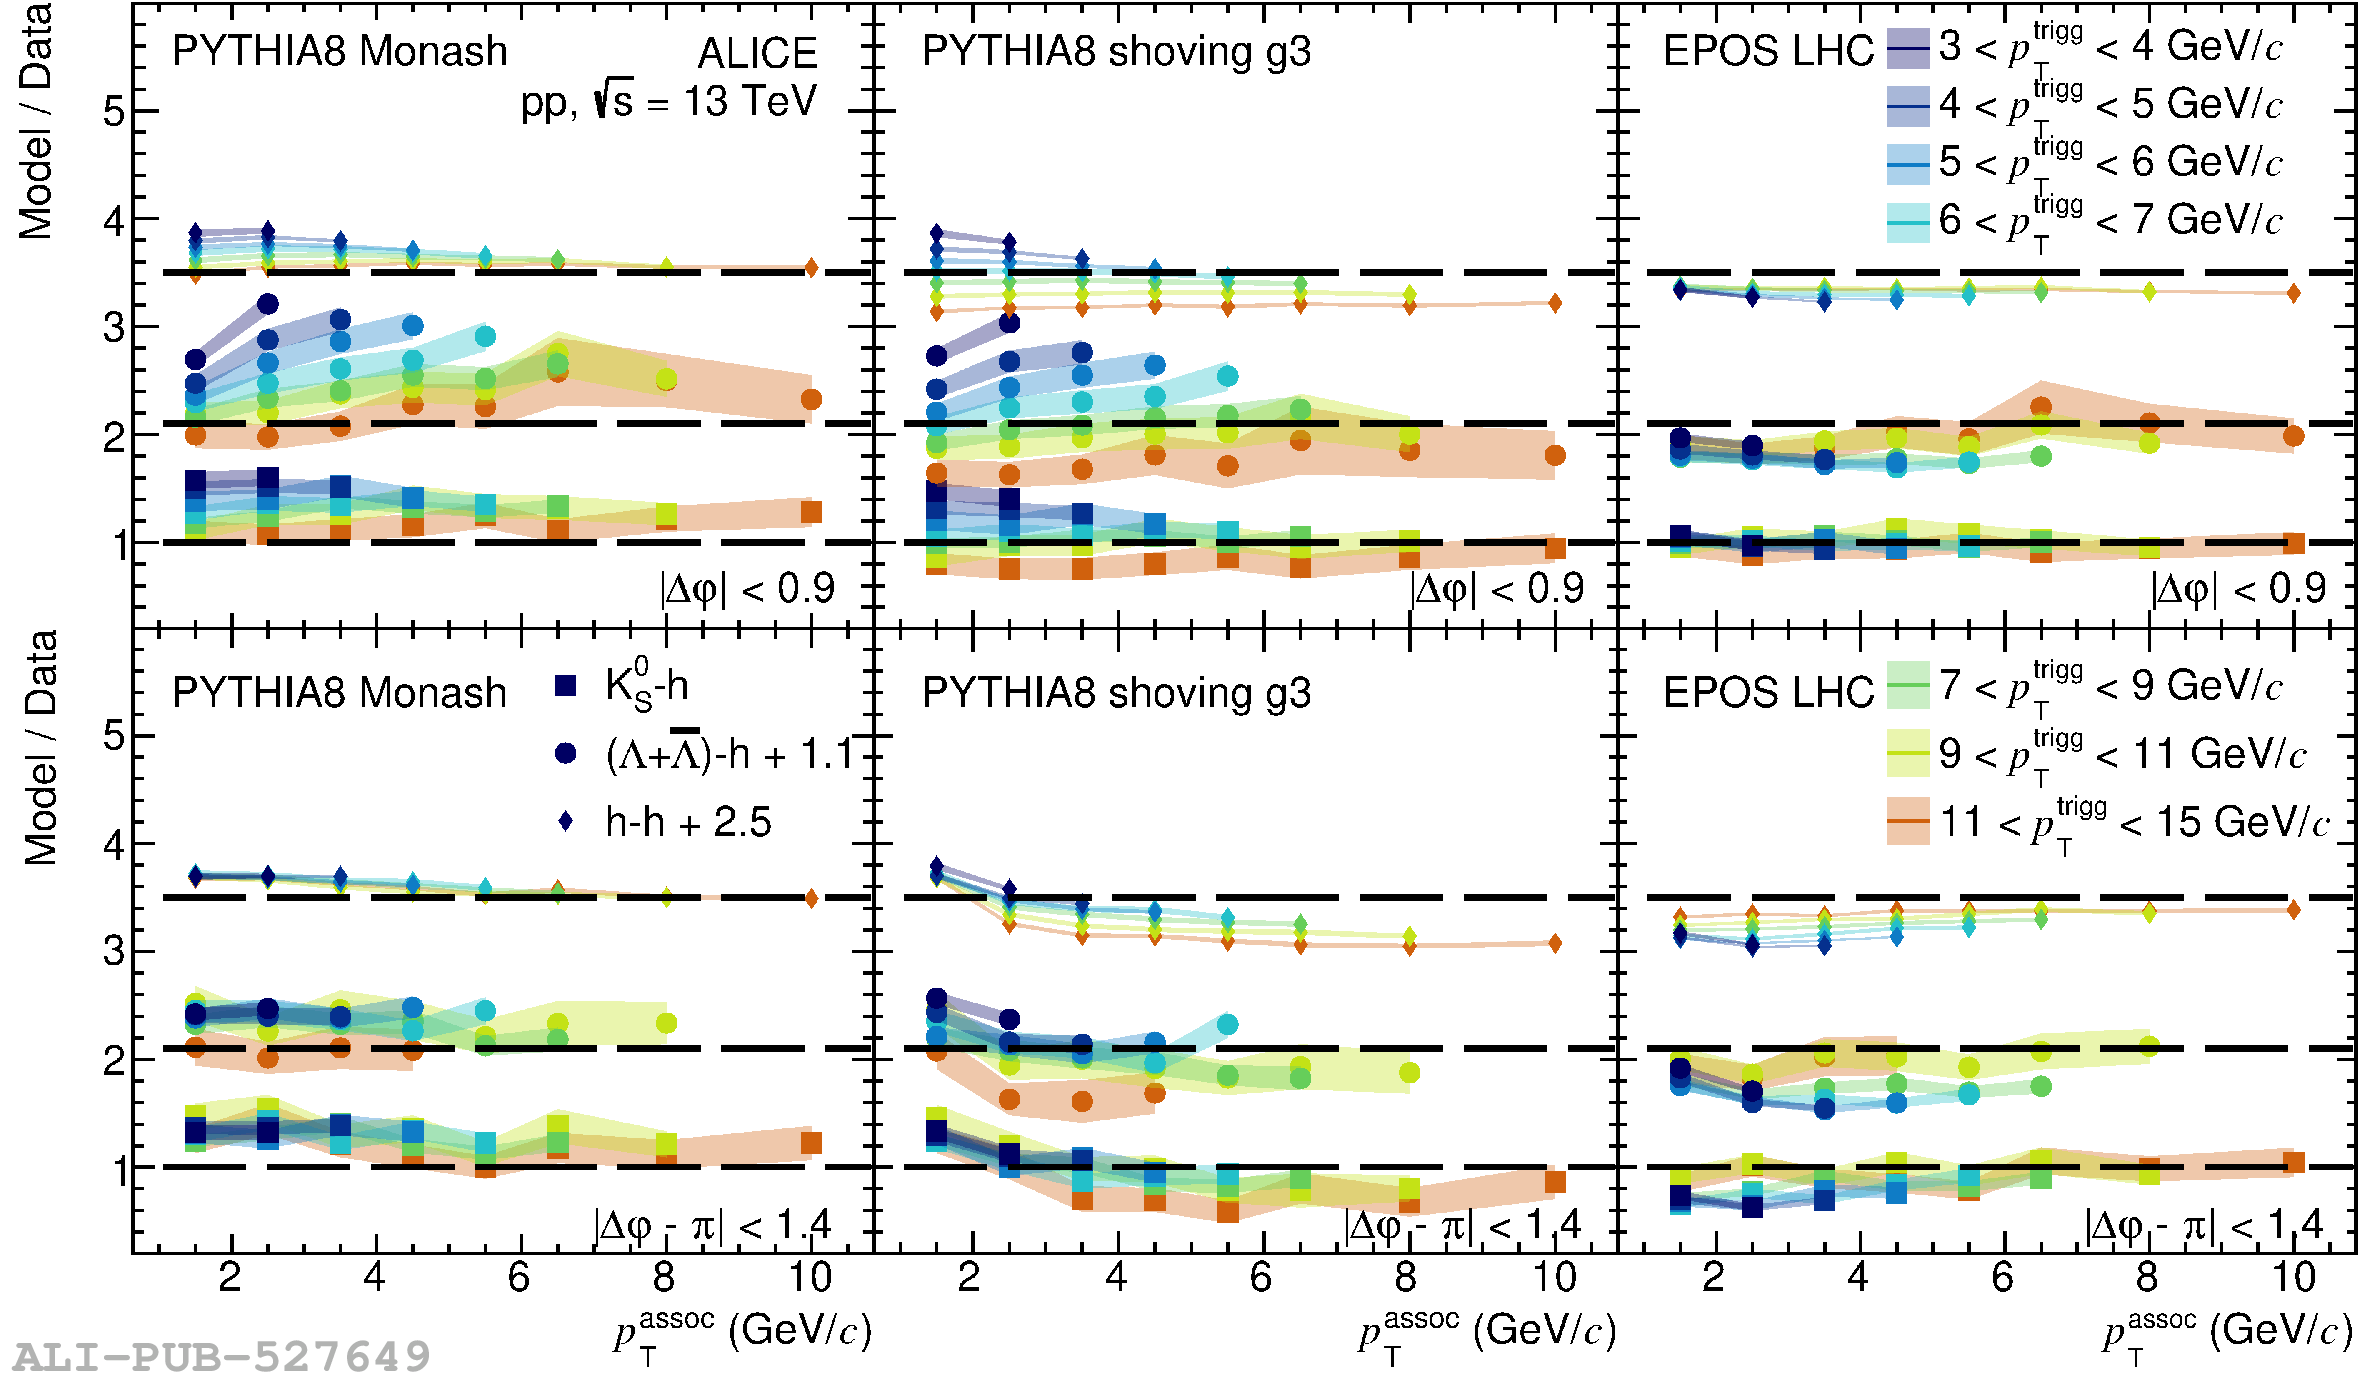 |
Figure 8
Ratios of integrated per-trigger yield of \K-h (left column) or \lam-h (right column) to h-h as a function of \pttrig, for the near-side in the left plot and for the away-side in the right plot, for different event multiplicity classes. Error bars and colored boxes represent statistical and systematic uncertainties, respectively. The bands around model curves stand for their statistical uncertainty. | 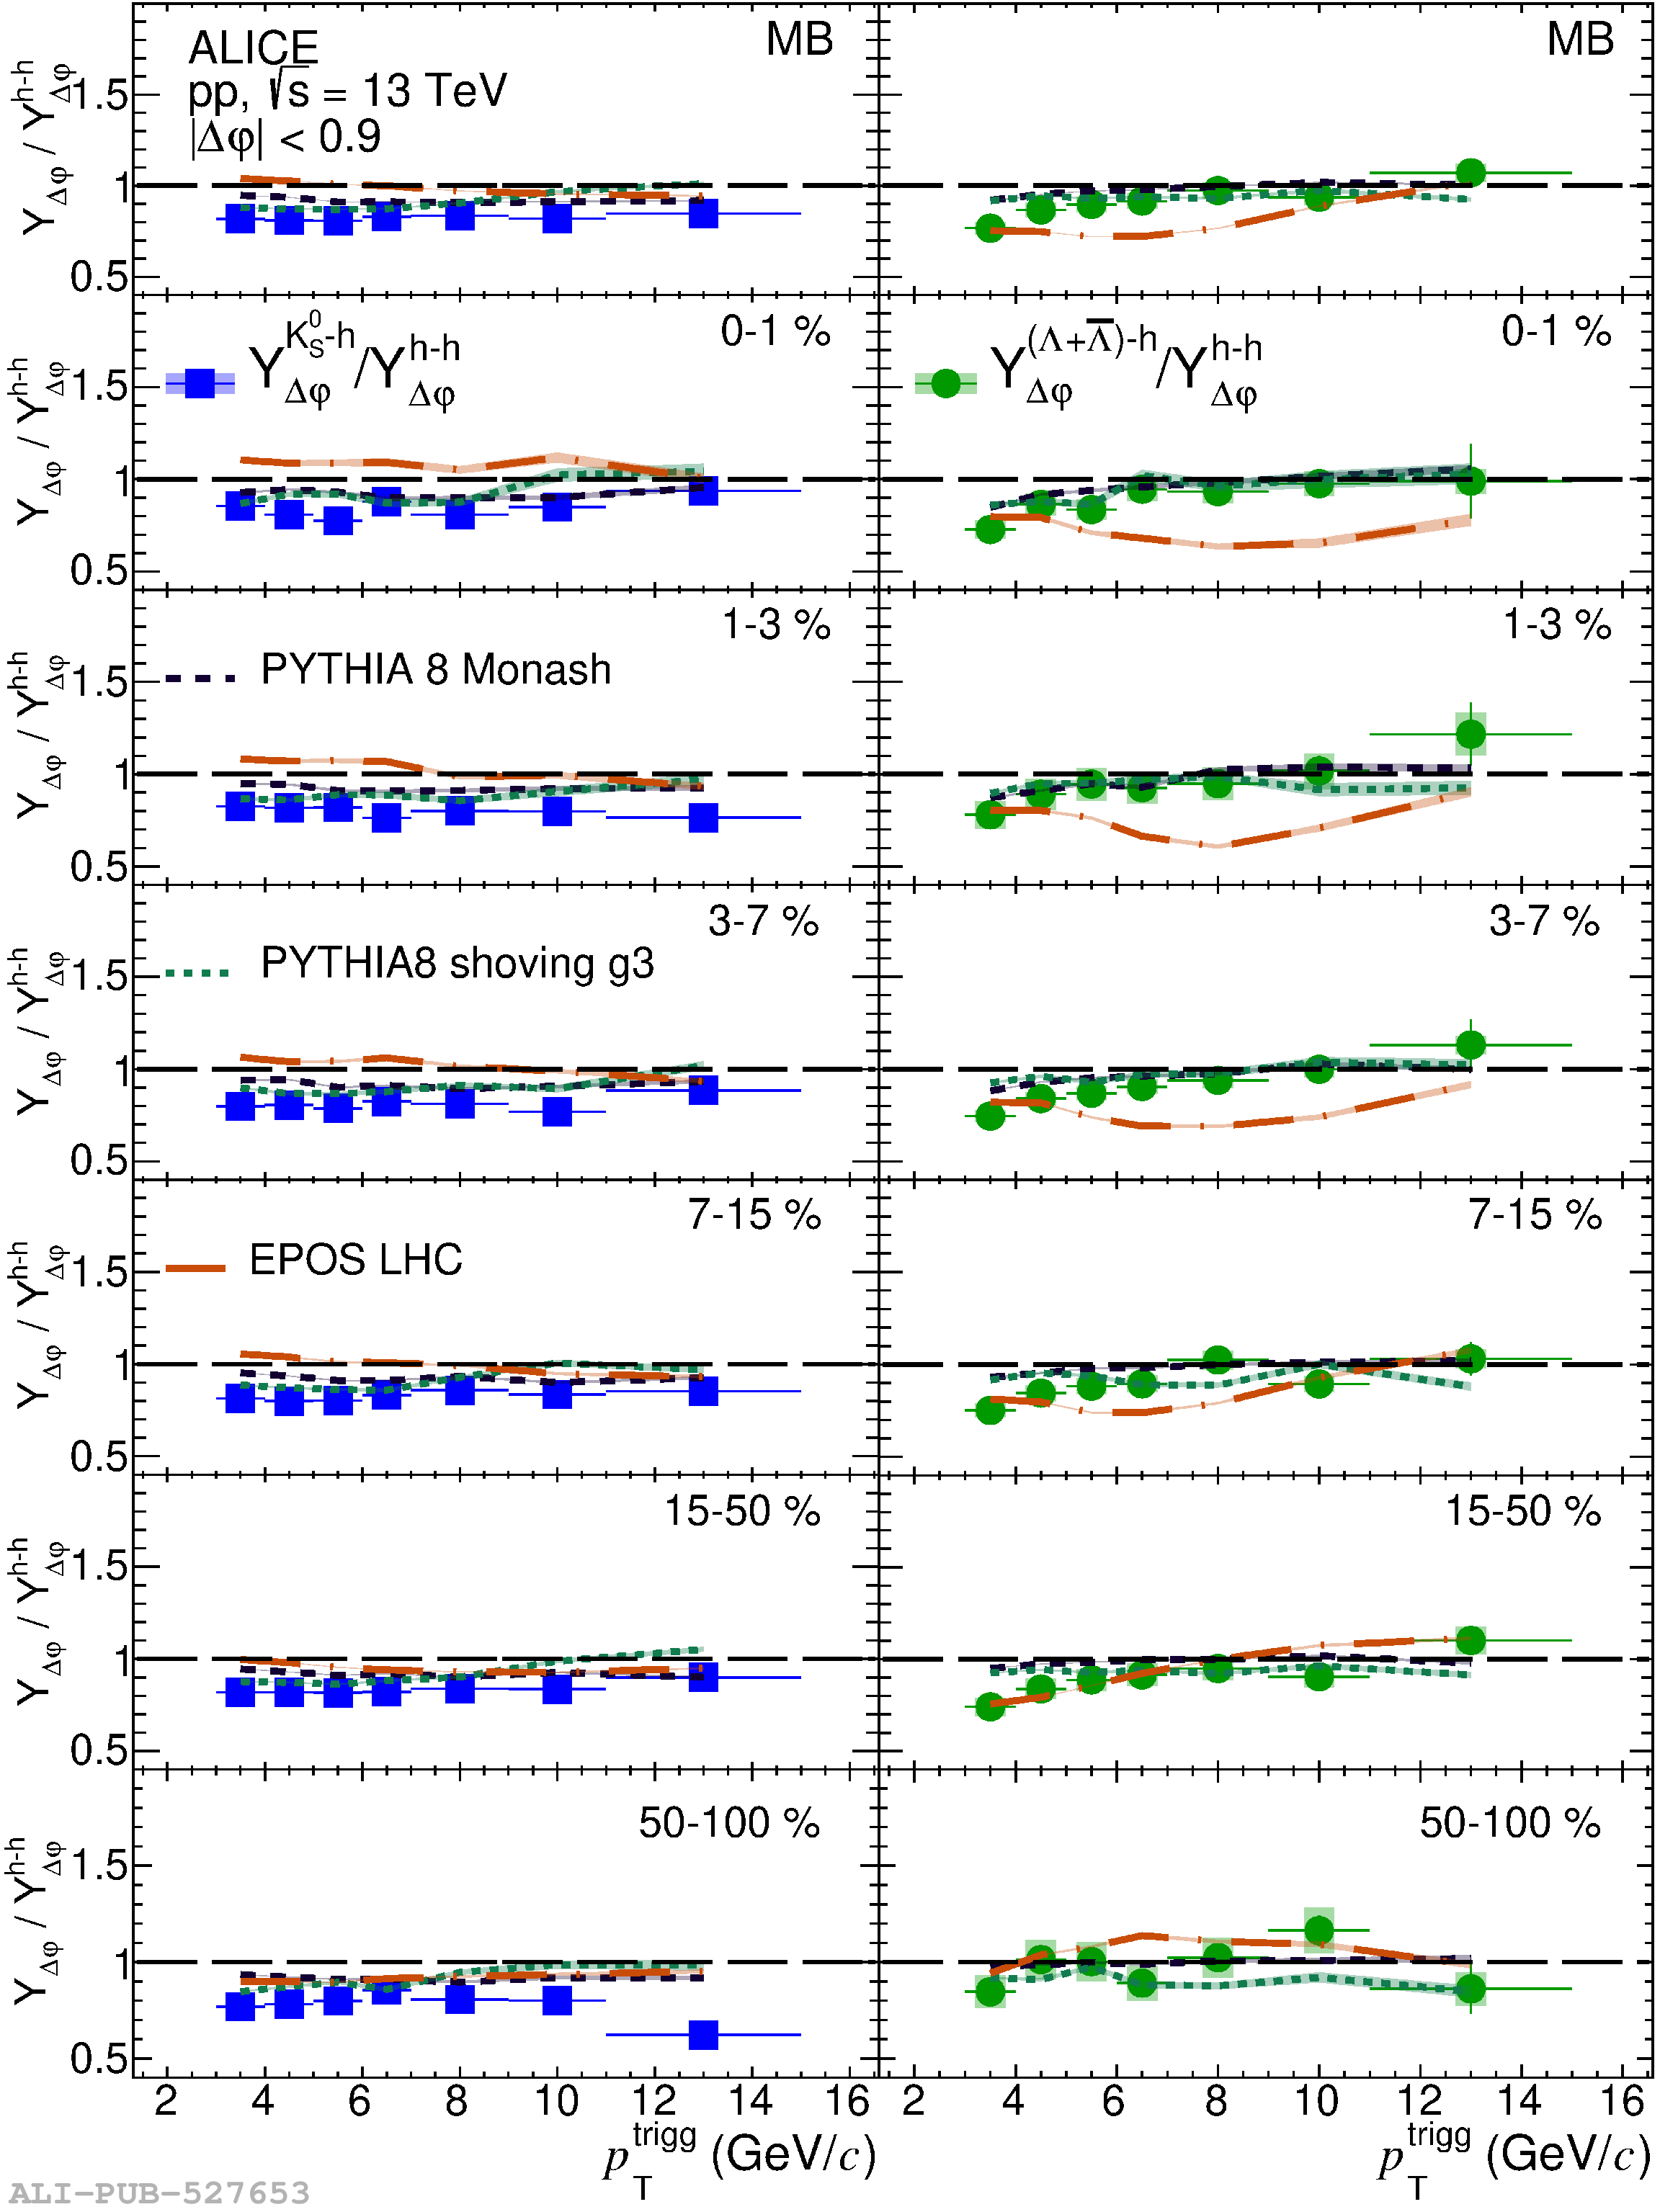 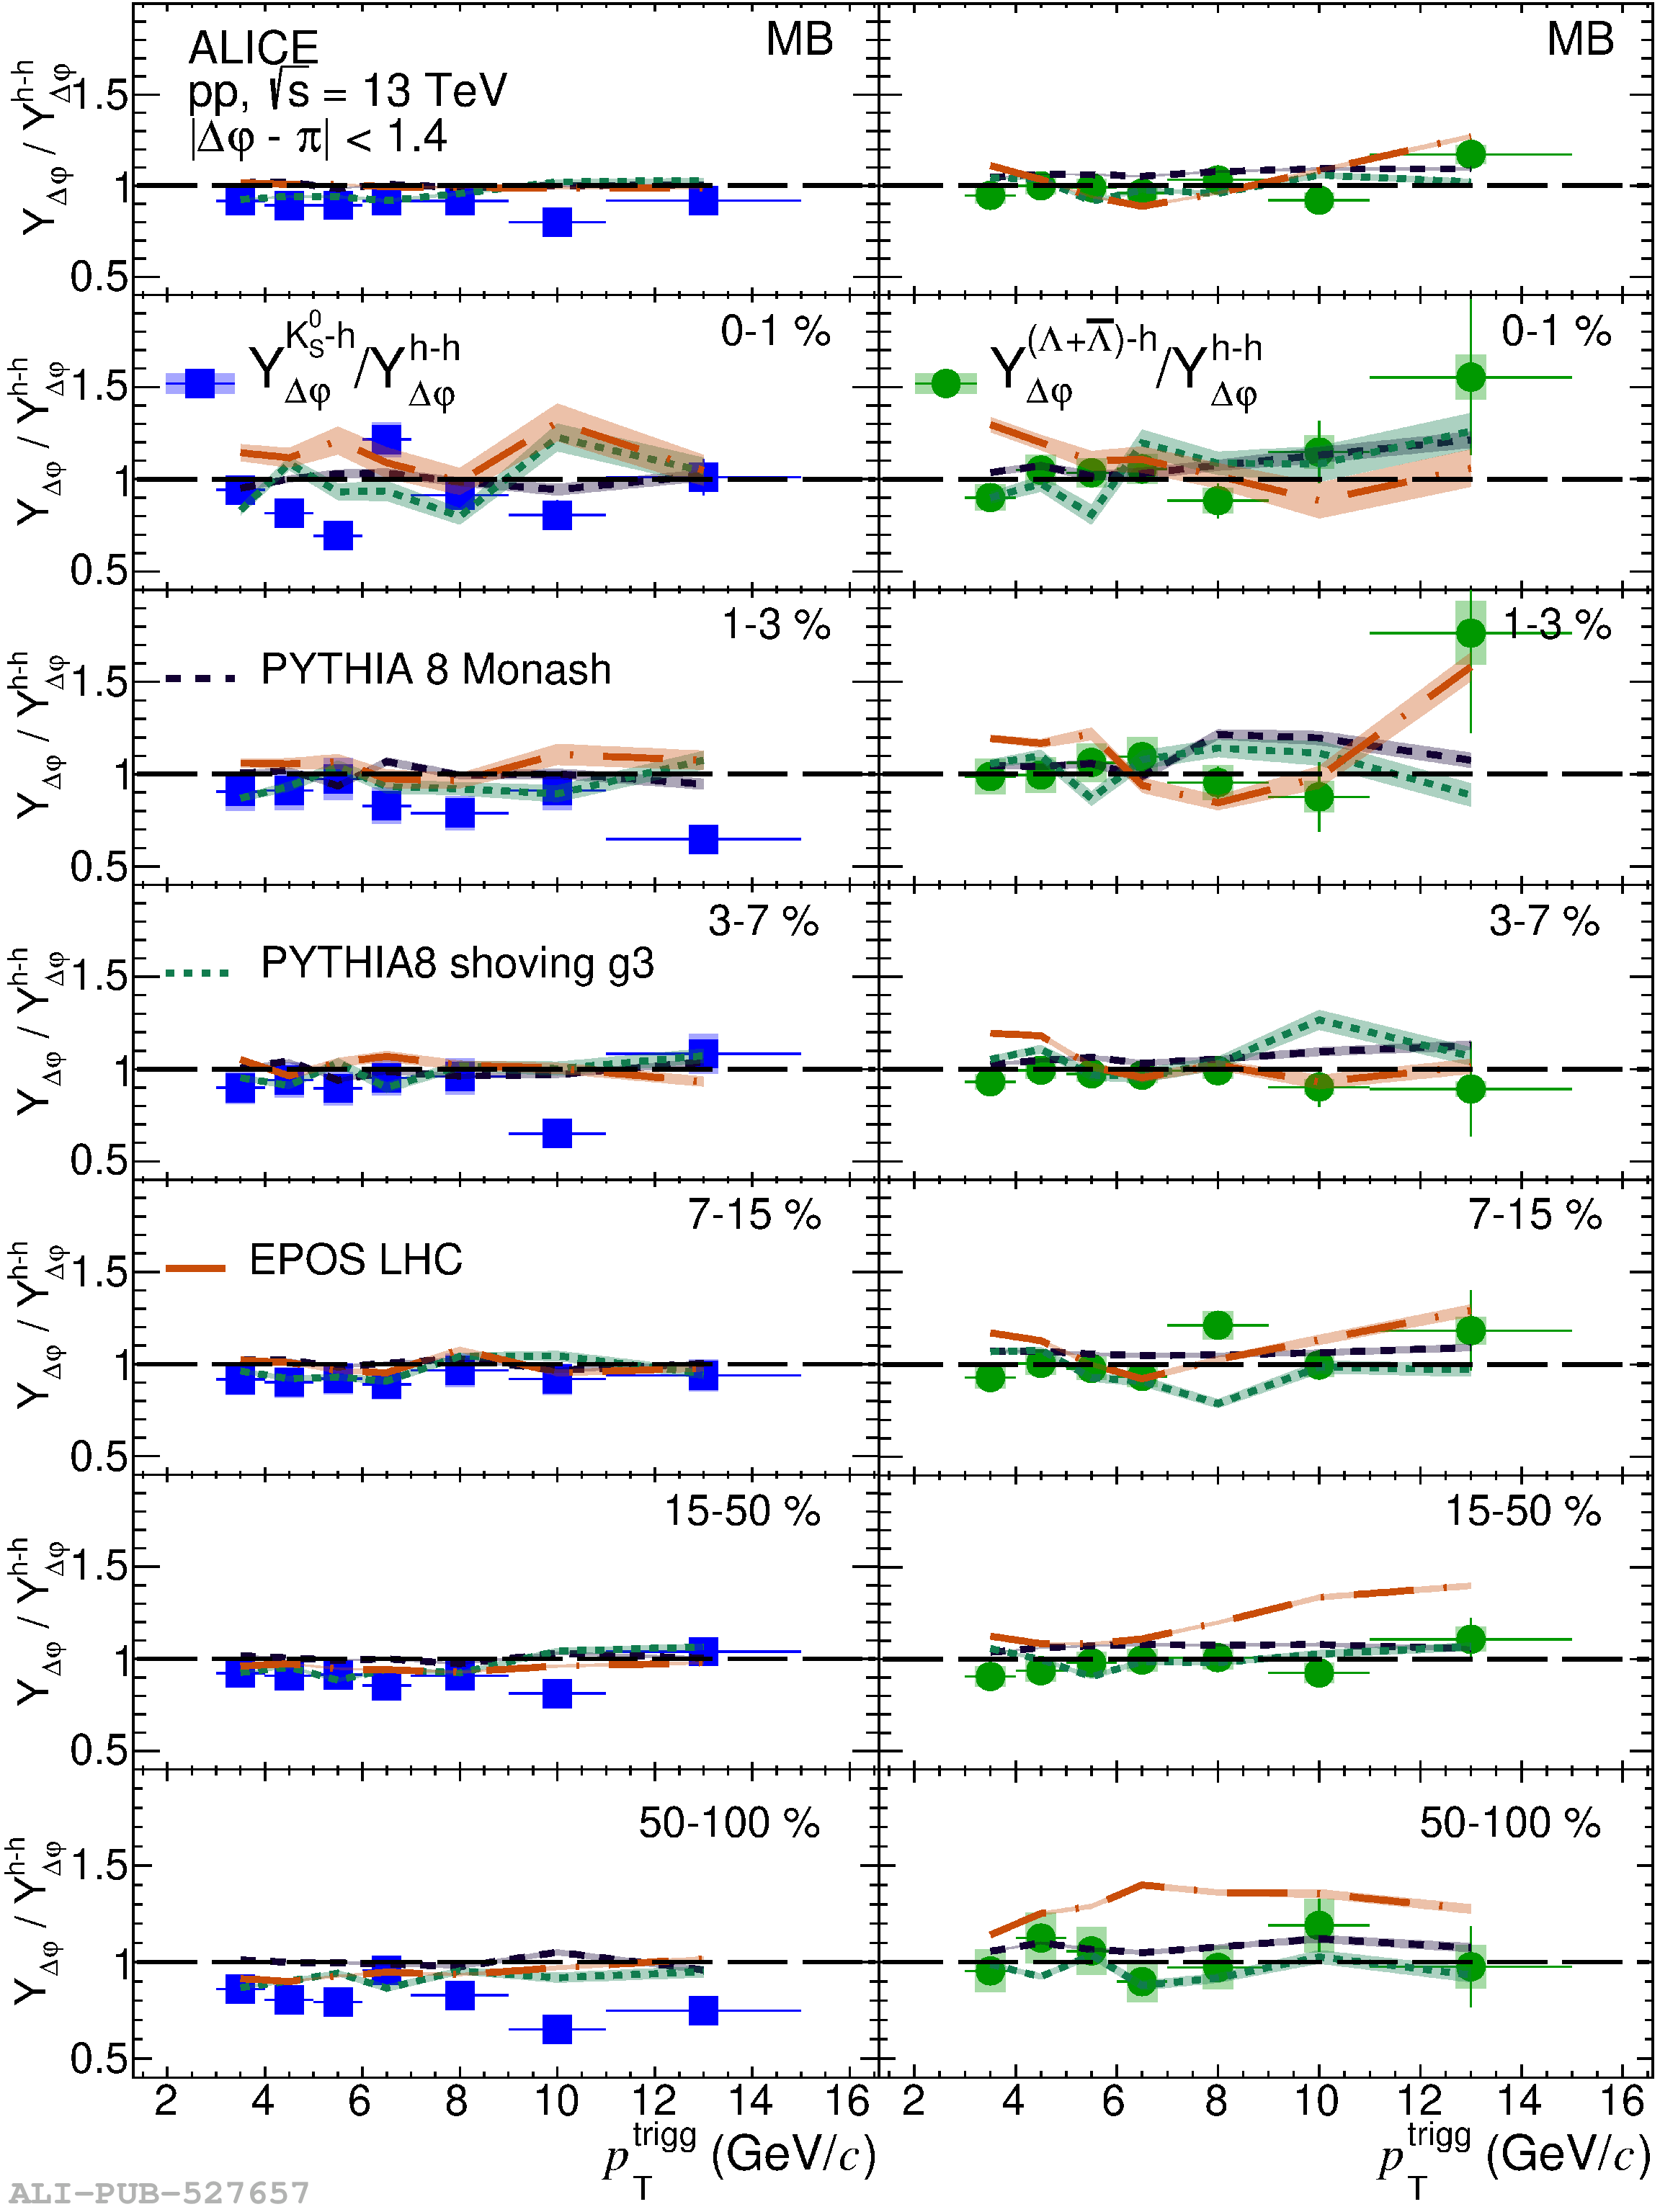 |
Figure 9
Per-trigger yield ratios of \K-h (left column) or \lam-h (right column) to h-h as a function of \ptassoc, for the near-side in the left plot and for the away-side in the right plot, for different \pttrig intervals in the MB sample. Error bars and colored boxes represent statistical and systematic uncertainties, respectively. The bands around model curves stand for their statistical uncertainty. |  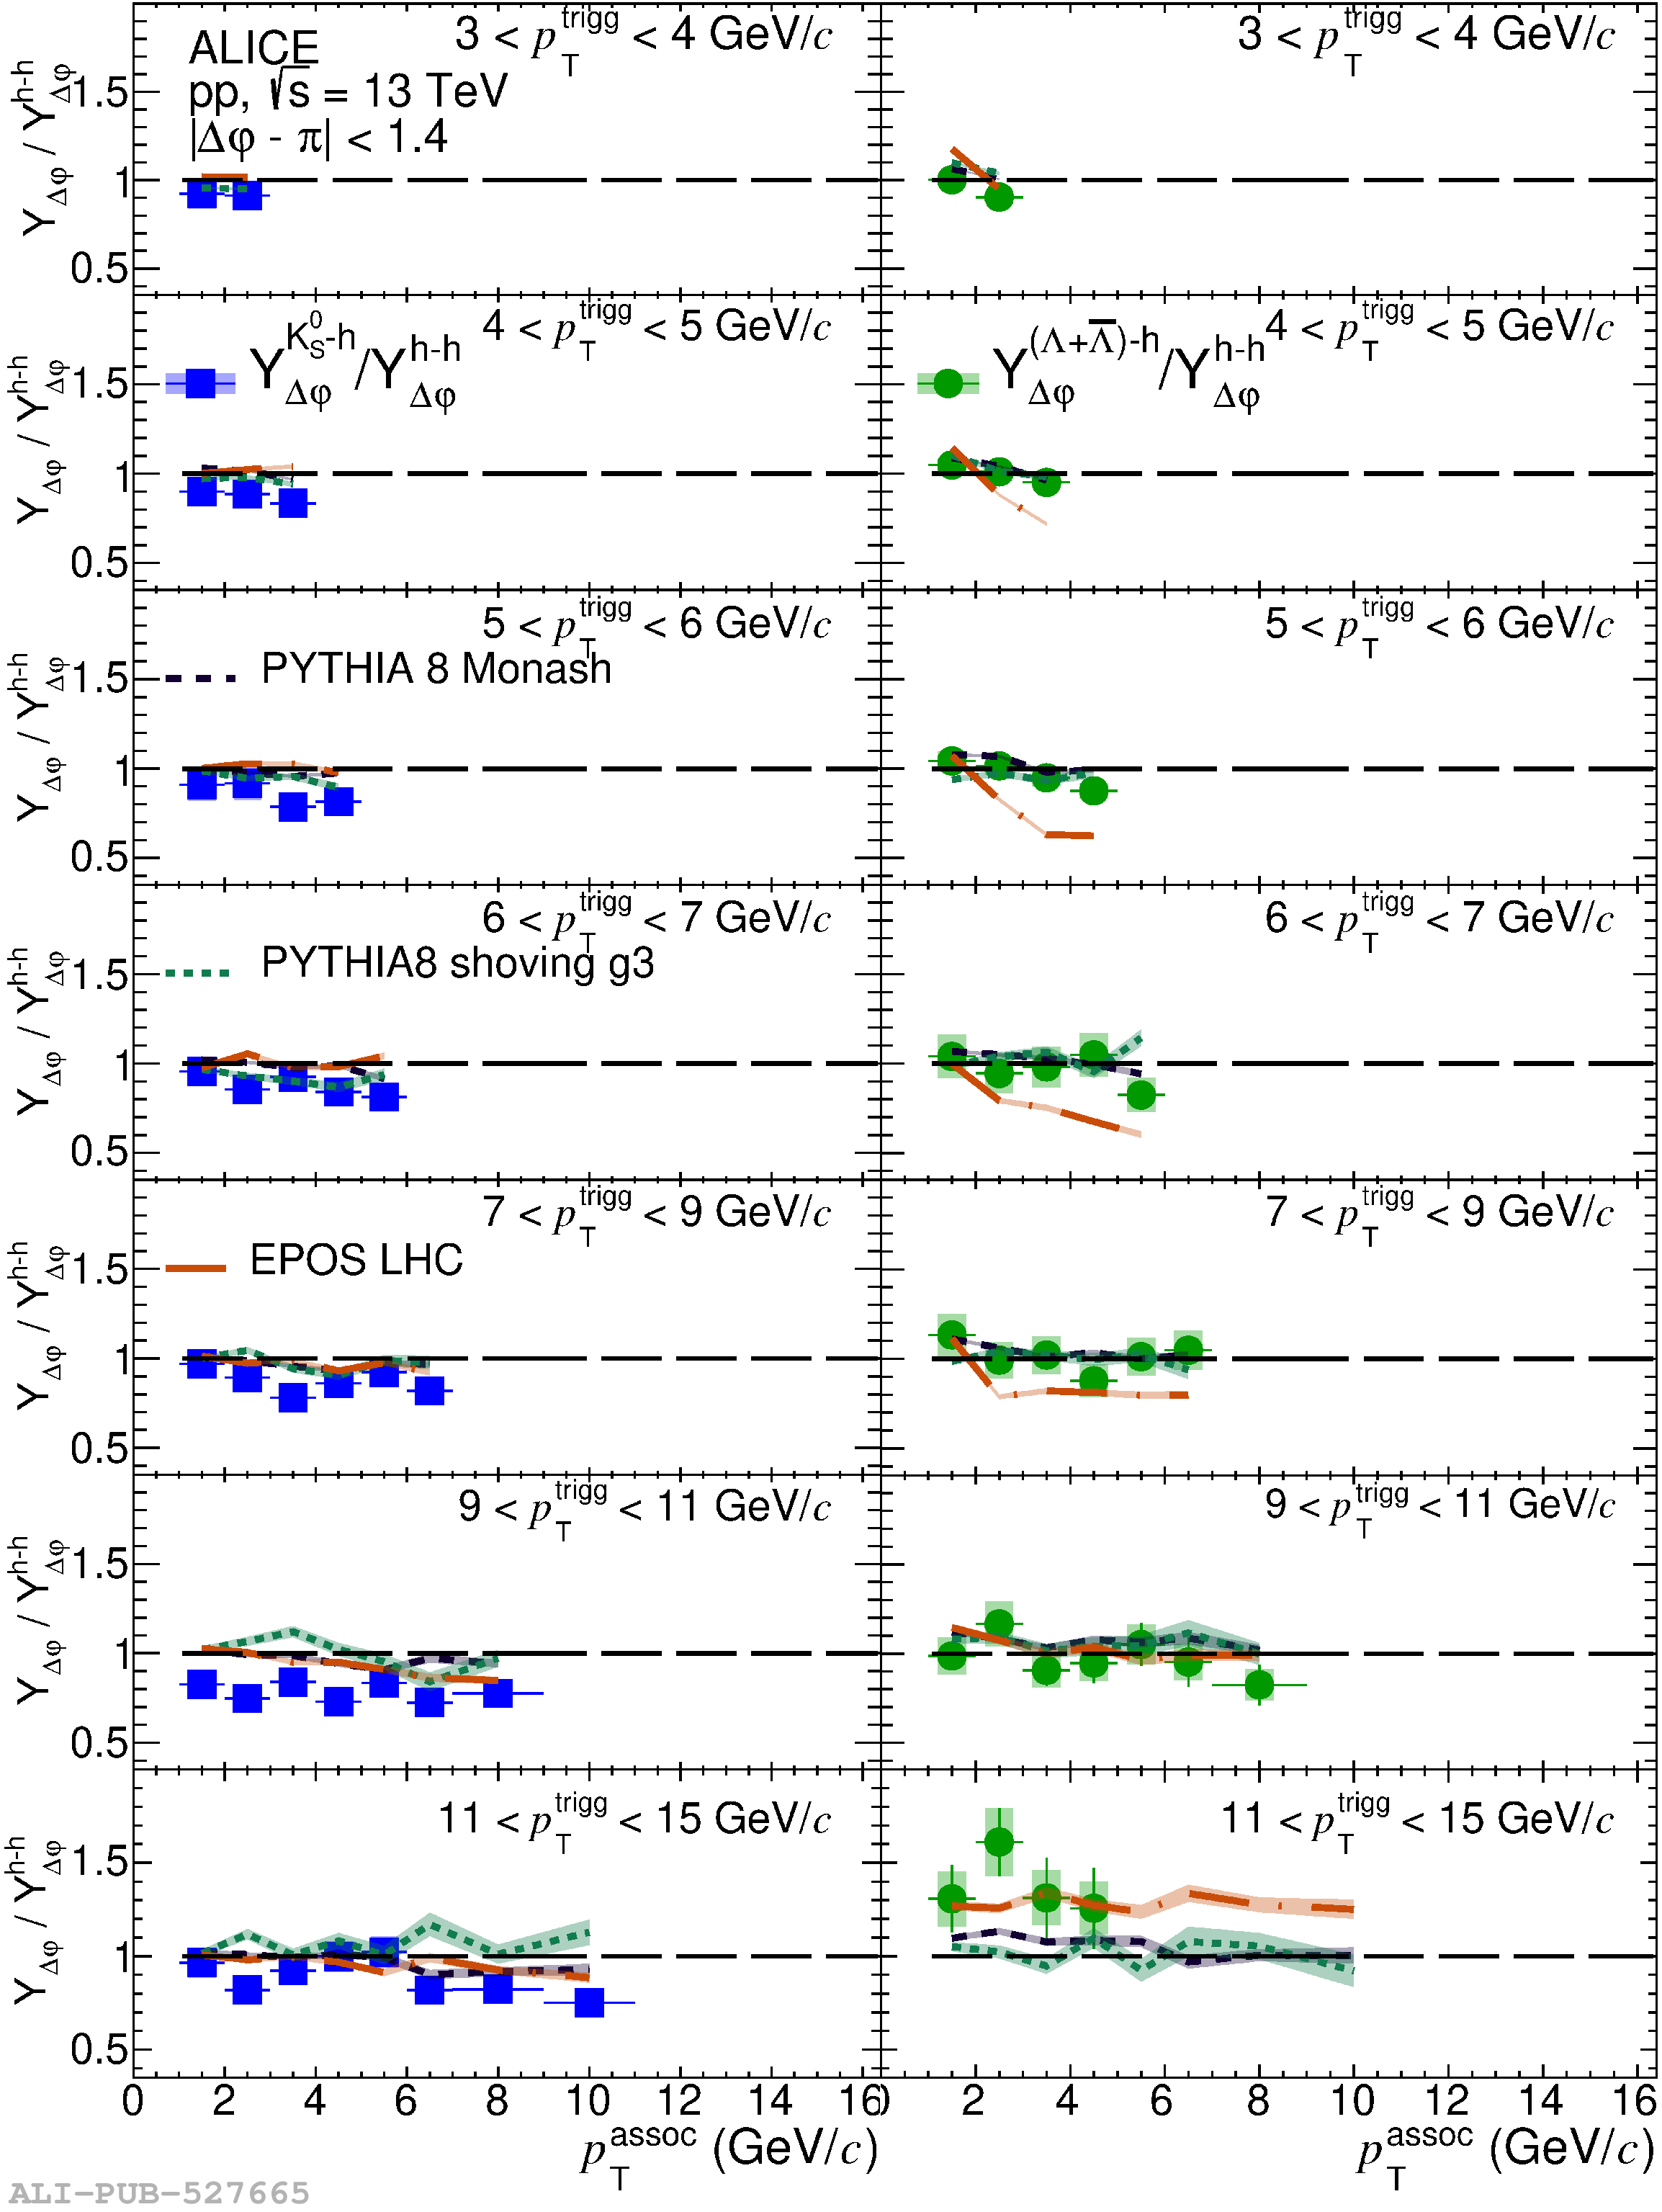 |
Figure 10
Per-trigger yield ratios of \K-h (left column) or \lam-h (right column) to h-h at the near-side as a function of \pttrig in the left plot and as a function of \ptassoc in the right plot, compared with the PYTHIA8 calculation of the quark and gluon jets. Error bars and colored boxes represent statistical and systematic uncertainties, respectively. The bands around model curves stand for their statistical uncertainty. |  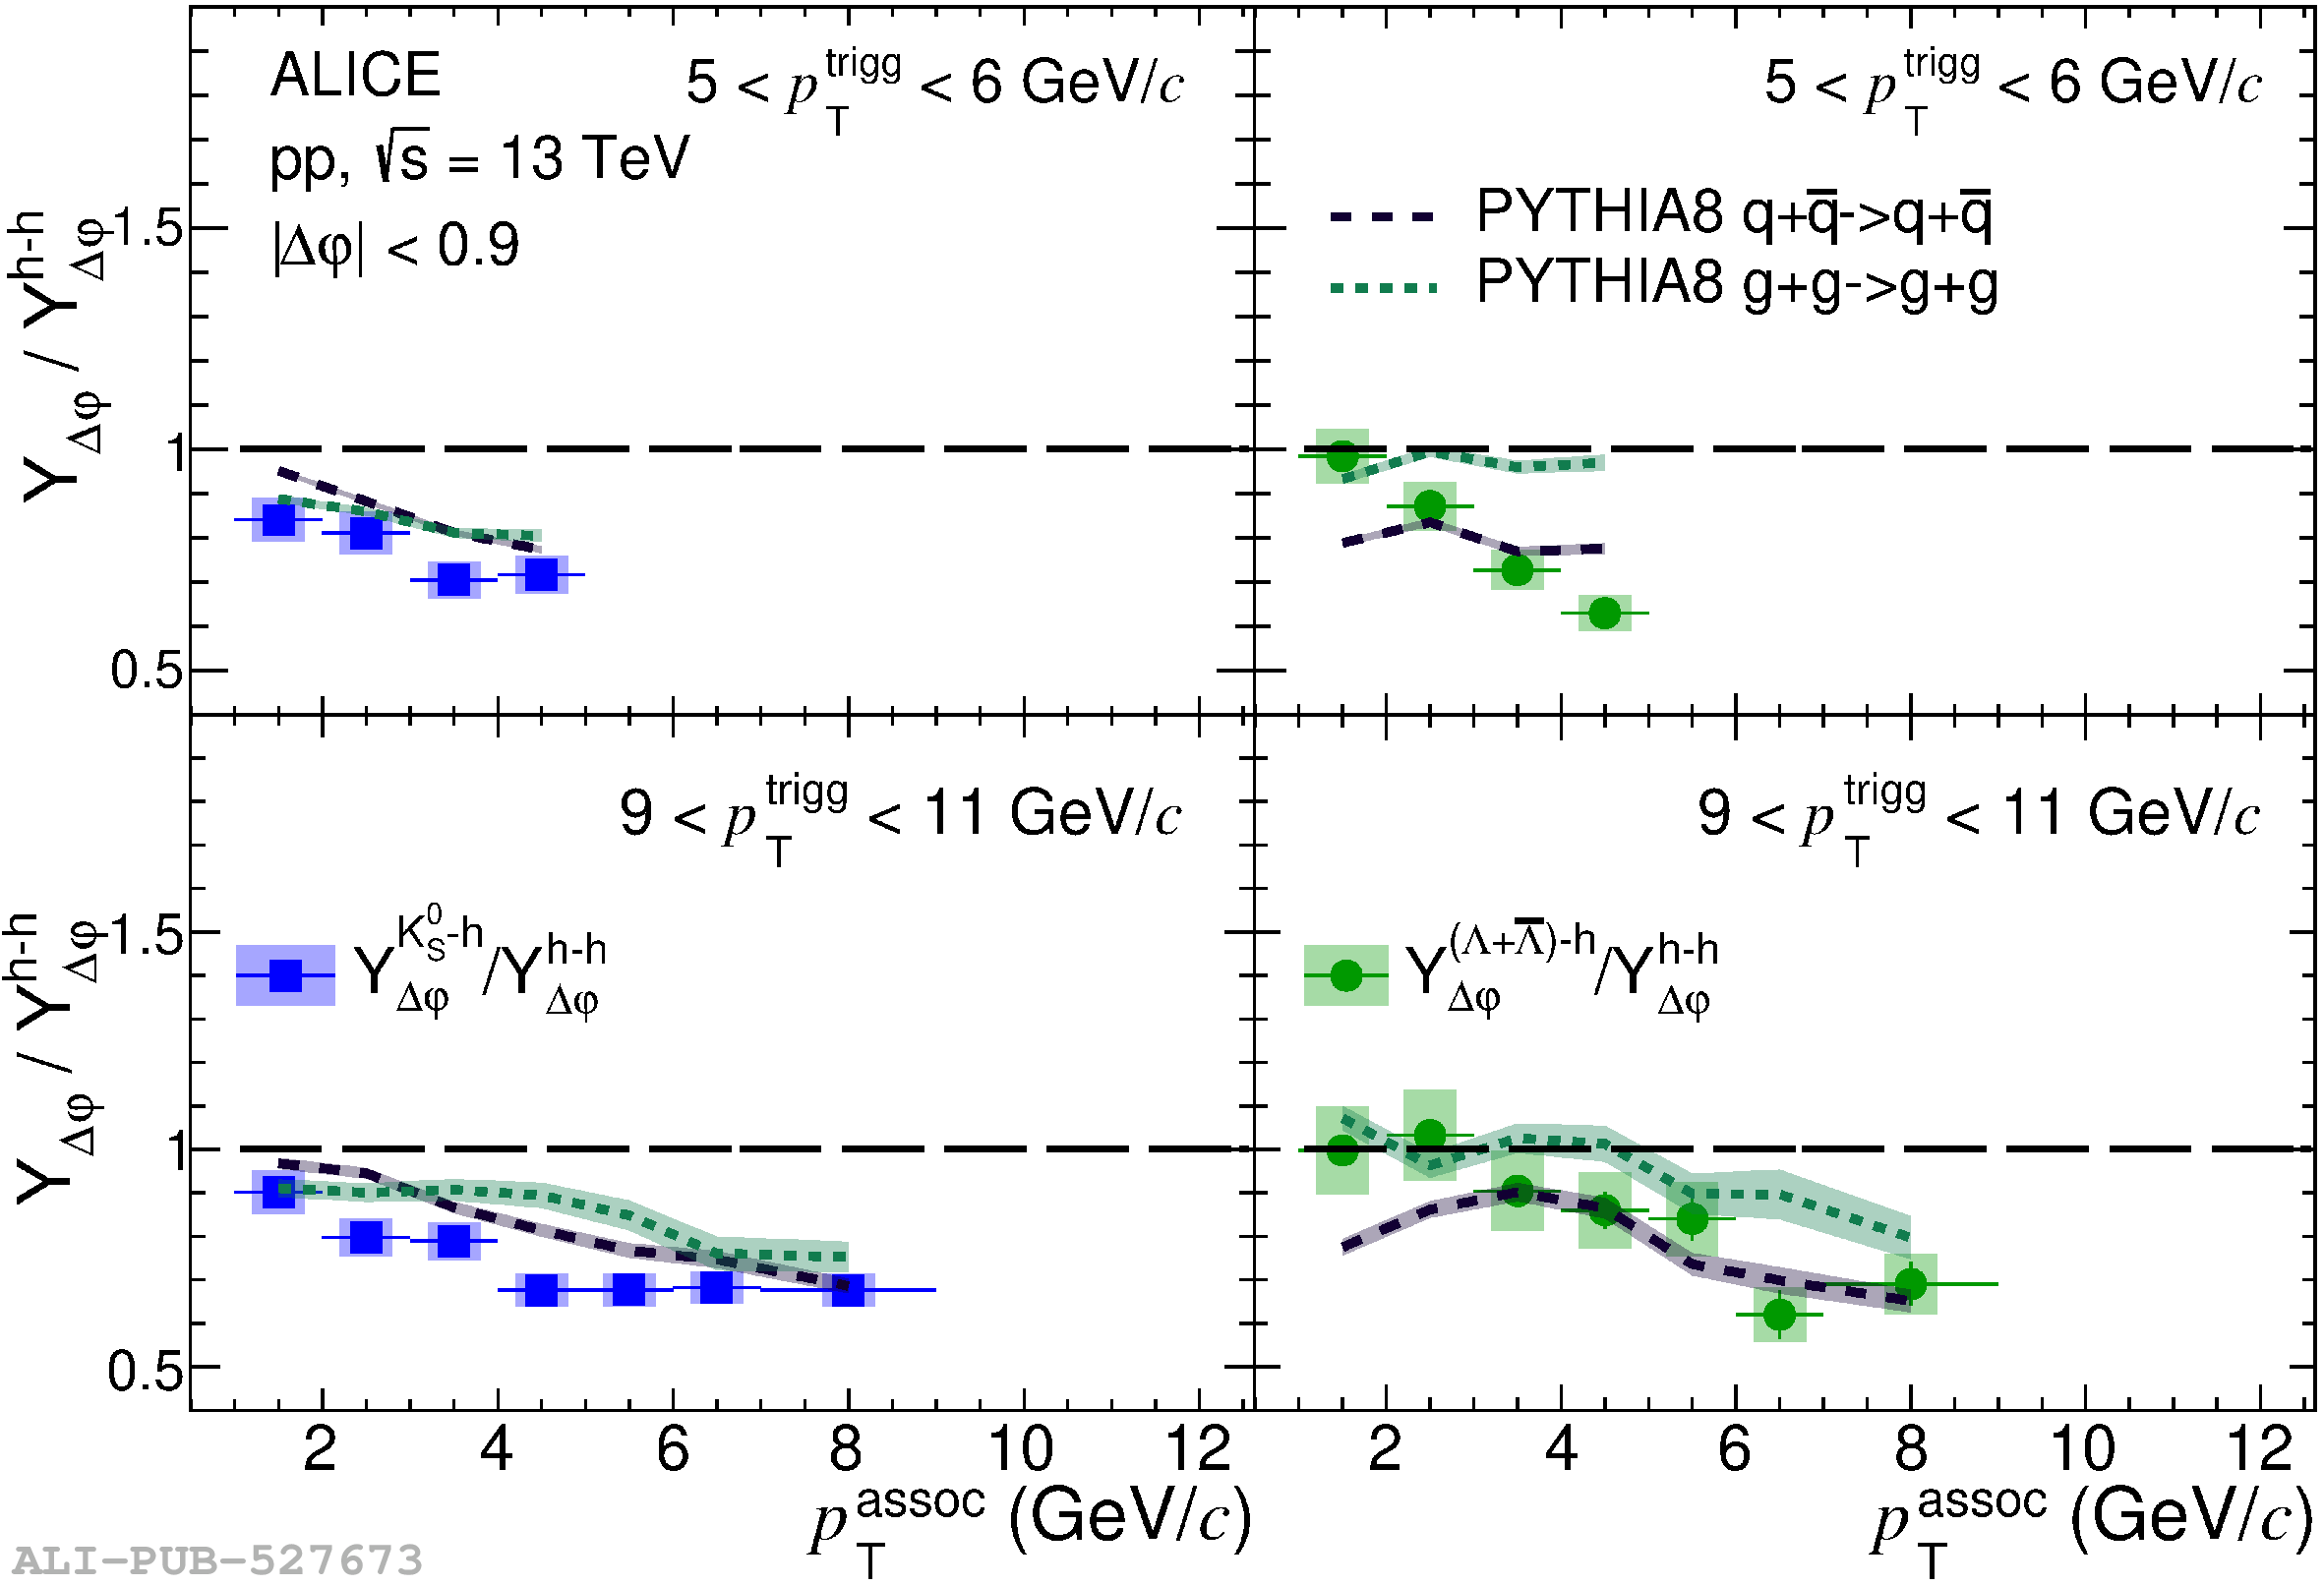 |