Measured deuterons \vtwo\ compared to the predictions from a microscopic model based on the JETSCAPE generator . The model predictions, based on SMASH afterburner and which used TRENTo initial conditions, are shown as bands. The width of the band represents the statistical uncertainty associated with the model. In the lower panel the data-to-model differences are shown. Vertical bars and boxes represent the statistical and systematic uncertainties, respectively. | 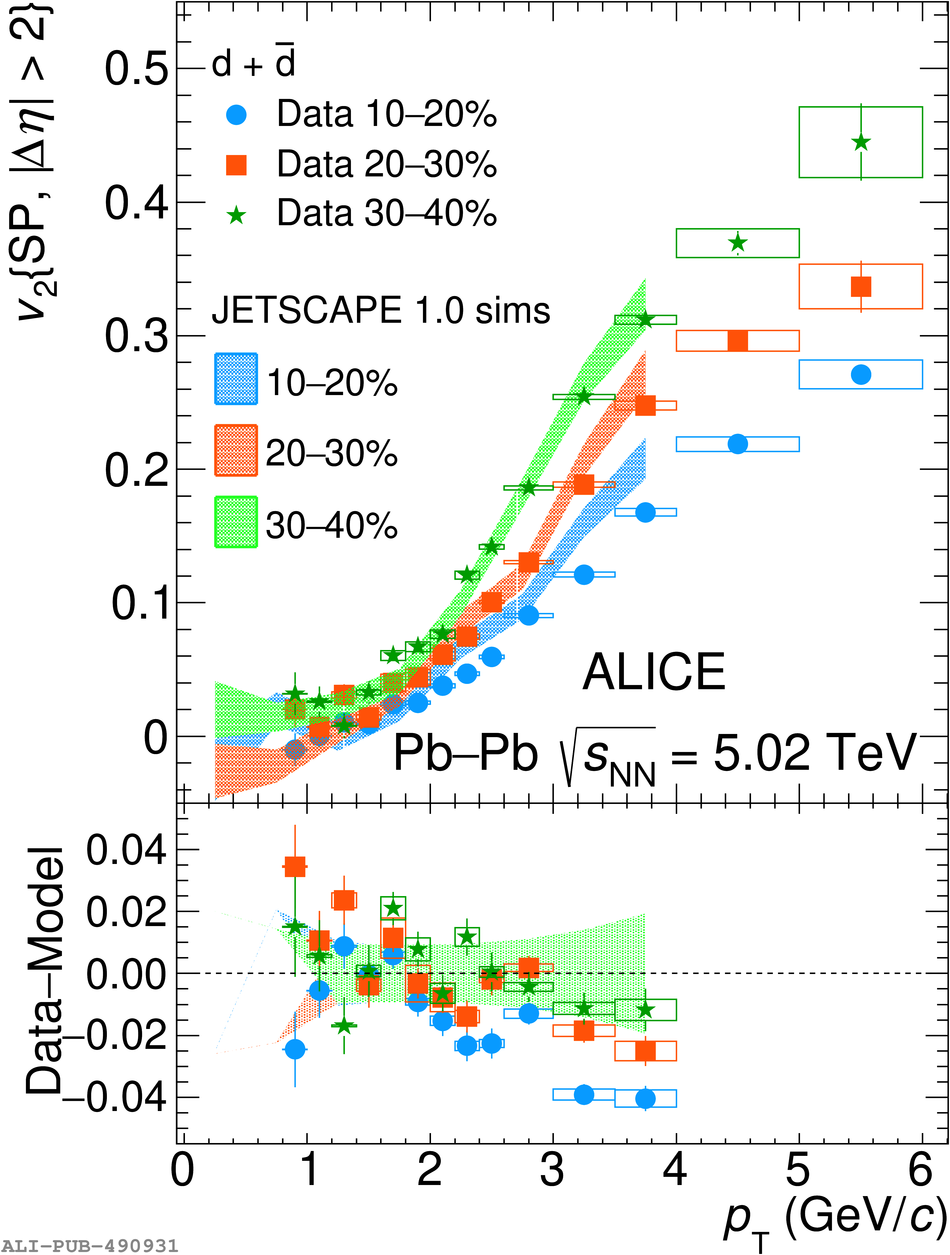 |