Measured deuterons \vtwo\ and \vthree\ (red circles) compared with the expectations from simple coalescence (Eq. \ref{eq:v2coal}) (blue shaded bands) for two centrality intervals. In the left panel, the \vtwo\ measurements in the 10--20$\%$ and 40--50$\%$ centrality intervals is shown. The right panel displays the results of \vthree\ in the 0--20$\%$ and 20--40$\%$ centrality intervals. The bottom panels show the ratio between the measured \vtwo(\vthree) and the expectations from the coalescence model. In each panel, vertical bars and boxes represent the statistical and systematic uncertainties, respectively. The line at one is to guide the eye. | 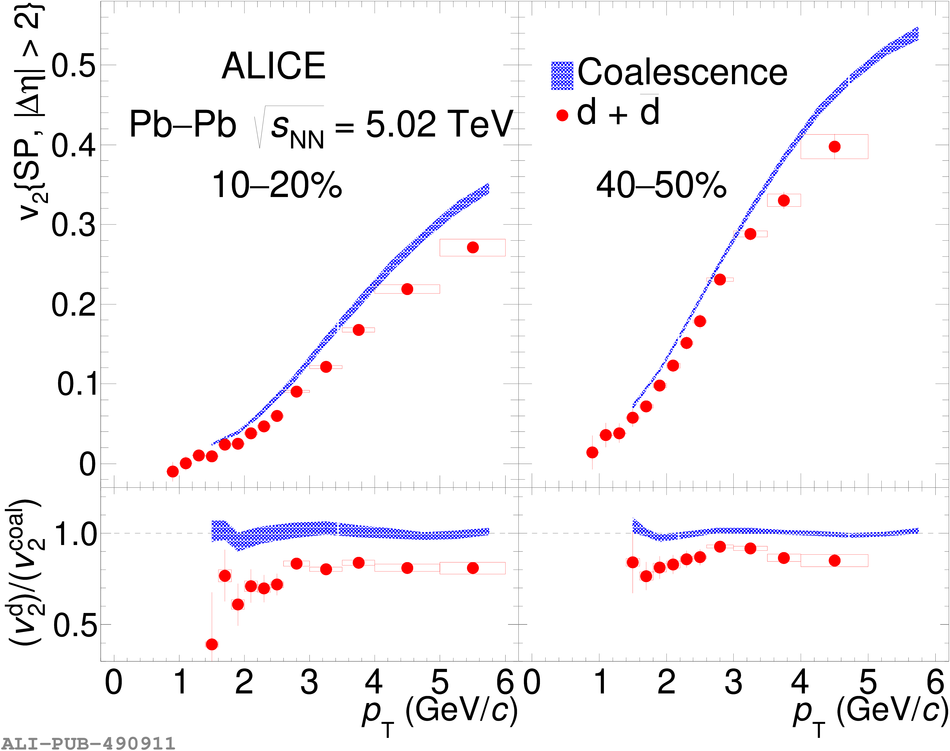 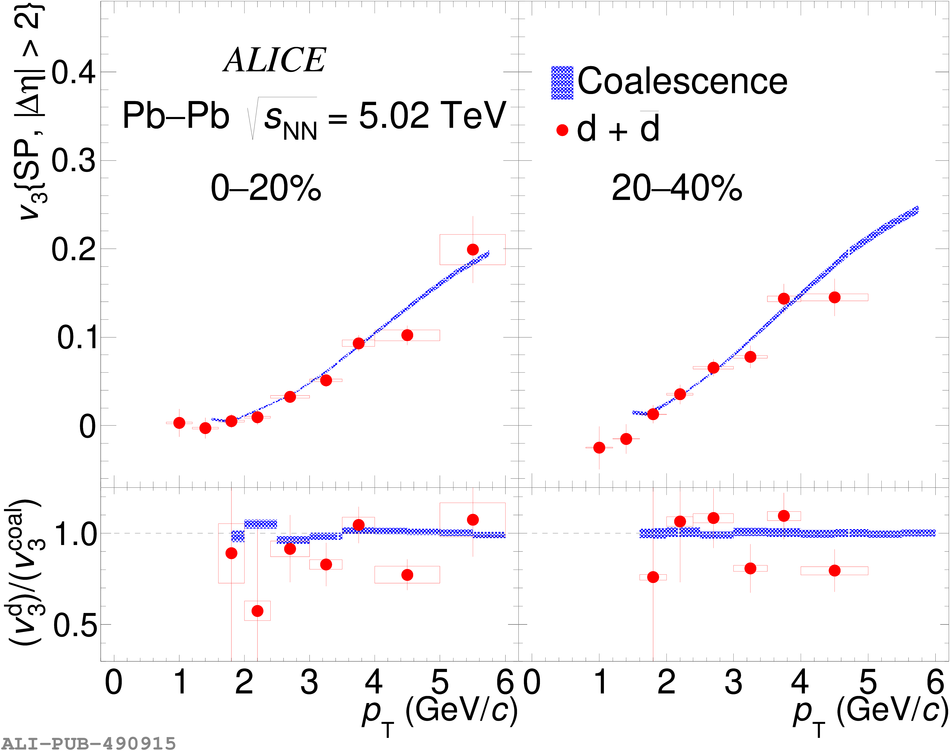 |