Ratios of the fully corrected $\omega$ spectra obtained with the individual reconstruction methods to the Levy-Tsallis fit of the combined spectrum, where the fit parameters are shown in \Tab{tab:FitParam} The statistical and systematic uncertainties are represented by vertical bars and boxes, respectively. | 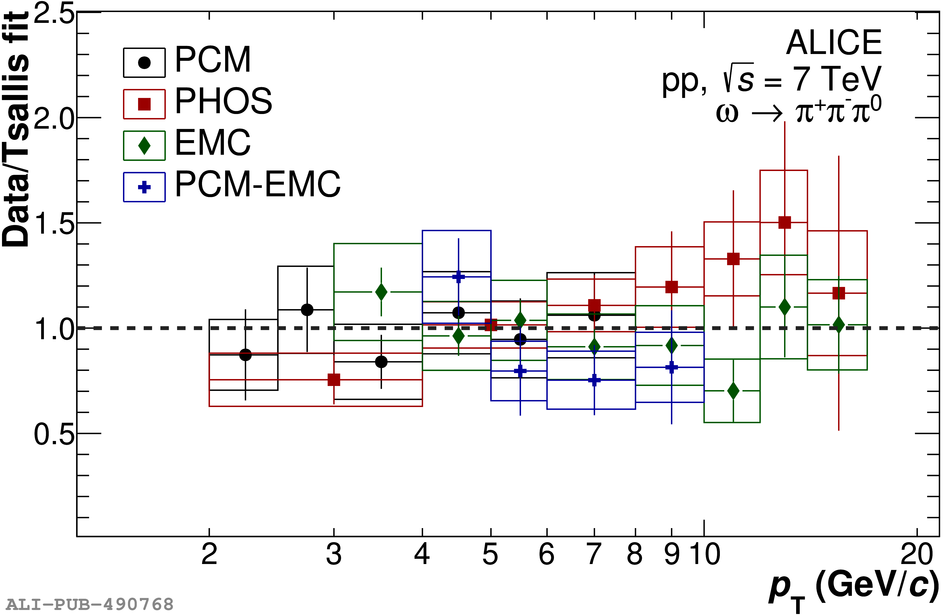 |