Measurements of event-by-event fluctuations of charged-particle multiplicities in Pb-Pb collisions at $\sqrt{s_{\rm NN}}$ = 2.76 TeV using the ALICE detector at the CERN Large Hadron Collider (LHC) are presented in the pseudorapidity range $|\eta|<~0.8$ and transverse momentum $0.2 <~ p_{\rm T} <~ 2.0$ GeV/$c$. The amplitude of the fluctuations is expressed in terms of the variance normalized by the mean of the multiplicity distribution. The $\eta$ and $p_{\rm T}$ dependences of the fluctuations and their evolution with respect to collision centrality are investigated. The multiplicity fluctuations tend to decrease from peripheral to central collisions. The results are compared to those obtained from HIJING and AMPT Monte Carlo event generators as well as to experimental data at lower collision energies. Additionally, the measured multiplicity fluctuations are discussed in the context of the isothermal compressibility of the high-density strongly-interacting system formed in central Pb-Pb collisions.
Eur. Phys. J. C 81 (2021) 1012
e-Print: arXiv:2105.05745 | PDF | inSPIRE
CERN-EP-2021-089
Figure group
Figure 1
Mean ($\langle N_{\rm ch} \rangle$), standard deviation ($\sigma_{\rm ch}$), and scaled variance ($\omega_{\rm ch}$) of charged-particle multiplicity distributions as a function of the number of participating nucleons for experimental data along withHIJING and AMPT (string melting) models for Pb--Pb collisions at \snn $=$ 2.76 TeV, shown in panels (a), (b), and (c), respectively. For panel (a), $\langle N_{\rm part} \rangle$ for the two models are shifted for better visibility The statistical uncertainties are smaller than the size of the markers. The systematic uncertainties are presented as filled boxes. |  |
Figure 2
Scaled variances of charged-particle multiplicity distributions for different $\eta$ and \pT ranges as a function of number of participating nucleons measured in Pb--Pb collisions at \snn $=$ 2.76 TeV, shown inpanels (a), and (b), respectively The estimated $\omega_{\rm ch}$ for $|\eta|<0.3$ and $|\eta|<0.5$ are obtained from the experimental data of $|\eta|<0.8$ by using Eq. \ref {empirical}. The estimated $\omega_{\rm ch}$ for $0.2 < p_{\rm T} < 1.5$ GeV/$c$ and $0.2 < p_{\rm T} < 1.0$ GeV/$c$ are obtained from the experimental data of $0.2 < p_{\rm T} < 2.0$ GeV/$c$, also by using Eq. \ref {empirical}. The statistical uncertainties are smaller than the size of the markers. The systematic uncertainties are presented as filled boxes. | 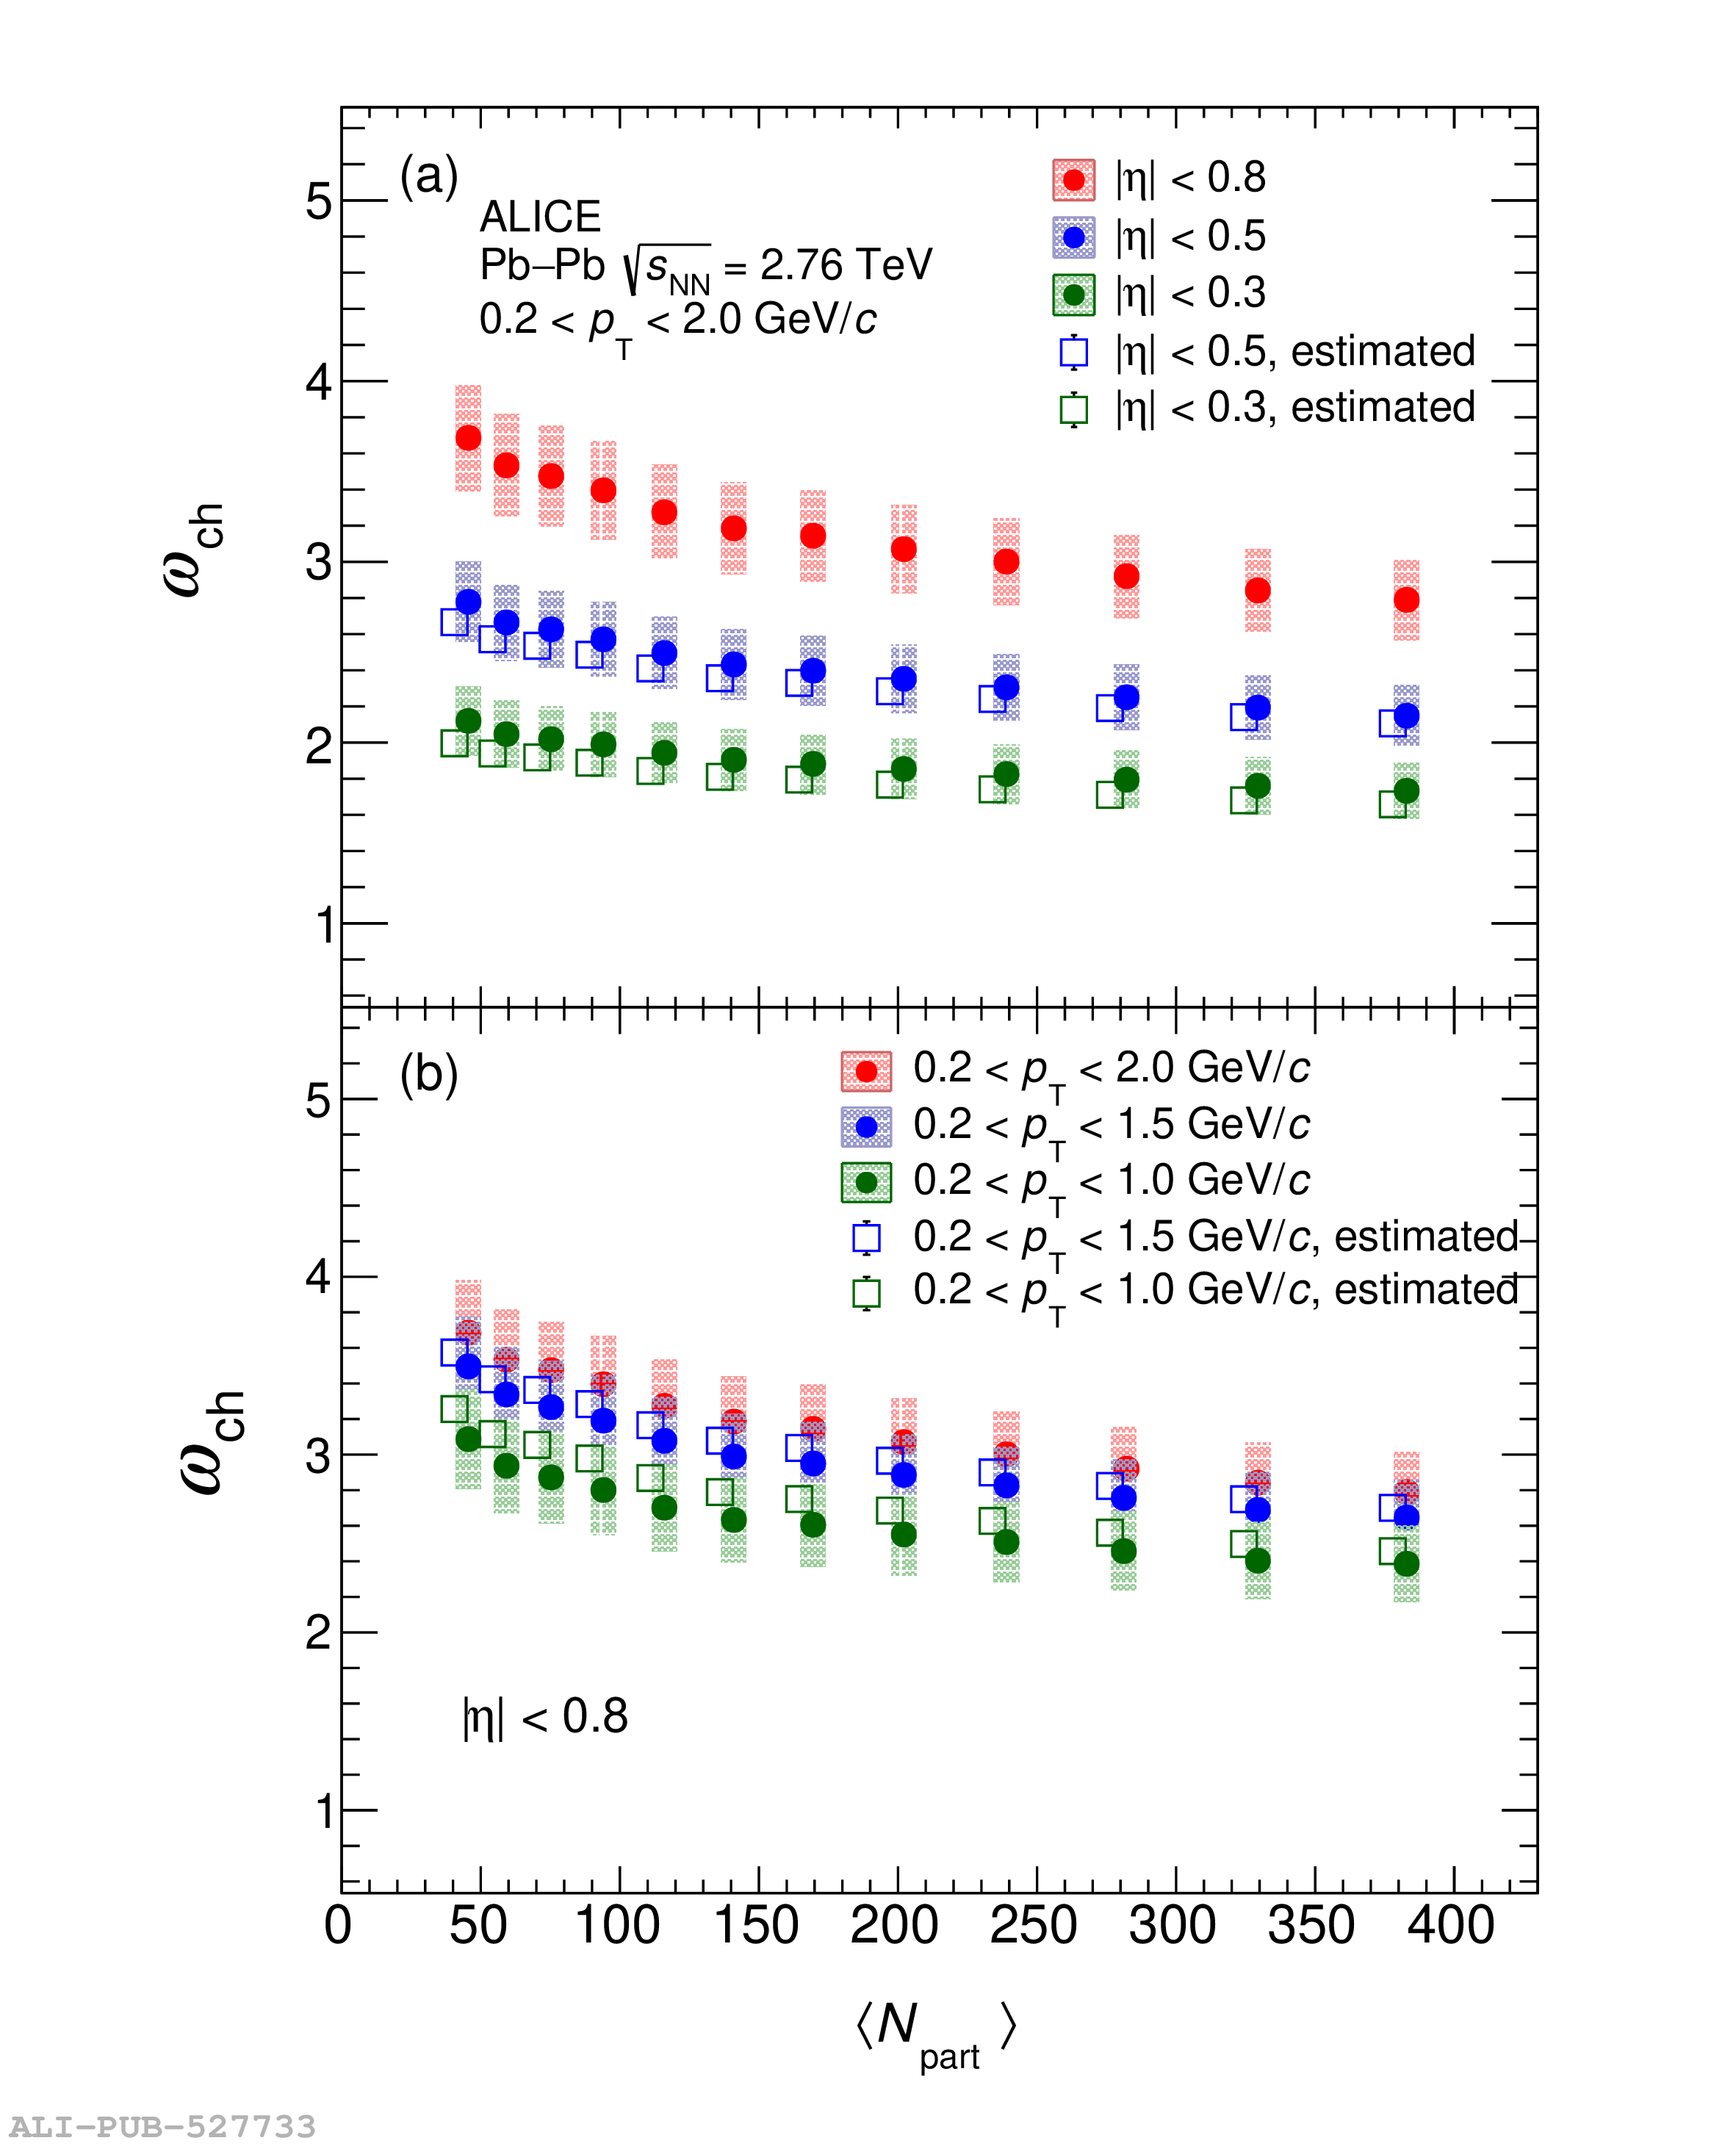 |
Figure 3
Comparison of $\langle N_{\rm ch} \rangle$, $\omega_{\rm ch}$, and$\sigma_{\rm ch}^2/\langle N_{\rm ch} \rangle^2$ measured in this workbased on the acceptance of the PHENIX experiment with results reported by PHENIX as a function of number of participating nucleons, shown in panels(a), (b), and (c), respectively The statistical uncertainties are smaller than the size of the markers. The systematic uncertainties are presented as filled boxes. | 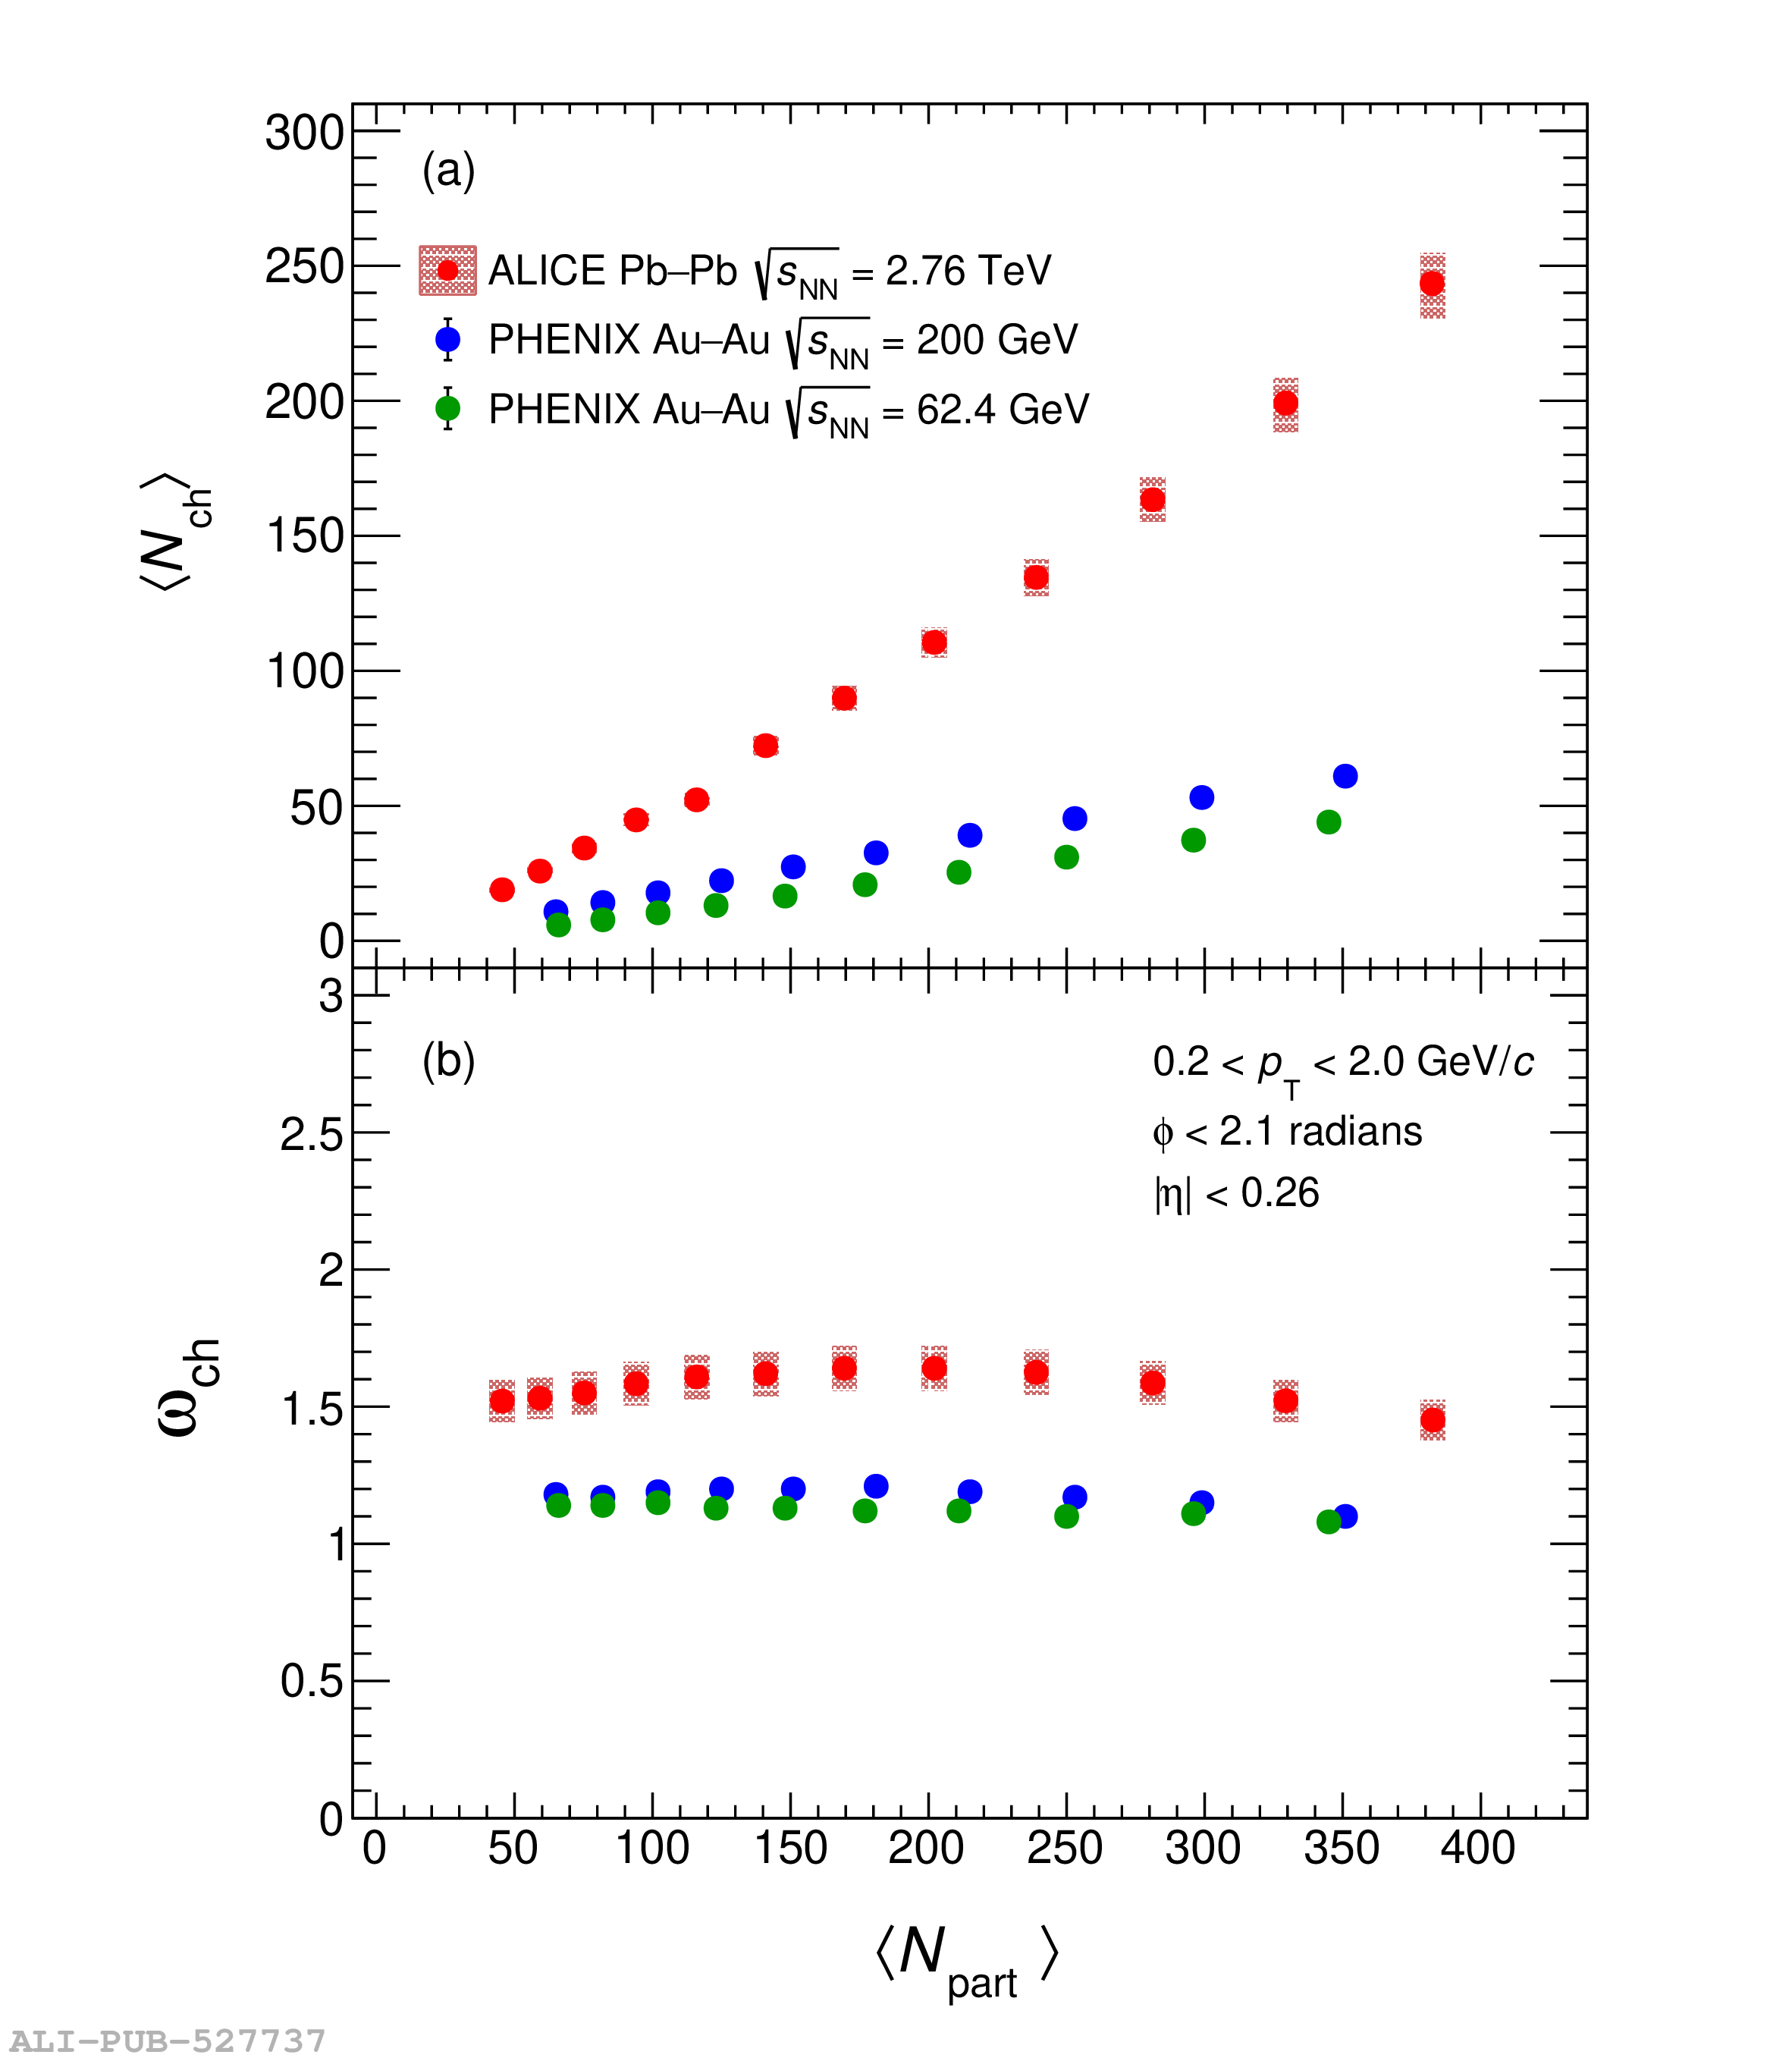 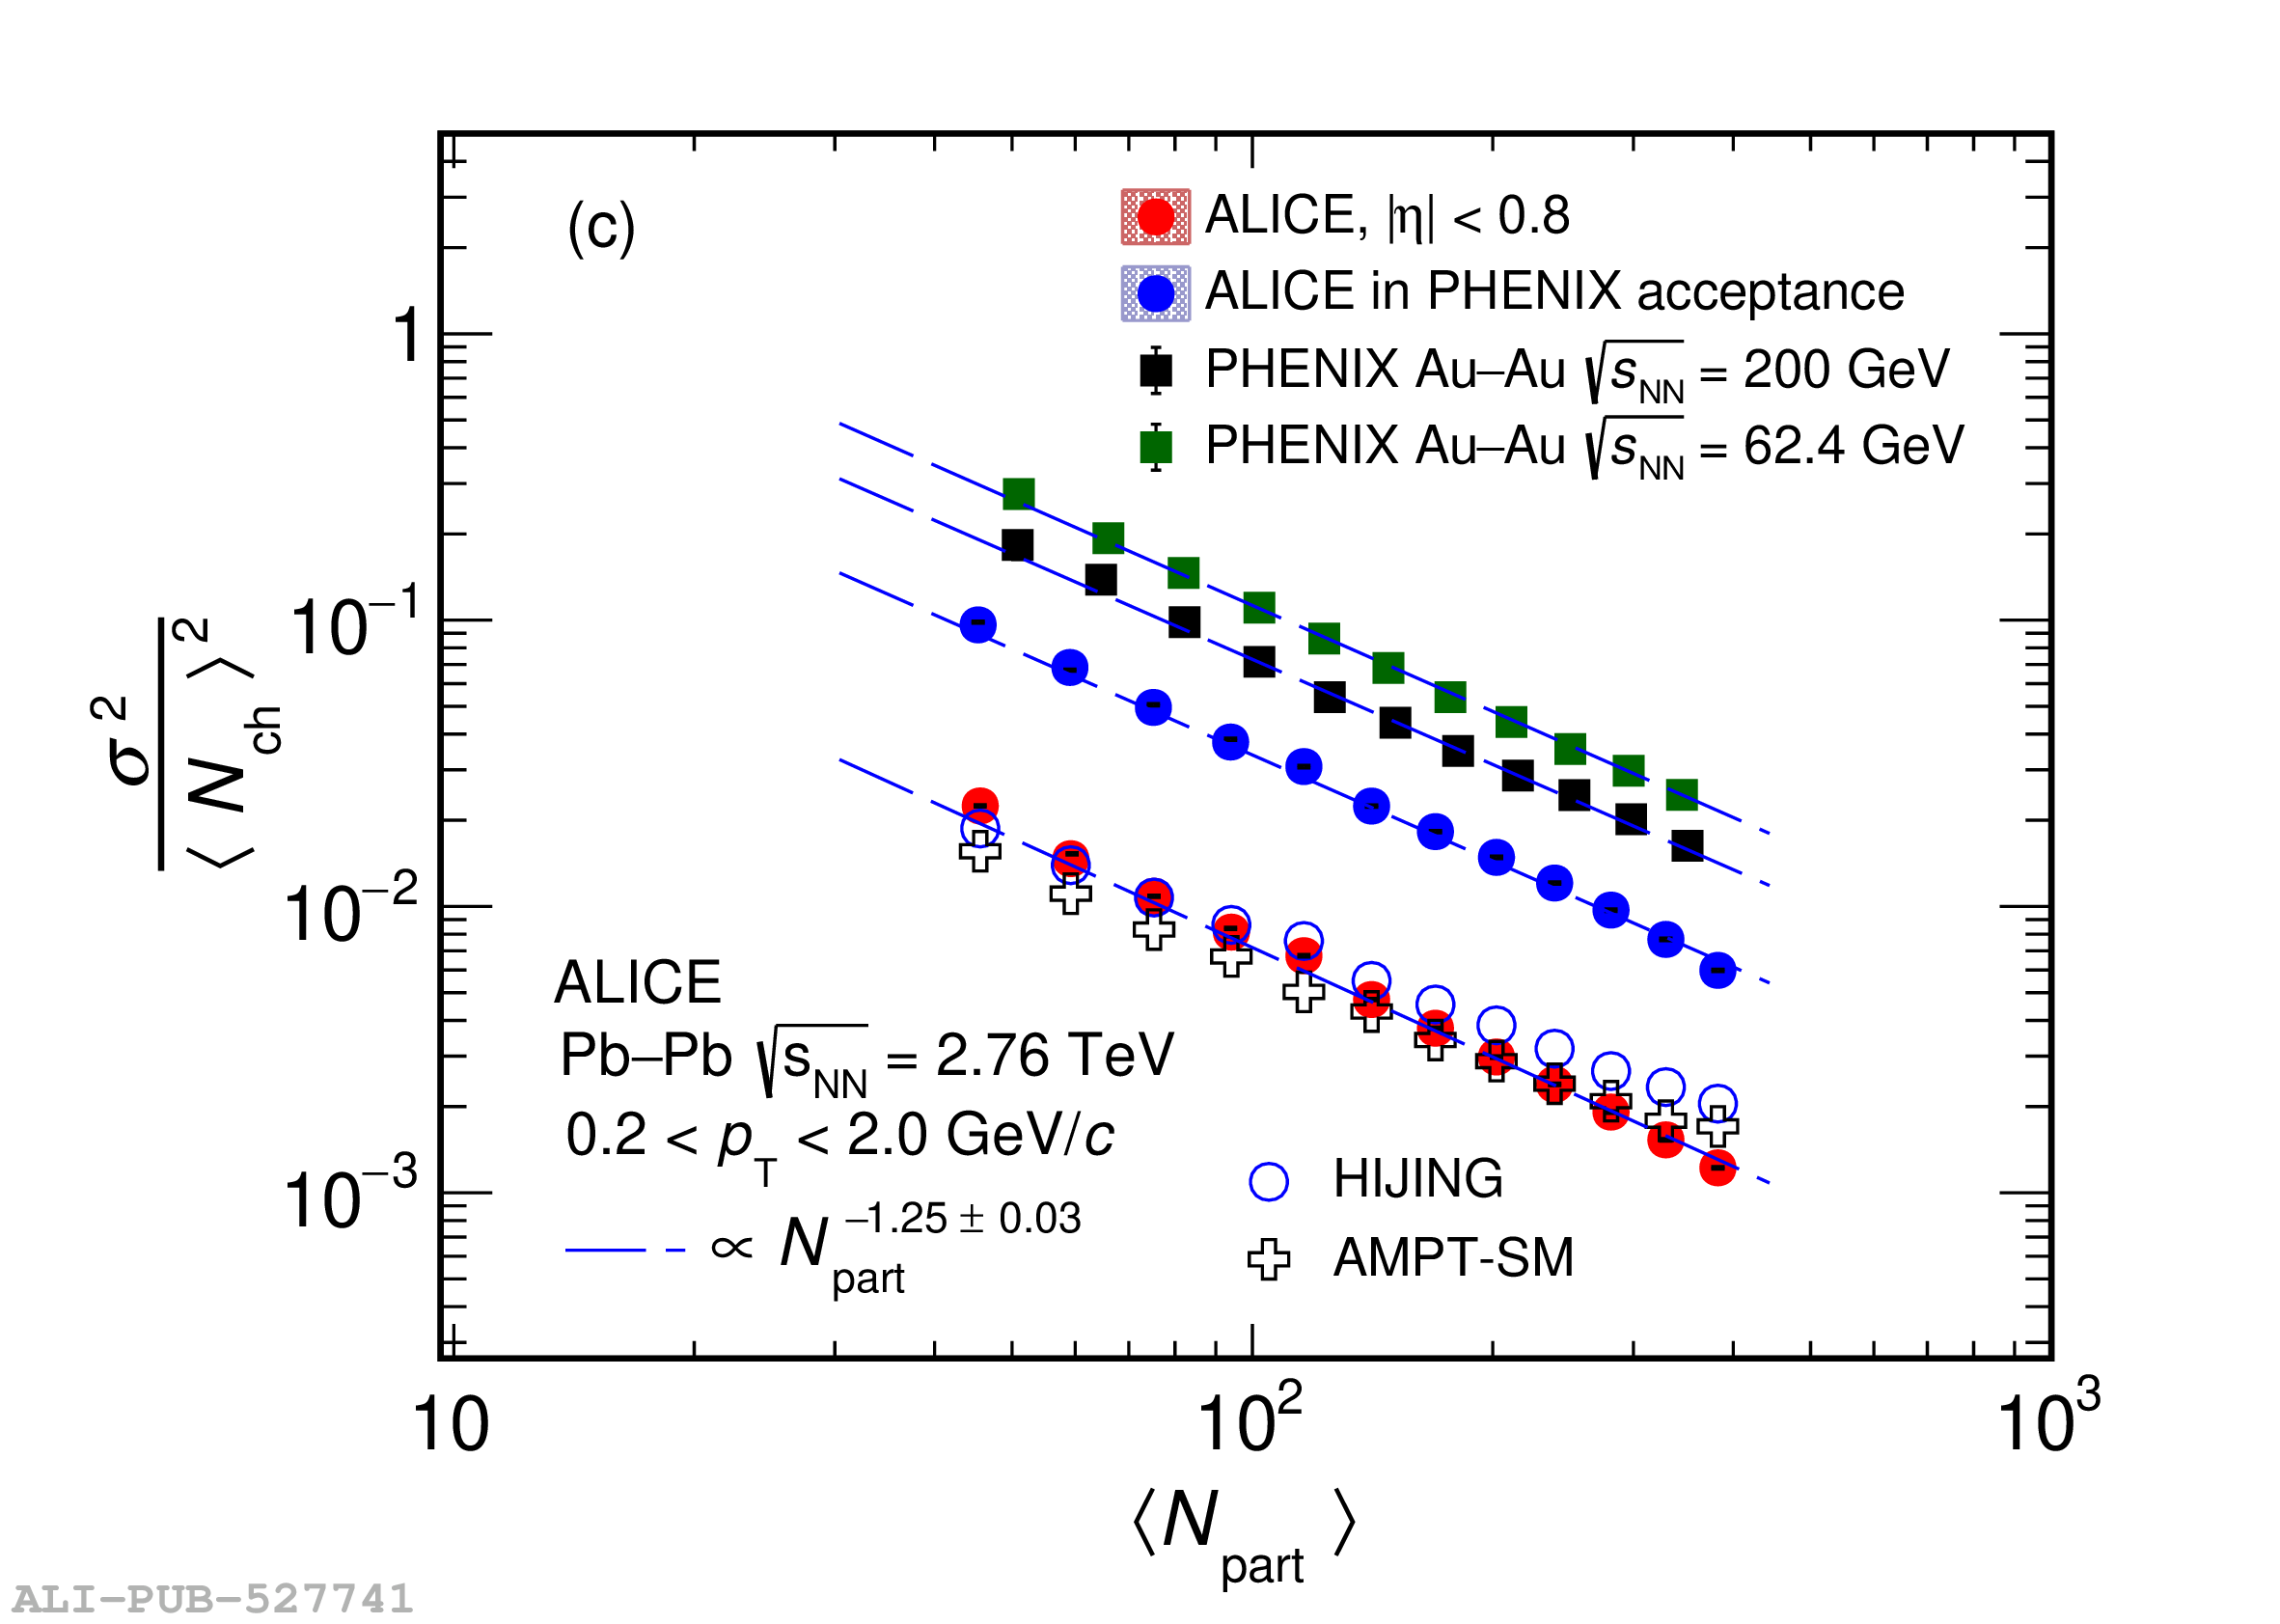 |
Figure 4
Scaled variance as a function of \aveNpart for charged-particle multiplicity distributions and background fluctuations ($\omega_{\rm ch}^{\rm back}$) based on aparticipant model calculation for $|\eta| < 0.5$ The expectation from Poisson-like particle production is indicated by the dotted line. The statistical uncertainties are smaller than the size of the markers. The systematic uncertainties are presented as filled boxes. | 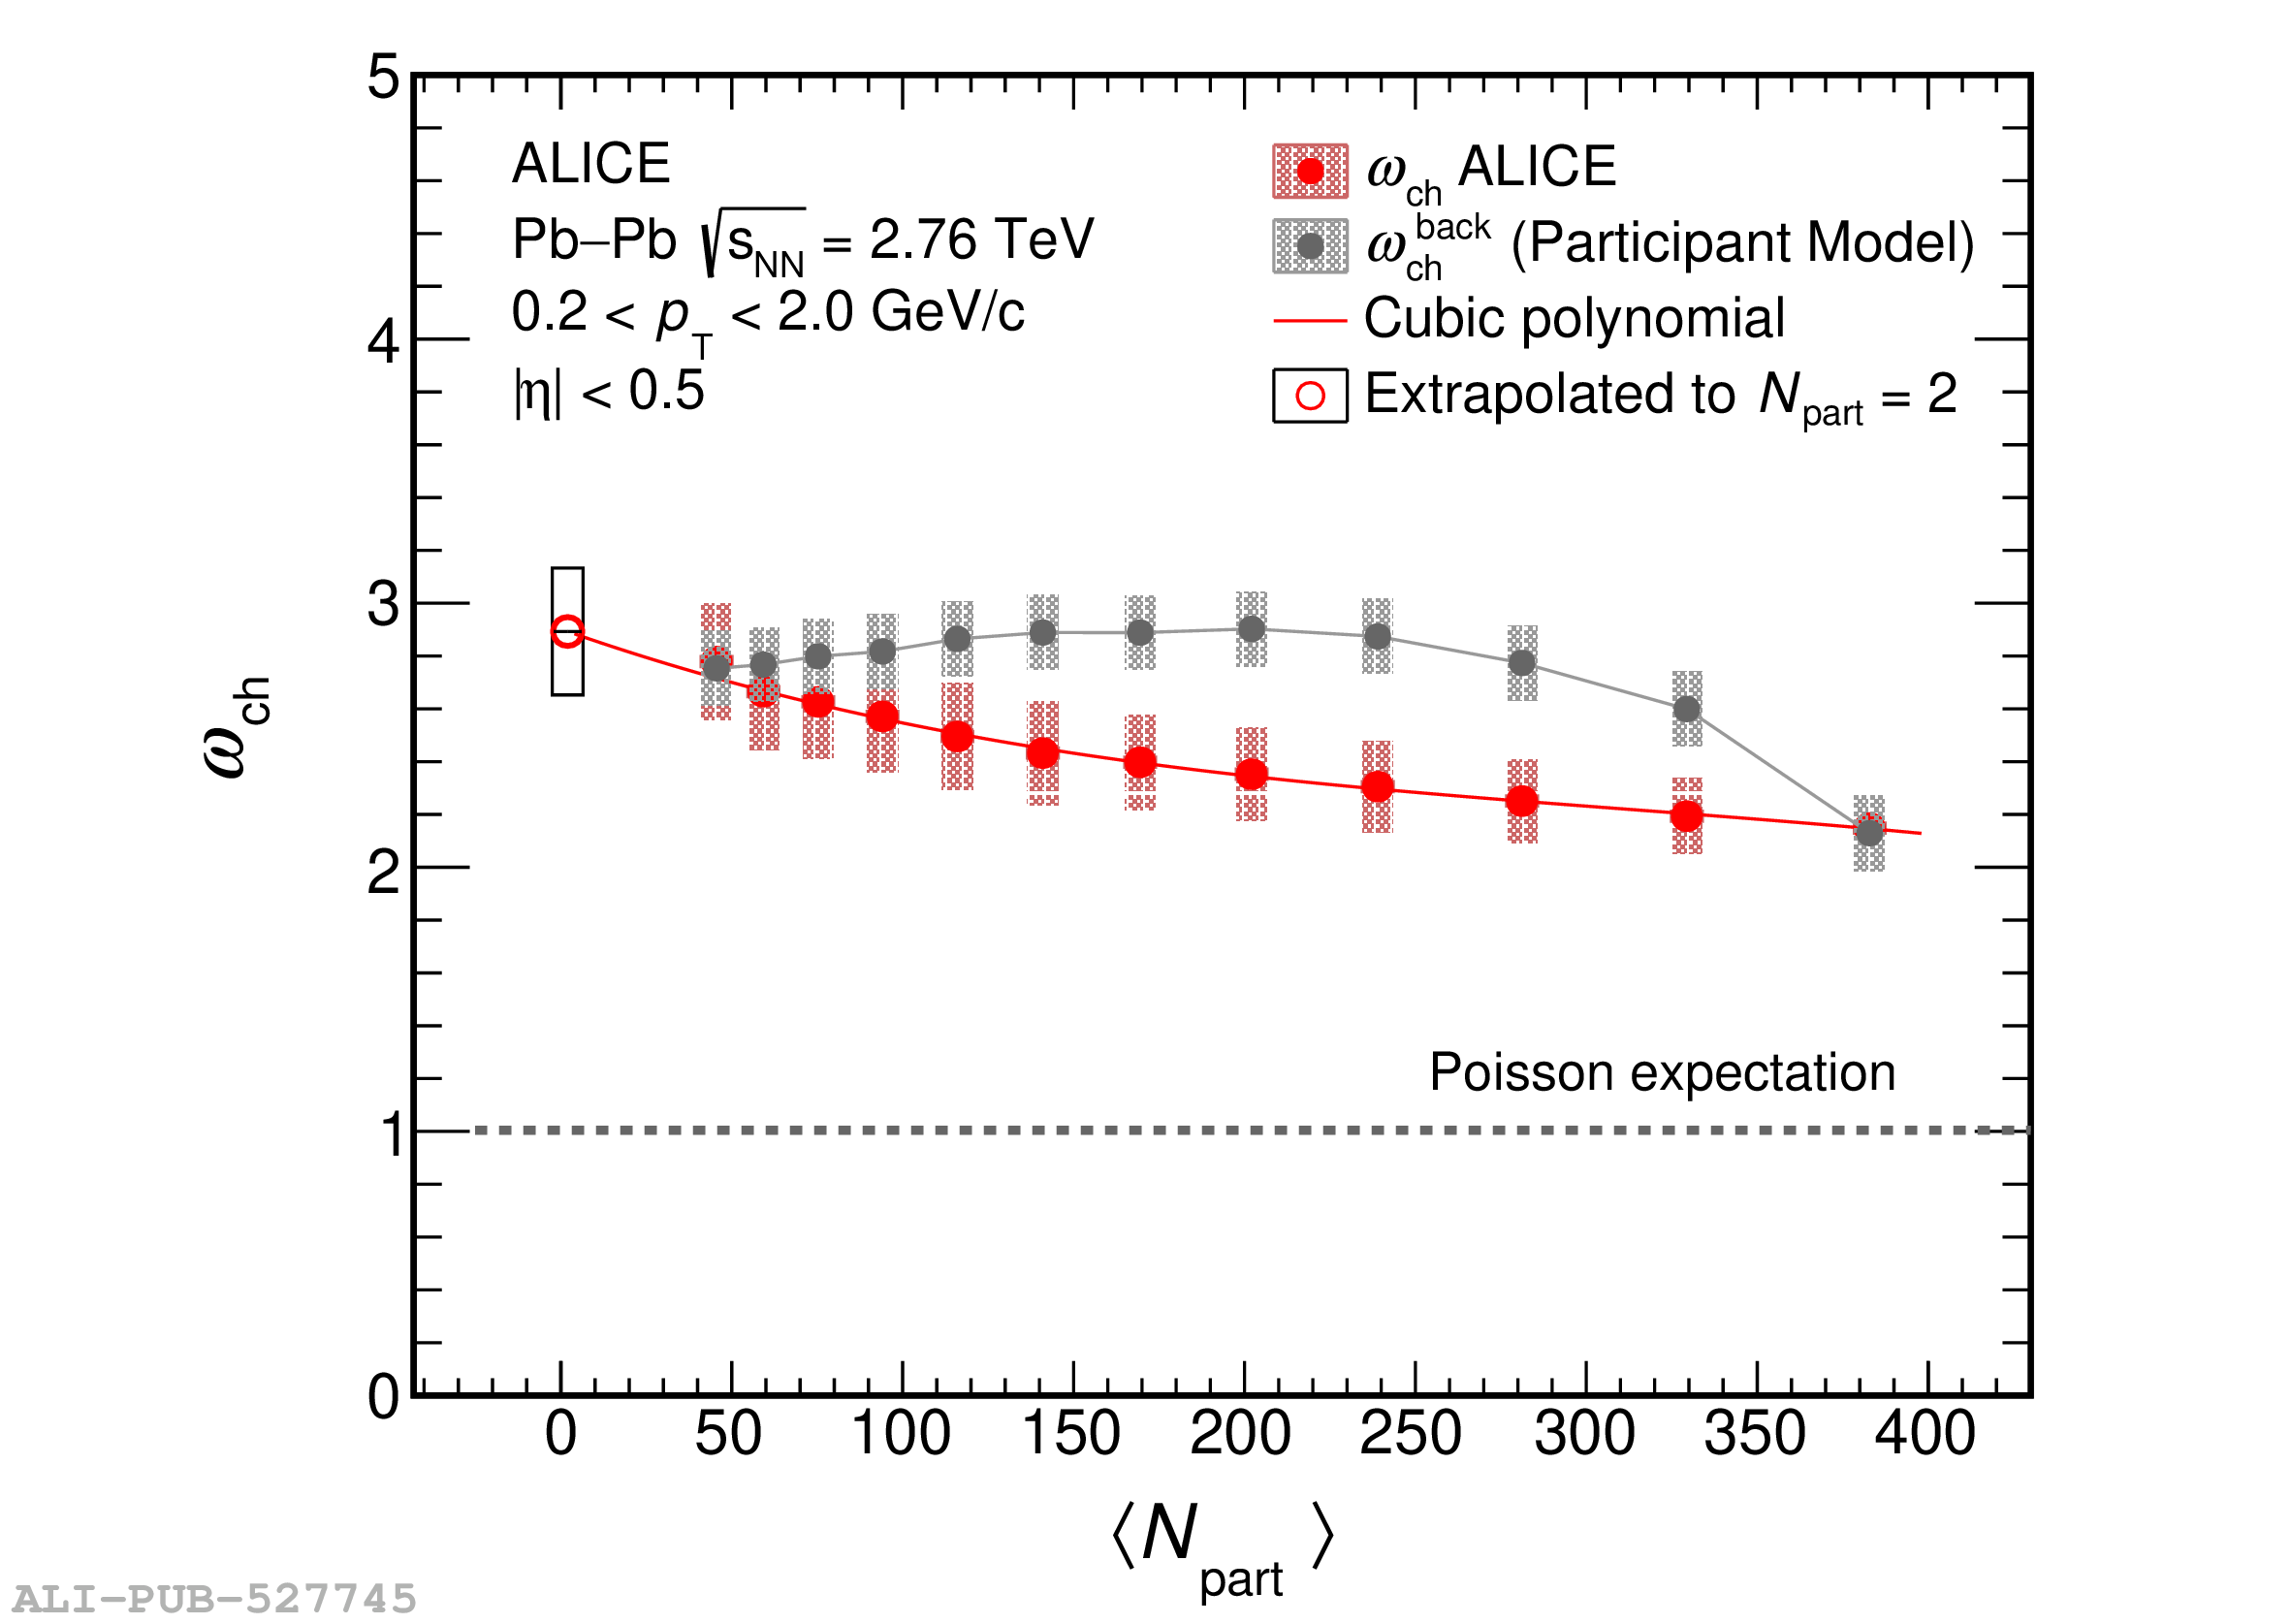 |